Interactive Visualizations
Carlos Castillo-Passi1,2,3
1School of Biomedical Engineering and Imaging Sciences, King's College London, London, United Kingdom, 2Institute for Biological and Medical Engineering, Pontificia Universidad Católica de Chile, Santiago, Chile, 3Millennium Institute for Intelligent Healthcare Engineering (iHEALTH), Pontificia Universidad Católica de Chile, Santiago, Chile
1School of Biomedical Engineering and Imaging Sciences, King's College London, London, United Kingdom, 2Institute for Biological and Medical Engineering, Pontificia Universidad Católica de Chile, Santiago, Chile, 3Millennium Institute for Intelligent Healthcare Engineering (iHEALTH), Pontificia Universidad Católica de Chile, Santiago, Chile
Synopsis
Keywords: Transferable skills: Software engineering, Transferable skills: Reproducible research
Unlock the potential of your data using interactive visualizations! Join us to discover how libraries like Plotly can transform the way you present and share your findings with minimal additional effort. In this talk we will learn practical skills to embed interactive plots in Jupyter Notebooks and publish them on platforms like GitHub pages to increase the impact of your research.Talk Outline
I. Introduction to Interactive Visualizations and Plotly- Overview of interactive visualizations
- Introduction to Plotly
- Advantages of interactive plots for sharing data
- 1D: Pulse sequences (Pulseq) and signals
- 2D: Images and heatmaps
- 2D+time: CINE
- 3D: Volumetric data
- Multi-contrast data: quantitative MRI (T1 mapping and T2 mapping)
- Multi-dimensional data: diffusion MRI
- Geo: Distribution of MRI scanners in the world
- Using Jupyter Notebooks
- Exporting HTML files using Plotly
- Publishing to GitHub pages
V. Conclusion and Recap
- Summary of key points
- Encouragement for embracing interactive visualizations in research communication
Acknowledgements
The author acknowledges financial support from: (1) BHF RG/20/1/34802 (2) EPSRC EP/V044087/1 (3) ANID Millennium Institute iHEALTH, ICN2021_004; (4) Fondecyt 1210637; (5) Fondecyt 1210638; (6) Fondequip Mayor EQY210003; (7) PhD program in Biological and Medical Engineering of the Pontificia Universidad Católica de Chile; (8) Chan Zuckerberg Initiative through the LIBRE hub.References
Plotly in Python https://plotly.com/python/
Plotly in Julia https://plotly.com/julia/
Figures
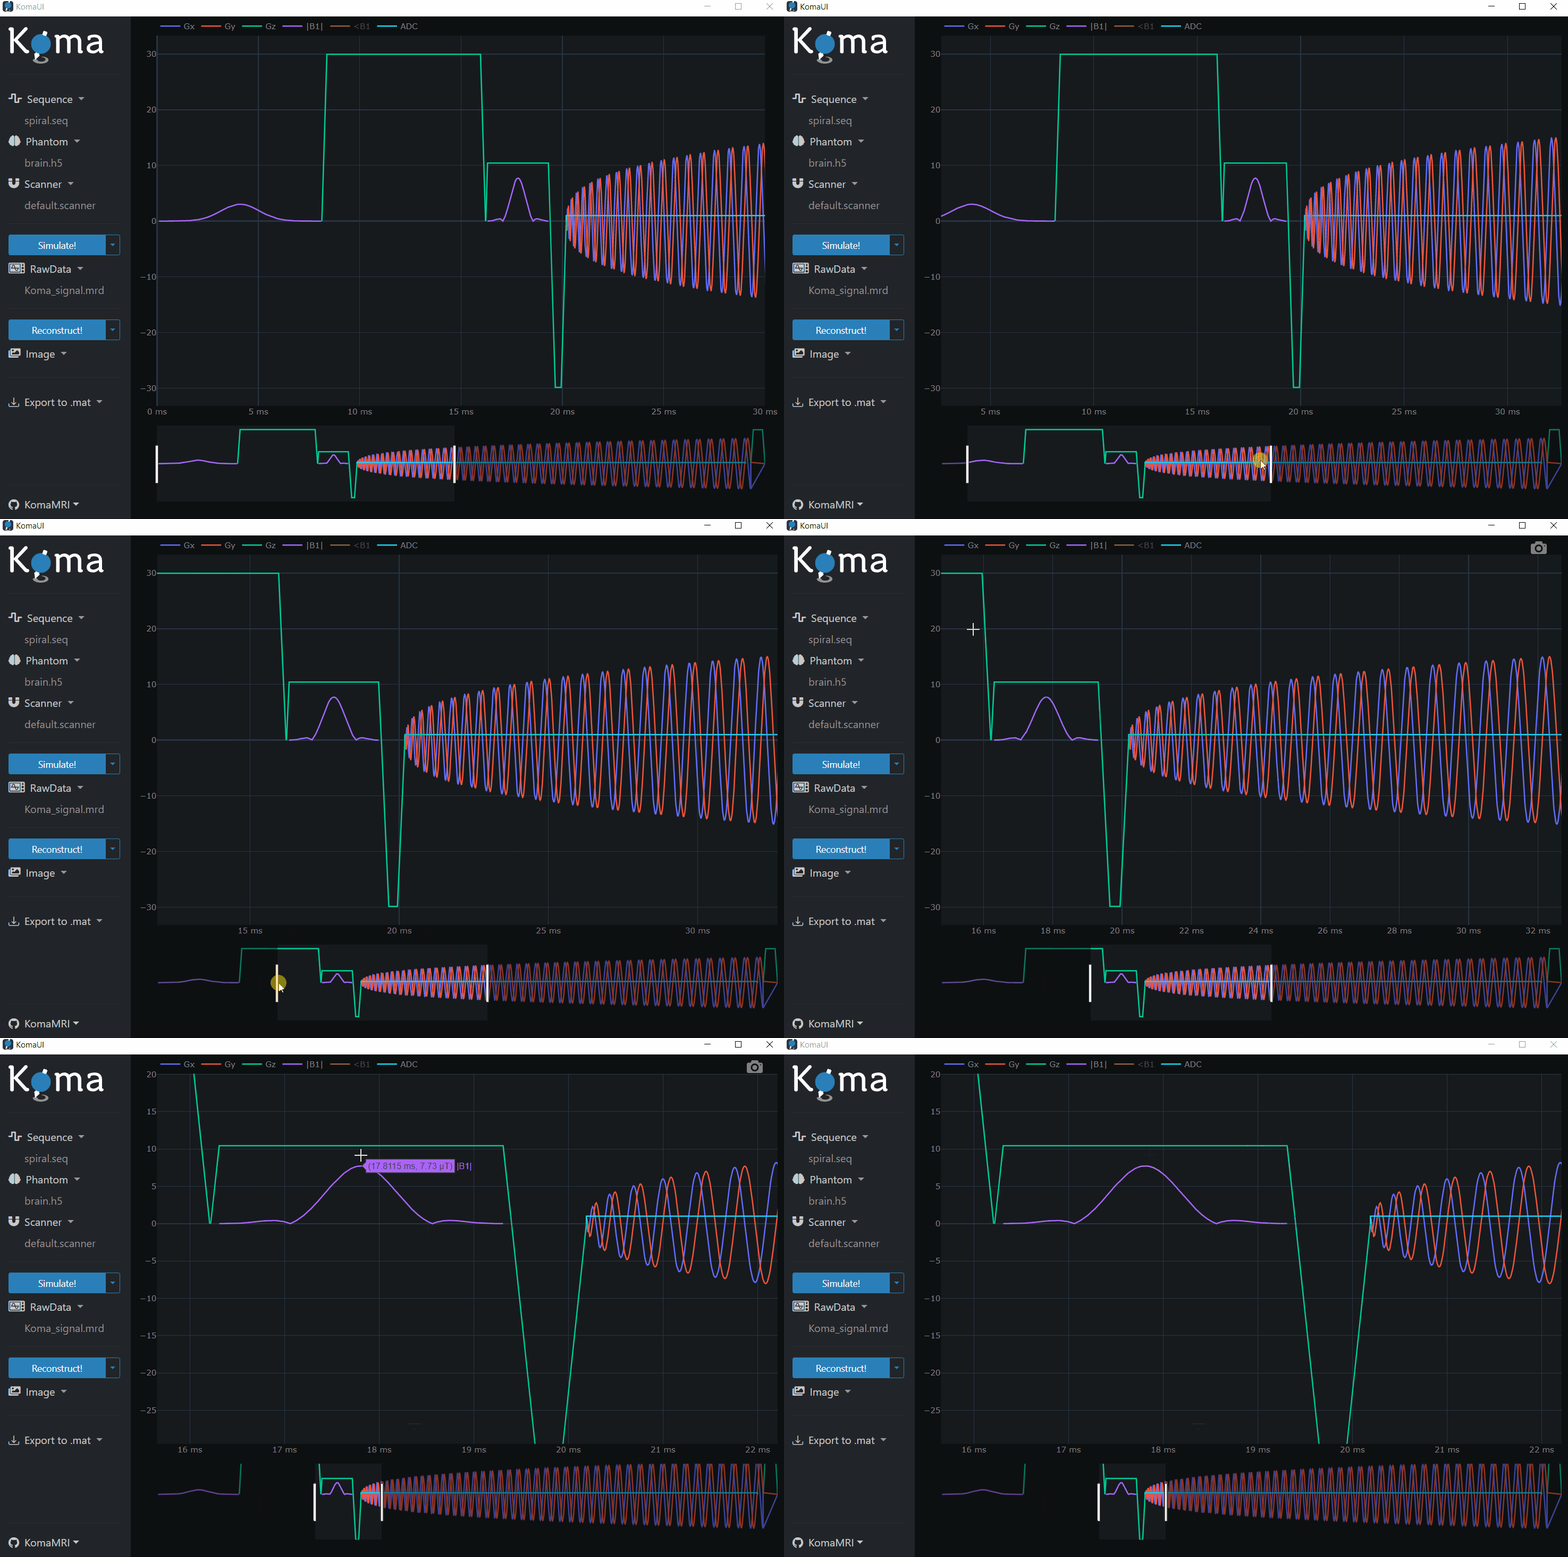
(Click me!) An interactive plot is embedded in an Electron app (KomaMRI.jl).
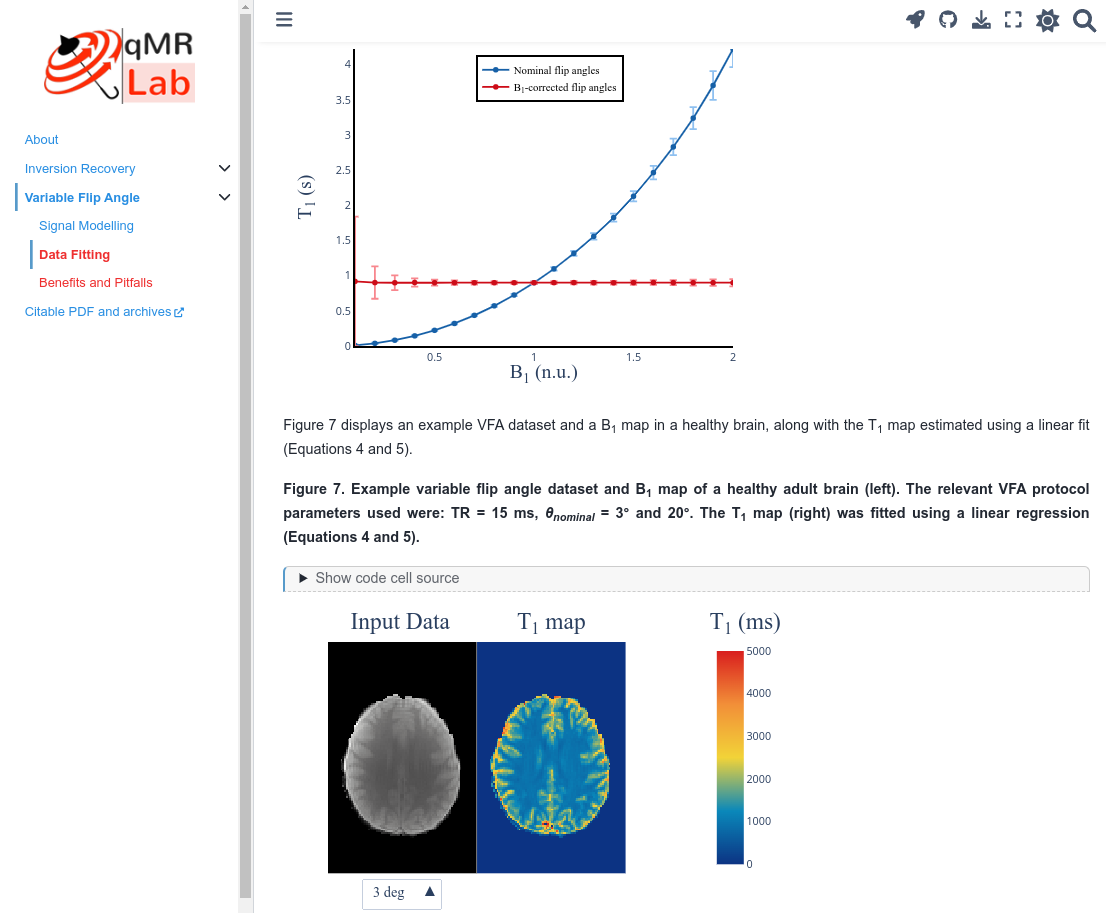
Interactive plots are used on a website to further explain the paper's findings (Quantitative T1 MRI, NeuroLibre).