9024
Early detection of Alzheimer’s disease in a transgenic rat model using CEST MRI
Teng Gong1, Nan Gao1, Wentao Jia2, Yifan Li1, and Xiaolei Song1
1Center for Biomedical Imaging Research, Department of Biomedical Engineering, Tsinghua University, Beijing, China, 2Department of lnformation Science and Technology, Northwest University, Xi'an, China
1Center for Biomedical Imaging Research, Department of Biomedical Engineering, Tsinghua University, Beijing, China, 2Department of lnformation Science and Technology, Northwest University, Xi'an, China
Synopsis
Motivation: There is a lack of effective MR tool for early diagnosis of AD.
Goal(s): To assess the value of CEST MRI for early detection of AD using a transgenic rat model.
Approach: CEST MRI scans for 10 AD rats and 9 age-matched wide-type (WT) controls were performed on 9.4T animal MR scanner. CEST signals were quantified using Lorentzian Difference, with signals at multiple frequency offsets quantified.
Results: Compared with WT rats, pCr and G-amine signals in several brain regions of AD rats were significantly decreased, which is expected to be used as biomarkers for early detection of AD.
Impact: The study provides evidence for early detection of AD in transgenic rat brains using in vivo CEST MRI and may promote clinical translation.
Introduction
Early detection of Alzheimer’s disease (AD) is crucial for timely intervention and better disease management1, but current anatomical MRI mainly enable diagnosis at an advanced stage. CEST MRI, as an emerging molecular MRI technique, has shown potential in the early diagnosis of AD2-5. Recently a comprehensive transgenic rat model (AppNL-G-F) showed the coexistence of Aβ and tau pathologies similar to human AD6. Herein, taking advantages of higher contrast-noise-ratio (CNR) for CEST imaging on 9.4T small animal scanner, we investigated the feasibility of the CEST MRI in detecting AD at an early stage in this model.Methods
9 wild-type (WT) rats and 10 AD rats, aged 3 months, were used in this study. All MRI experiments were performed on a 9.4T small-animal MR scanner (Bruker, BioSpec 94/30 USR). CEST images were acquired using a RAREst sequence with TE/TR = 3.6ms /5500 ms, Rare Factor = 31, Slice Thickness = 1.5 mm, FOV=24 mm ×18 mm, Resolution=0.25 mm×0.25 mm. CEST Z-spectra were acquired, with 31 optimized saturation offsets ranging from -10 to 10 ppm, with the saturation pulse of 0.7 𝜇T and 2500 ms in length. S0 was acquired at saturation offset of -200 ppm as a reference image. CEST imaging was performed on four different brain slices from rostral to caudal, named R, M (middle) 1, M2, C, respectively. M2 and C covered the hippocampus (Figure1). T2 image is used for slice selection and WASSR image is also collected for B0 correction. The CEST signals are quantified using Lorentzian Difference (LD), which is the difference between experimental Z-spectra and the reference Z-spectra of water pool. and the signal values of different brain regions were obtained through an automatic registration and segmentation pipeline.Results
First, we get quantitative CEST images of four slices. The average values of LD spectrum at 3.4~3.7 ppm, -4~-3 ppm, 2~ 2.3 ppm and 2.4~2.8 ppm represent the signals of amide proton transfer (APT), nuclear Overhauser enhancement (NOE), G-amine and phosphocreatine (pCr), respectively (Figure1).Subsequently, the study compared the CEST signals of the main brain regions on four slices. The statistical analysis revealed that, in the surveyed brain regions, there were no significant differences in APT and NOE signals between the 3-month-old AD rats and the WT controls. The G-amine and pCr signals showed varying degrees of reduction in the key brain regions (hippocampus, corpus callosum, striatum, etc.) at the M1 (Figure2), M2 (Figure3), and C, with the most significant changes observed at the M1 and M2.
Discussion
In this study, we observed decreased pCr and G-amine signals in several brain regions of 3-month-old AD rats, suggesting their potential as biomarkers for early detection of AD. The most significant differences were found at M1 and M2, indicating that the pathology may initiate from these two slices. APT signals reflect protein concentrations, and while previous studies have shown decreased APT signals in AD5,7, we did not observe this in our results, possibly due to the early disease stage of the model we employed where such changes may not be as pronounced. The next step of the study will involve integrating 1H/31P MRS to validate the correlation between MRS and CEST results.Conclusion
In conclusion, we utilized an automated segmentation program to compare CEST signals extracted from different brain regions, demonstrating the potential of CEST in early detection of AD in AppNL-G-F rat model. This could enhance the accuracy and efficiency of AD diagnosis, paving the way for personalized treatment strategies and disease monitoring.Acknowledgements
This work is partially supported by National Key R&D Program of China 2022YFC3602500,2022YFC3602503 and National Natural Science Foundation of China (NSFC) (Nos. 82071914).References
- Chen, Y., et al. Synaptic dysfunction in Alzheimer's disease: Mechanisms and therapeutic strategies. Pharmacology & Therapeutics, 2019, 195: 186-198.
- Chen, L., et al. Early detection of Alzheimer's disease using creatine chemical exchange saturation transfer magnetic resonance imaging. Neuroimage, 2021, 236.
- Chen, P., et al. Reduced cerebral glucose uptake in an Alzheimer’s rat model with glucose-weighted chemical exchange saturation transfer imaging. Frontiers in Aging Neuroscience, 2021, 13.
- Haris, M., et al. Imaging of glutamate neurotransmitter alterations in Alzheimer's disease. NMR in Biomedicine, 2012, 26(4): 386-391.
- Li, C., et al. Amide proton transfer imaging of Alzheimer's disease and Parkinson's disease. Magnetic Resonance Letters, 2023, 3(1): 22-30.
- Pang, K., et al. An App knock-in rat model for Alzheimer’s disease exhibiting Aβ and tau pathologies, neuronal death and cognitive impairments. Cell Research 2021, 32(2): 157-175.
- Wang, R., et al. Brain amide proton transfer imaging of rat with Alzheimer’s Disease using saturation with frequency alternating RF irradiation method. Frontiers in Aging Neuroscience, 2019, 11.
Figures
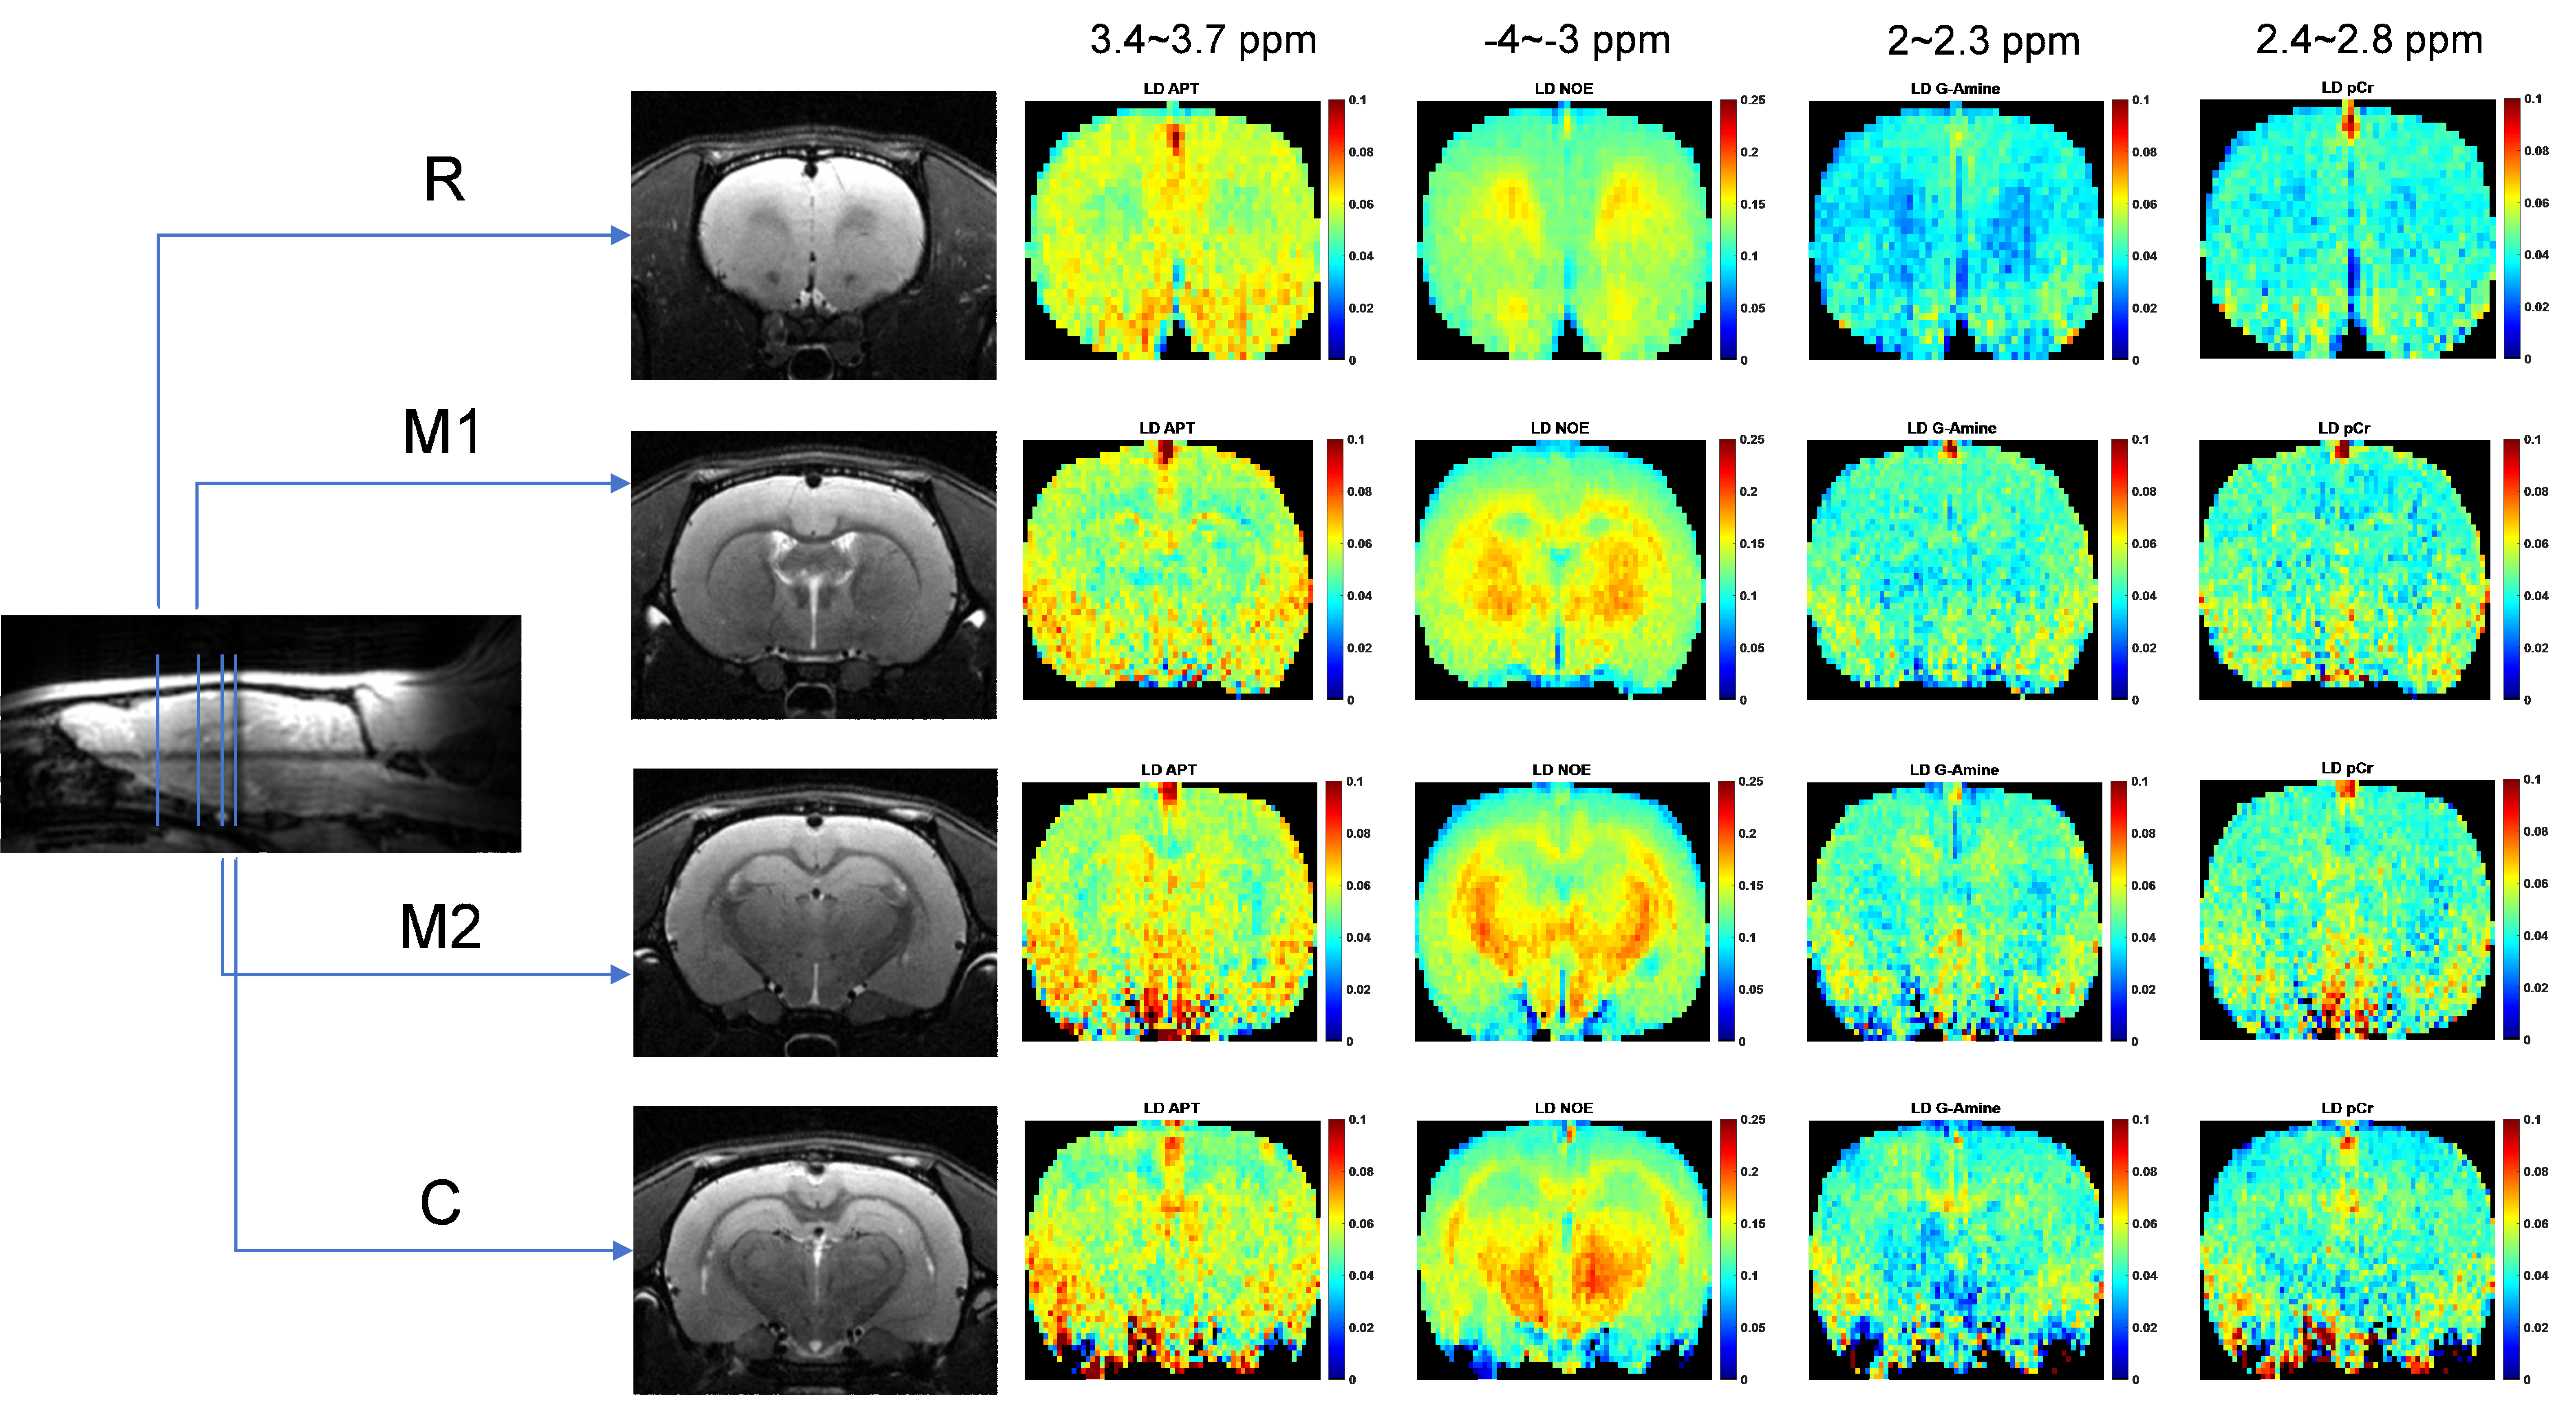
Figure 1 Four different slices of CEST imaging and the whole brain APT, NOE, G-amine and pCr signal maps obtained from LD quantification.
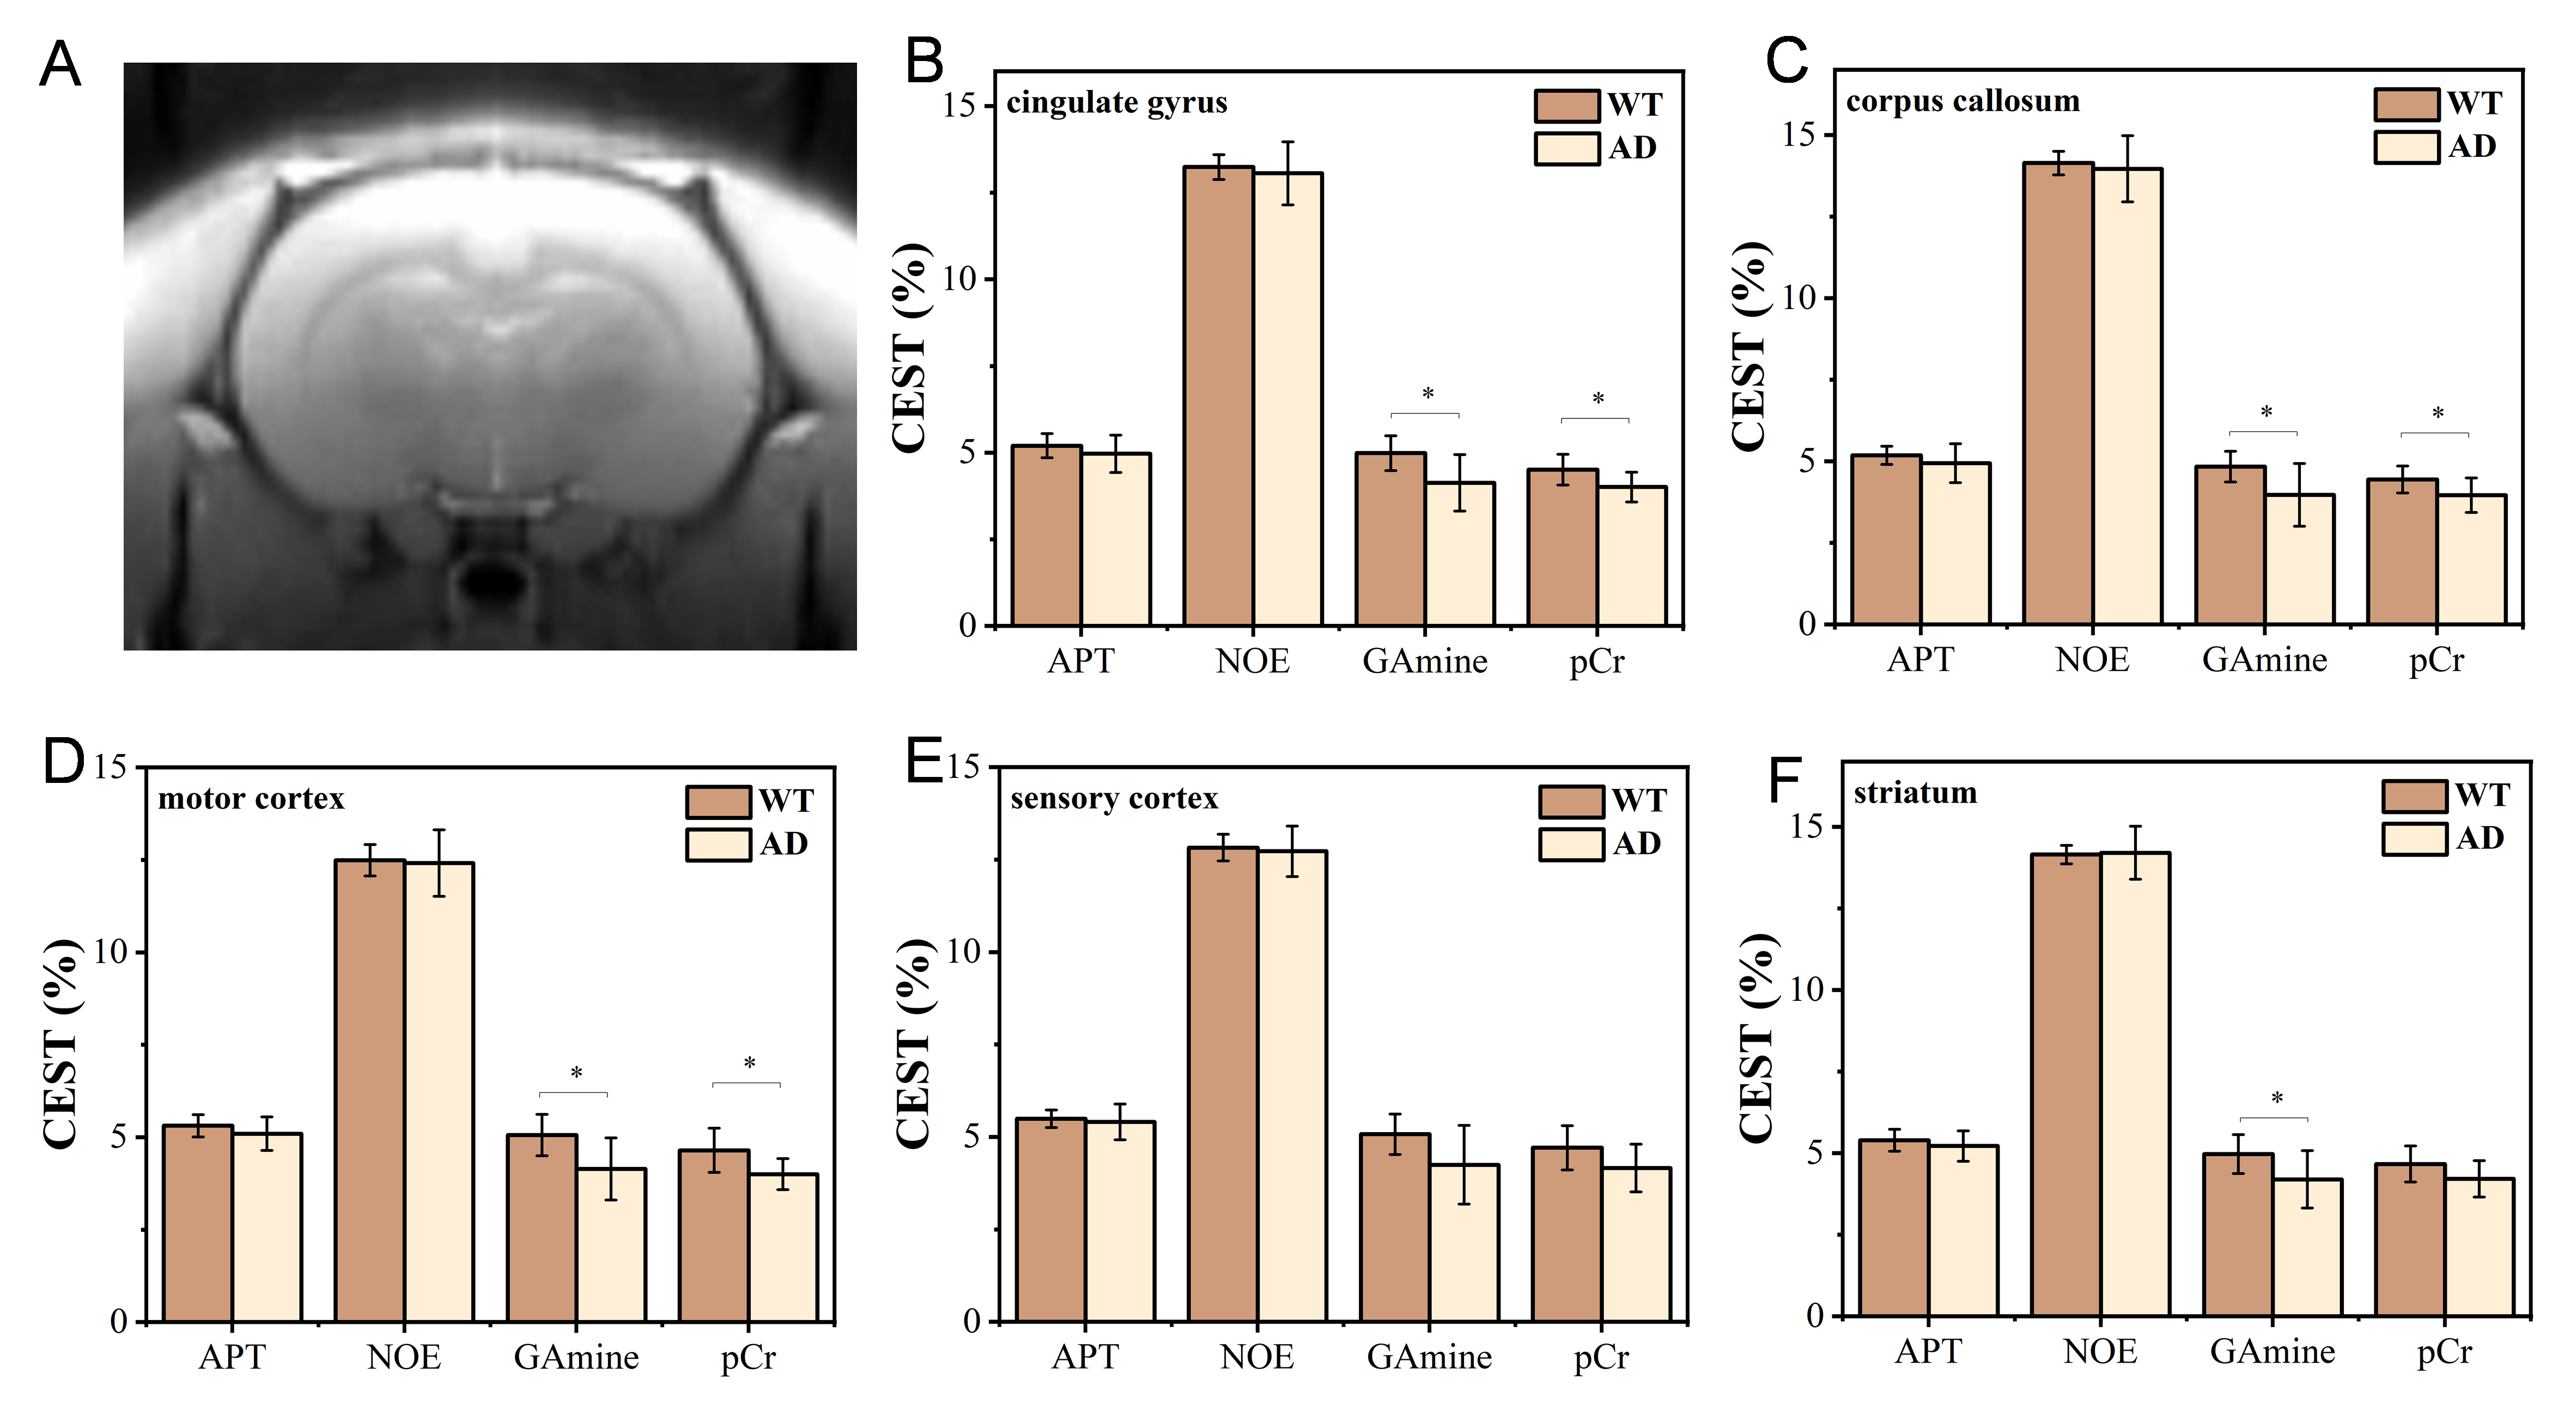
Figure 2 (A) CEST image of M1 slice. Comparison of CEST signals in (B) cingulate gyrus, (C) corpus callosum, (D) motor cortex, (E) sensory cortex, and (F) striatum. ∗p < 0.05, ∗∗p < 0.01
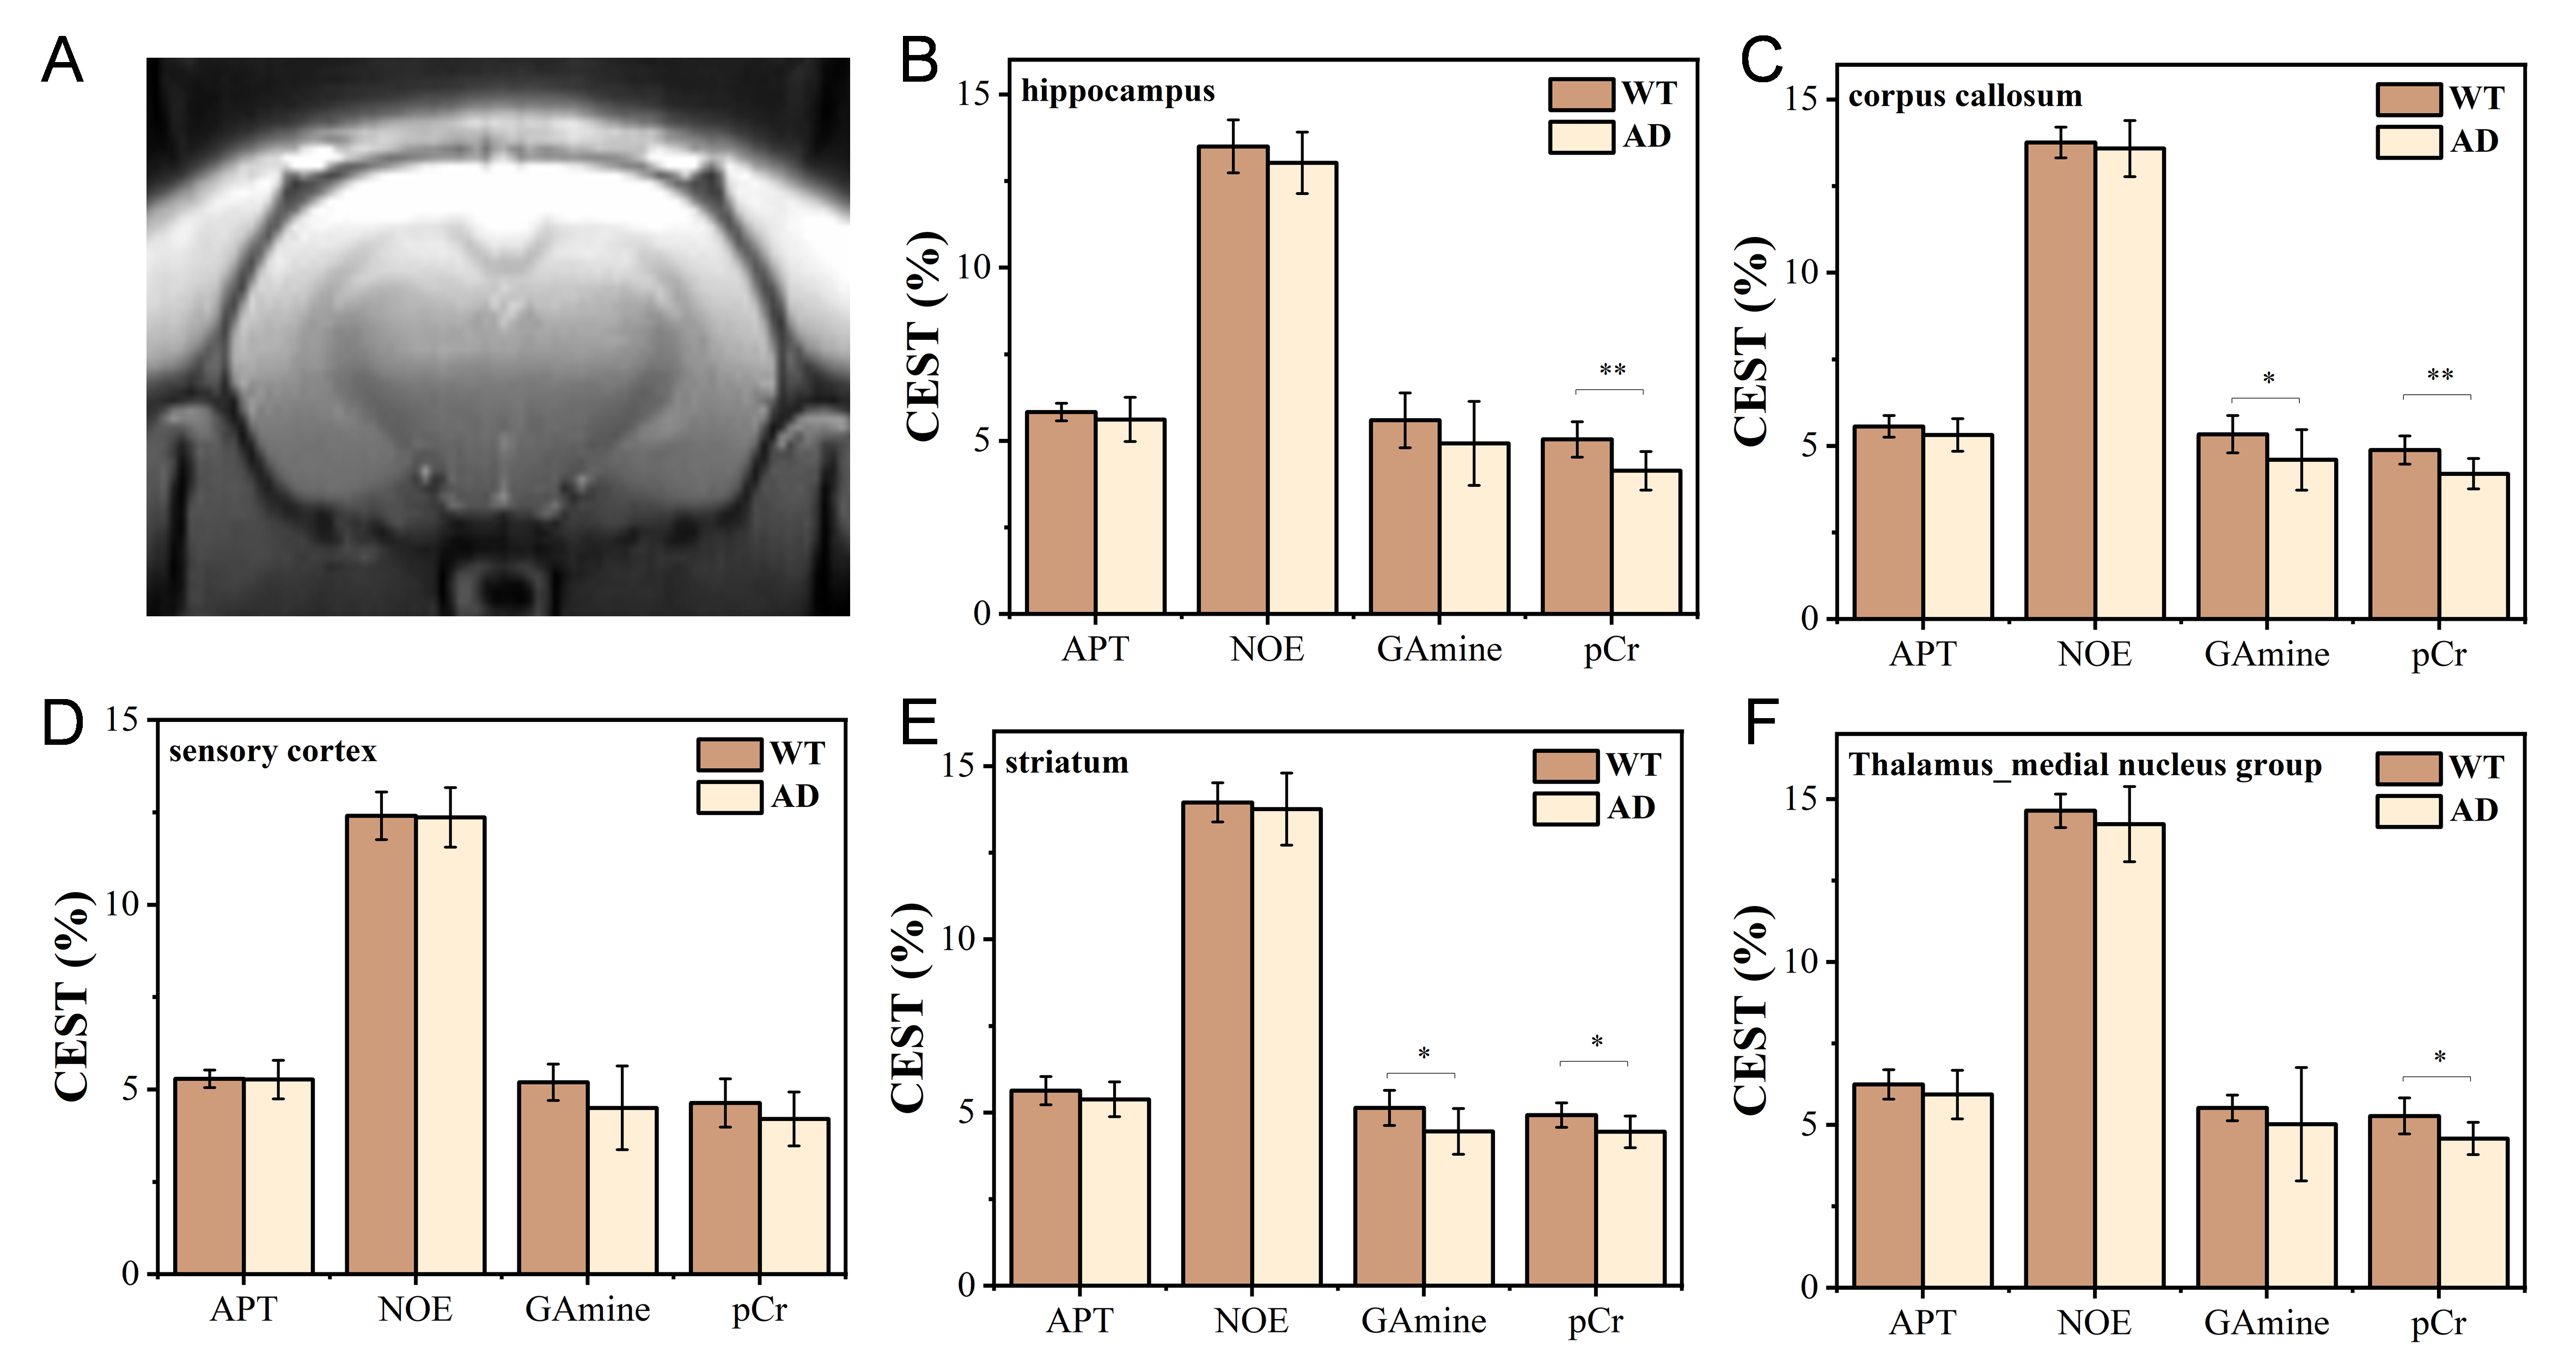
Figure 3 (A)
CEST image of M2 slice. Comparison of CEST signals in (B) hippocampus, (C)
corpus callosum, (D) sensory cortex, (E) striatum and (F) Thalamus_medial
nucleus group. ∗p < 0.05, ∗∗p < 0.01
DOI: https://doi.org/10.58530/2024/9024