9023
Protein-based Amide Proton Transfer MRI Signal as a biomarker for AD Immunotherapy Monitoring1Department of Radiology, Johns Hopkins University, Baltimore, MD, United States, 2Johns Hopkins University, Baltimore, MD, United States
Synopsis
Motivation: Rigorous monitoring is clearly needed to fully evaluate efficacy of new anti-amyloid therapeutics against AD.
Goal(s): To evaluate the value of protein-based APT MRI in monitoring AD immunotherapy efficacy and characterizing adverse events.
Approach: Both animal AD models and human subjects were studied, and a novel APT acquisition and quantitative analysis approach (EMR-APT) was used.
Results: The average APT signals were significantly higher in AD mice than in wild-type controls. Similarly, the MCI patients demonstrated significantly higher APT signals, compared to the normal controls.
Impact: A unique and innovative biomarker-stratified approach developed in this work will aid in assessing treatment efficacy accurately and identifying adverse events early.
INTRODUCTION:
A major hallmark of AD is the gradual accumulation and aggregation of toxic soluble and insoluble Aβ species in the brain. Randomized clinical trials demonstrated reduced brain Aβ burden using anti-amyloid immunotherapies,1,2 such as lecanemab,3 which has recently received traditional approval from the FDA. Amide proton transfer (APT) imaging is a relatively new protein-based molecular MRI technique that is based on endogenous mobile proteins and peptides in tissue.4,5 It is known that both extracellular amyloid and intracellular tau first exist as soluble monomers and oligomers,6,7 which are APT-detectable. The overall goal of this study is to demonstrate our central hypothesis that early AD patients should show high APT signals across brain regions due to the abnormal accumulation of various mobile proteins, including soluble Ab species, which would decrease for those who benefit from anti-amyloid immunotherapy.METHODS:
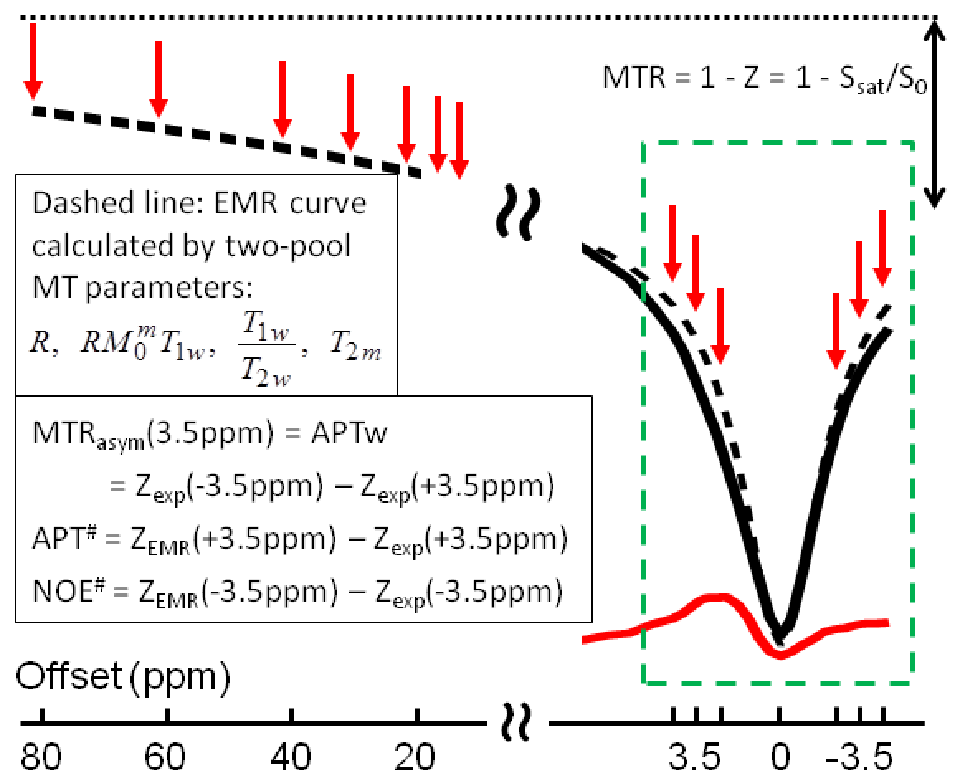
Both animal AD models and human subjects were used. Animal MRI experiments were performed on a Bruker 11.7T MRI scanner. 20 mice at ~3 months old, including 5 APPswe/PSEN1dE9 and 5 wild-type, and 5 Tau P301S and 5 wild-type, were used. APT images at four RF saturation powers (0, 1.3, 2, and 4 μT; saturation time = 3 sec; single-slice) were acquired. A novel APT acquisition and quantitative analysis approach using the extrapolated semi-solid MTC reference (EMR) signals to quantify the downfield APT and upfield NOE signals (called APT# and NOE#, respectively) was used,8,9 with 43 offsets = 200 (NA=2), 20, 18, … 6, ±4, ±3.75, ±3.5 (NA=6), ±3.25, ±3, ±2.5, ±2, … ±0.25, and 0 ppm. Water saturation transfer shift referencing (WASSR) images were acquired for correcting B0 inhomogeneity. T1 and T2 maps were also acquired.Human MRI experiments were carried on a Phillips 3T MRI scanner. 3D APT images (RF saturation power = 1.5 µT; saturation time = 1.5 sec; 16 offsets; 15 slices), together with single-slice z-spectra (56 offsets), were acquired (Fig. 1). Based on the EMR approach, the Z-spectrum data of seven large, positive offsets (80~8 ppm) will be acquired and fitted with a super-Lorentzian line shape.
The conventional APT-weighted image is defined as: APTw = MTRasym(3.5ppm) = [Ssat(-3.5ppm) – Ssat(+3.5ppm)] / S0 = Zexp(-3.5ppm) - Zexp(+3.5ppm). The EMR fitting was performed, as proposed previously.8,9 Then, APT# and NOE# were calculated: APT# = ZEMR(3.5ppm) - Zexp(3.5ppm) and NOE# = ZEMR(-3.5ppm) - Zexp(-3.5ppm). ROIs (hippocampus) were manually drawn on both sides. The median values of T1, T2, APTw, APT# and NOE# in the ROIs were counted. Group-based analysis of these values was performed.
RESULTS:
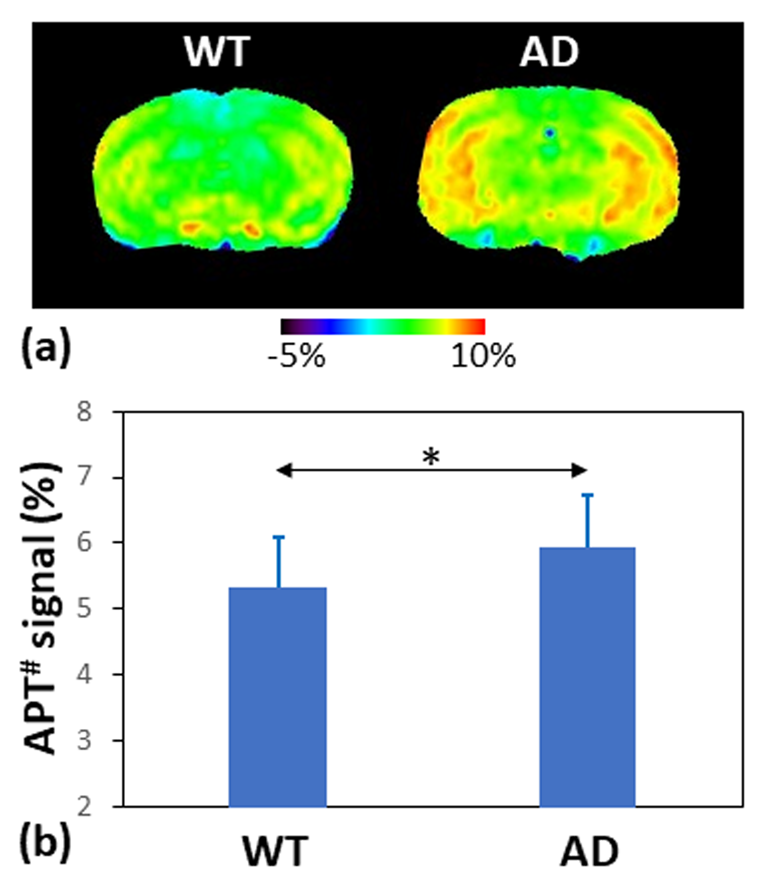
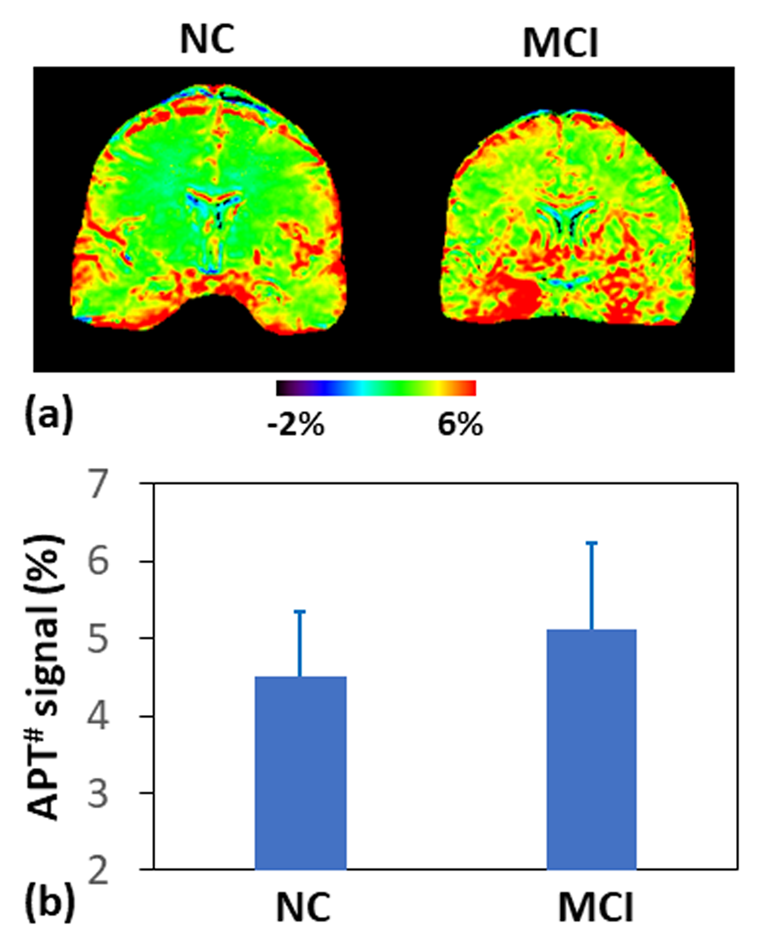
Fig. 2 shows two examples of APT# images for an APPswe/PSEN1dE9 mouse and a wild-type control (B1 = 2 µT). The average APT# signals were significantly higher in AD mice than in wild-type controls (p < 0.05). The T1/T2 values were 2259 ± 186 ms / 39.60 ± 0.70 ms in AD mice and 2265 ± 137 ms / 39.83 ± 0.73 ms in wild-type controls, and no statistically significant differences were found. Due to the small sample sizes, the Tau and APP mice were combined as the AD group, while two wild-type mice were combined as the control group.Fig. 3 shows APT# images for an MCI patient and a normal control. Compared to the normal controls, the MCI patients demonstrated significantly higher APT# signals across almost the whole brain.
DISCUSSION:
Based on the definition, APTw = APT# - NOE#. This suggests that the EMR-APT approach can achieve purer and higher APT signals (namely, APT#, 5% to 6%) than simply using the conventional APTw metric.10,11 In addition, our recent study has demonstrated that the deep-learning-based EMR method achieved high reproducibility and reliability in the quantification.12 The higher APT# signal in young AD mice (at 3 months old) could be attributed to the accumulation of abnormal soluble Ab and tau oligomers, which did not exist when insoluble plaques or neurofibrillary tangles develop later in old AD animals, as reported in a few previous studies.13-16 Several anti-amyloid immunotherapies, such as lecanemab, selectively target the most neurotoxic Aβ aggregates (oligomers and protofibrils) in early AD patients, which could be assessed sensitively by APT imaging.CONCLUSION:
Our early results show that APT imaging using EMR quantification can sensitively detect soluble amyloid and tau proteins in AD mice and MCI patients and has the potential to track decreases in these abnormal protein levels during anti-amyloid immunotherapy against AD.Acknowledgements
This studied was supported partially by grants from the NIH (R01AG06917 and UH3NS106937). The authors thank Ms. Carrie Wagandt and Ms. Isabel M. Rios Pulgar for patient recruitment.References
1. Yadollahikhales G et al. 2023;20:914-31. 2. Leisher S et al. CNS Drugs. 2023;37:671-7. 3. van Dyck CH et al. N Engl J Med. 2023;388:9-21. 4. Zhou J et al. Nature Med. 2003;9:1085-90. 5. Zhou J et al. J Magn Reson Imaging. 2019;50:347-64. 6. Hampel H et al. Mol Psychiatry. 2021;26:5481-503. 7. Gandy S et al. N Engl J Med. 2023;388:80-1. 8. Heo HY et al. Magn Reson Med. 2016;75:137-49. 9. Lee DH et al. Magn Reson Med. 2017;77:855-63. 10. Wang R et al. Chin Med J. 2015;128:615–9. 11. Zhang Z et al. NeuroImage. 2020; 25:102-153. 12. Heo et al. Magn Reson Med. 2024;91:1002-15. 13. Wells JA et al. NeuroImage. 2015;111:369-378. 14. Holmes HE et al. Neurobiol Aging. 2016;39:184-194. 15. Chen L et al. NeuroImage. 2019; 188:380-390. 16. Huang J et al. Magn Reson Imaging. 2022;87:1529-45.Figures