9022
Calculation of metabolite concentrations using linear combination of CEST Z-spactra -- a study on 9.4 T rodent datasets1Center for Biomedical Imaging Research, Department of Biomedical Engineering, Tsinghua University, Beijing, China, 2Department of lnformation Science and Technology, Northwest University, Xi'an, China, 3Nonhuman Primate Research Center, Tsinghua University, Beijing, China
Synopsis
Motivation: Lactate can be detected by both MRS and CEST. Compared to MRS, CEST imaging is faster due to its high sensitivity, but the low specificity limits it to qualitative study.
Goal(s): If deriving reliable quantitative maps from CEST Z-spectra is possible, the lactate imaging can be accelarated significantly.
Approach: On our rodent MRS and CEST dataset, we calculated the concentrations of lactate (and other metabolites) from single voxel MRS data as gold standard, and performed regression between them with the mean CEST Z-spectra of the same VOI.
Results: Preliminary results show lactate concentrations can be estimated by linear combination of Z-spectra.
Impact: Our preliminery work may provide a new insight into faster lactate imaging, that is, using a faster but less quantitative modality like CEST to acquire images and building the correlation of it with more reliable quantitative values.
Introduction
Chemical exchange saturation transfer (CEST) MRI has emerged as an exciting molecular tool that provides insights into distribution of endogenous solutes.The semi-quantitative concentration of a metabolite is often represented by the signal at specific frequency offsets corresponding to a characteristic group or exchangeable proton.However, a type of group is often shared by many different solutes. Hydroxyls, for example, the characteristic group of lactate, is often used to quantify glucose. Therefore, to calculate the content of a specific metabolite from Z-spectra, combining the information of different frequency offsets may help.Methods
2.1 Data PreparationThe retrospective data were collected on either rat brain or mouse brain on a Bruker Biospec 9.4T wide bore scanner from June 2023 to Oct 2023, using the 72-mm bird-cage as transmitter and the brain phase-array coils for receiver. Animal studies were approved by the Animal Care and Use Committee (ACUC) of Tsinghua University.
The dataset consists of 124 pairs of MRS and CEST in total,from 3 groups of animals with the same acquisition protocols. The dataset consists of 100 pairs on rodent brains, including ischemic lesions and normal tissue on longitudinal neonatal rats, the hippocampus of transgenic mice of Alzheimer Disease (AD), as well as AD models with A-beta injection.
2.2 CEST and MRS protocols
CEST images were acquired using a CW saturation pulse with 2.5-seconds in length and B1 of 0.7uT, followed by a single-slice RAREst sequence (RARE factor = 37). The S0 image was collected without saturation. Other imaging parameters were as follows: TR/TE = 5,500/3.52 ms, The slice thickness was 1 mm, field of view (FOV) was 28 × 21 mm2, and matrix size was 75 × 75. In total 32 saturation frequencies, which were densely sampled around amide offsets (3.4-3.7ppm), guanidium amine and pCr (1.9-2.5 ppm). To collect the NOE signals from aliphatic protons at the other side of water peak, saturation offset from -1 ppm to -5 ppm were collected with 1 ppm intervals. In addition, ±6, ±8, ±10 ppm and several frequencies near water were acquired for Lorentzian Difference (LD) fitting. The MRS sequence performed was single voxel point resolved spectroscopy (PRESS) sequence (TR/TE = 2500/16.1 ms, Naverages = 64; Npoints = 2048; spectral width = 6060 Hz), and the sizes of VOIs were varied dependent on experimental animals and disease models.
2.3 Data Analysis
ROIs on CEST quantitative images were coregistered to the MRS voxels. CEST quantification was performed using the LD analysis, which fits a single Lorentzian line as reference to remove DS and then takes the difference from experimental data as quantify saturation transfer contrast. Lorentzian fitting of the water signal was performed by using the Z-spectral ranges −0.5 to 0.5 and 5.5 to 6.0 ppm.1 The spectra of residual CEST signals were obtained by subtracting the experimental Z-spectra from the fitted spectra.
To calculate the metabolite concentrations measured by MRS, LCModel2 was utilized to fit the spectral lines, yielding concentrations of metabolites relative to total creatine and corresponding standard deviations (SD) represented by Cramér-Rao lower bounds. Relative concentrations with an SD > 20% were excluded in the following analysis.
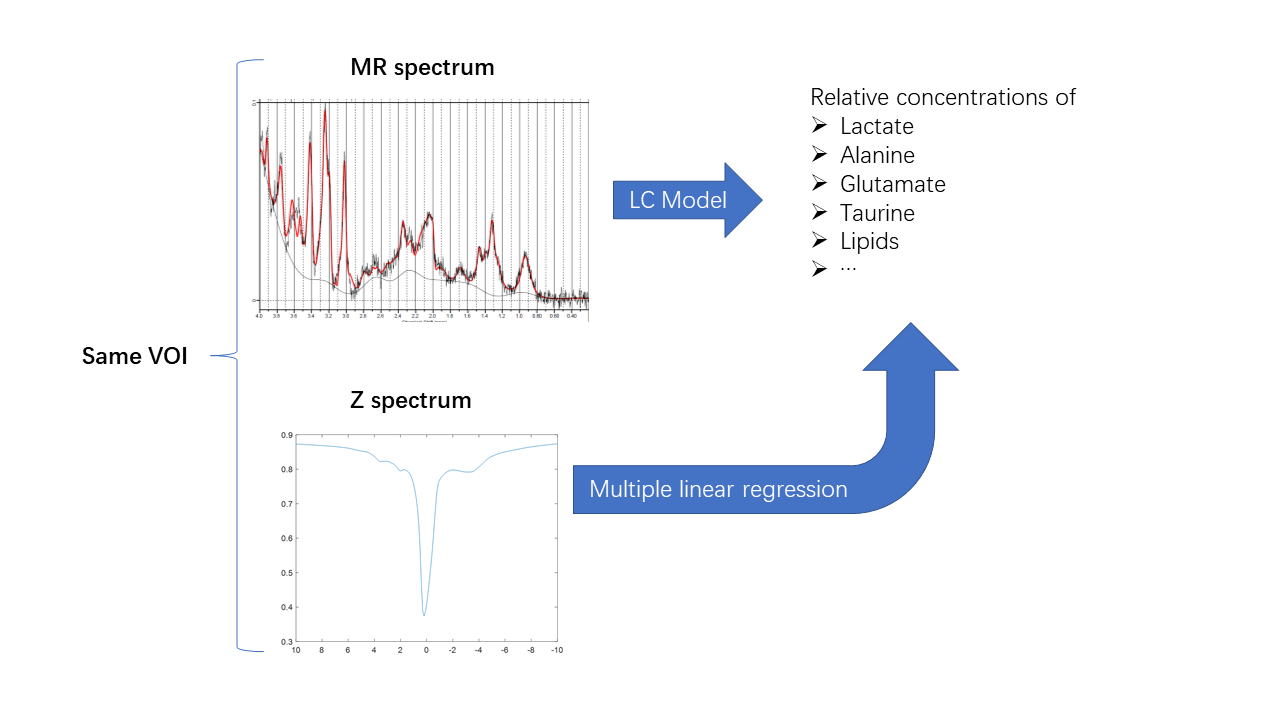
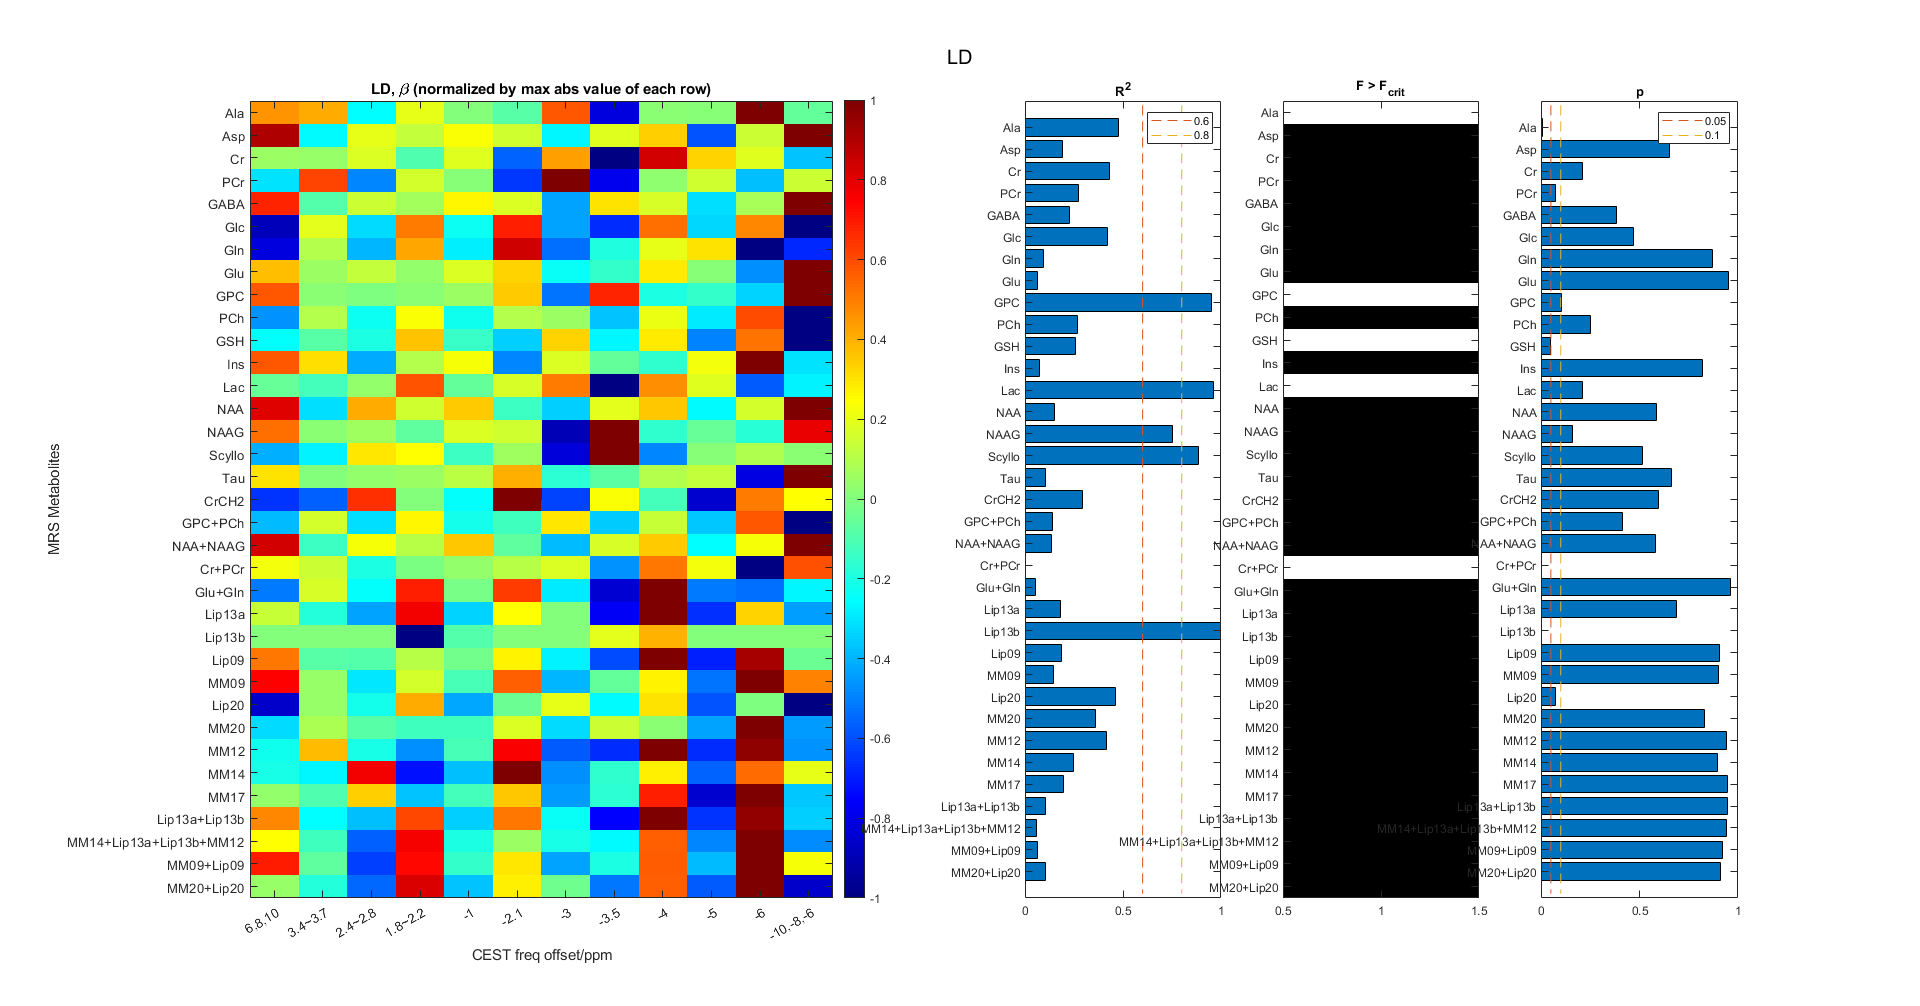
Multiple linear regression was performed to test the potential correlation between MRS and CEST signals, as Figure 1. A set of models were constructed, with LD spectra as their independent variables respectively, and relative concentrations derived from MRS as independent variables. Too many independent variables might lead to overfitting, so instead of densely sampled offsets we selected 12 offset sets, which are shown as the x labels in Figure 2, in which the sets containing more than one offset represent the mean values of LD at these offsets. Critical p value was set to 0.05, and for every single model, if its F statistic was greater than the corresponding critical F and p value was less than 0.05, the resulted coefficient of each independent variable could reflect its correlation with the relative concentration.
Results
The results are shown in Figure 2. The model of lactate gives an acceptable fitting performance, including an R2 close to 1, F value greater than critical F, and a p value less than 0.05. None of the models of the other metabolites pass all the three tests.Conclusion and Discussion
Our preliminary results imply that it is possible to estimate the concentrations of MRS detectable metabolites, like lactate, from CEST Z-spectra. Further validation requires more specific experiments. The model we used here is quite simple, and in the future more complicated models with stronger interpretability may lead to a more convincing outcome.Acknowledgements
This work is partially supported by National Key R&D Program of China 2022YFC3602500,2022YFC3602503 and National Natural Science Foundation of China (NSFC) (Nos. 82071914).
References
[1] Bie, C. , Li, Y. , Zhou, Y. , Bhujwalla, Z. M. , Song, X. , & Liu, G. , et al. (2022). Deep learning-based classification of preclinical breast cancer tumor models using chemical exchange saturation transfer magnetic resonance imaging. NMR in biomedicine, 35(2), e4626.
[2] Provencher S. W. (1993). Estimation of metabolite concentrations from localized in vivo proton NMR spectra. Magnetic resonance in medicine, 30(6), 672–679. https://doi.org/10.1002/mrm.1910300604.
Figures