9020
Simultaneous neuromelanin and nigrosome1 imaging using a single 3D multi-echo GRE sequence1Heuron, Seoul, Korea, Republic of, 2Department of Radiology, Soonchunhyang University Bucheon Hospital, Bucheon, Korea, Republic of
Synopsis
Motivation: Neuromelanin and nigrosome1 imaging are each instrumental in diagnosing Parkinson's disease but have been utilized separately due to constraints like extended scan time.
Goal(s): To propose a 3D multi-echo GRE sequence for simultaneous imaging of neuromelanin and nigrosome1 that can be executed in a clinical setting (~5min).
Approach: The previously suggested protocols for neuromelanin and nigrosome1 imaging were modified. DL-based analyses are employed for the automated detection and segmentation of neuromelanin, and for identifying the nigrosome1 regions.
Results: The proposed method yields reliable estimates of neuromelanin-related volumes and identifies the nigrosome1 regions within a clinically acceptable scan time.
Impact: A simultaneous neuromelanin and nigrosome1 imaging protocol was implemented within a practically feasible scan time. It achieved robust visualization of the loss of the swallow tail sign and demonstrated strong sensitivity to changes in the neuromelanin signal.
Introduction
The neuromelanin (NM) and nigrosome1 (N1) imaging techniques have been employed and evaluated in Parkinson’s disease (PD)1-5. Typically, NM contrast is enhanced by magnetization transfer (MT) pulses, and N1 contrast is enhanced through susceptibility weighting for the surrounding iron-rich regions. Given the differing contrast mechanisms of the two images, separate scans are usually necessary to obtain both contrasts, requiring co-registration and data interpolation or the use of a template. Only one group has utilized a single two-echo 2D gradient echo (GRE) sequence to study NM and susceptibility weighted imaging, although an evaluation of N1 was not performed6.We propose a single 3D multi-echo GRE sequence for simultaneous NM and N1 imaging. This proposed method utilizes product sequences, requiring no alteration to a sequence, and can be executed within a practically acceptable scan time (~5min). Additionally, DL-based analyses are applied to differentiate PD patients from controls, detect and segment the loss of swallow tail sign, and identify NM signal changes.
Methods
Data acquisition: We modified the previously proposed N1 imaging protocol to simultaneously obtain NM contrast by incorporating two spatial saturation pulses available in the product sequences of all vendors, for MT-weighting7-9. Additionally, a 3D T1w scan was performed to estimate the magnetic resonance parkinsonism index (MRPI) for distinguish the progressive supranuclear palsy (PSP) patients.Total 24 data were acquired using the scan protocols employed on 3T MRIs (Siemens, VIDA/Skyra):
- 3D multi-echo GRE: Spatial saturation pulses are positioned both superior and inferior to the imaging volume, Thicksat = 80mm, Gapsat = 10mm, TR = 60ms, number of echoes = 4, TE = 4, 14, 26.5, 38.5ms, FA = 20°, voxel size = 0.8x0.8x1mm3, bandwidth = 130Hz/px, number of slices = 32, acceleration factor = 2, scan time = 4min 21sec.
- 3D T1w: TR = 2020ms, TE = 3ms, TI = 1200ms, voxel size = 0.6x0.6x0.6mm3, FA = 9o, acceleration factor = 2, scan time = 3min 43sec, total scan time = 8min 4sec.
Image processing & analysis: For N1 contrast, susceptibility map weighted images (SMWI) were reconstructed using data from the last three echoes, following the methodology outlined in previous studies8,9. For NM contrast, the first echo magnitude images were used. Additionally, the MRPI was calculated based on 3D T1w images, as referenced in prior literature10,11. The entire process is depicted in Figure1.
We quantified N1 and NM using models based on convolutional neural networks (CNN) and templates. Templates were created for N1 and NM based on methods described in the previous studies12,13. A segmentation model was constructed for SN segmentation and a parcellation model was constructed for spatial normalization of NM image. We modified the preivous N1 abnormality classification network using CNN-based models by adding additional 212 data described below and N1 quantitative volume information to determine abnormalities14. The 212 data (100 idiopathic PD (IPD) and 112 healthy control (HC)) obtained through the previously proposed NM and SMWI scan protocols were used for training these indivisual networks7,8. For IPD, the reference standard was derived from 18F-FP-CIT PET findings. The data acquired through the proposed protocol were applied to histogram normalization for NM, and both NM and SMWI images were analyzed according to the networks.
Results
The representative NM images of HC and IPD patients are presented in Figure2. The images from the HC display clear contrasts compared to those from the IPD. The measured SN volume values were 513mm³ and 152mm³, respectively, indicating that SN volumes are relatively larger in HC compared to IPD patients.Figure3 shows the robust demonstration of sensitivity to changes in the NM signal. The measured NM volume shows a reduction of approximately 32% in IPD patients compared to HCs.
The comparison results of N1 diagnostic performance, based on the 18F-FP-CIT PET results, are summarized in Table1. All the estimated values for sensitivity, specificity, positive predictive value (PPV), negative predictive value (NPV), and accuracy are >90%.
Figure4 displays example images of SMWI from both HC and IPD patients. Clear swallow tail signs were observed in the HC. However, the loss of swallow tail sign was detected in the IPD patient on both sides.
Discussion and Conclusion
We demonstrated that the proposed method for simultaneous NM and N1 imaging can provide reliable estimates of NM-related volumes of the SN and detect the N1 regions within a practically acceptable scan time (~5min). This multi-contrast approach can also provide quantitative information such as R2* and quantitative susceptibility maps for multi-parametric analysis without registration process. Our proposed method, based on product sequences, will be easily compatible with equipment from most MR vendors.Acknowledgements
We would like to appreciate Dr. PH Lee, Dr. SJ Chung, and Dr. SH Jeong for supporting the data acquisition.References
[1] Sasaki, M., Shibata, E., Tohyama, K., et al. Neuromelanin magnetic resonance imaging of locus ceruleus and substantia nigra in Parkinson's disease. Neuroreport. 2006;17(11):1215-1218.
[2] Trujillo, P., Summers, P. E., Ferrari, E., et al. Contrast mechanisms associated with neuromelanin-MRI. Magnetic Resonance in Medicine. 2017;78(5):1790–1800.
[3] Kwon, D. H., Kim, J. M., Oh, S. H., et al. Seven‐Tesla magnetic resonance images of the substantia nigra in Parkinson disease. Annals of neurology. 2012;71(2):267-277.
[4] Schwarz, S. T., Afzal, M., Morgan, P. S., et al. The ‘Swallow Tail’ Appearance of the Healthy Nigrosome–A New Accurate Test of Parkinson's Disease: A Case-Control and Retrospective Cross-Sectional MRI Study at 3T. PloS one. 2014;9(4):e93814.
[5] Noh, Y., Sung, Y. H., Lee, J., et al. Nigrosome 1 detection at 3T MRI for the diagnosis of early-stage idiopathic Parkinson disease: assessment of diagnostic accuracy and agreement on imaging asymmetry and clinical laterality. American Journal of Neuroradiology.2015;6(11):2010-2016.
[6] Langley, J., Huddleston, D. E., Chen, X., et al. A multicontrast approach for comprehensive imaging of substantia nigra. NeuroImage. 2015;112:7–13.
[7] Ji, S., Choi, E. J., Sohn B, et al. Sandwich spatial saturation for neuromelanin-sensitive MRI: Development and multi-center trial. NeuroImage. 2022; 1:264:119706.
[8] Nam, Y., Gho, S. M., Kim, D. H., et al. Imaging of nigrosome 1 in substantia nigra at 3T using multiecho susceptibility map‐ weighted imaging (SMWI). Journal of Magnetic Resonance Imaging. 2017;46(2):528-536.
[9] Gho, S. M., Liu C., Li W.,et al. Susceptibility map-weighted imaging (SMWI) for neuroimaging. Magnetic Resonance in Medicine. 2014;72(2):337-346.
[10] Morelli M., Arabia G., Salsone M., et al. Accuracy of Magnetic Resonance Parkinsonism Index for Differentiation of Progressive Supranuclear Palsy from Probable or Possible Parkinson Disease. Movement Disorders. 2011;26(3):527-533.
[11] Morelli M., Arabia G., Novellino F., et al. MRI measurements predict PSP in unclassifiable parkinsonisms: a cohort study. Neurology. 2011;77 (11): 1042-1047.
[12] Sung, Y. H., Noh, Y., Kim, E. Y. Early‐stage Parkinson's disease: Abnormal nigrosome 1 and 2 revealed by a voxelwise analysis of neuromelanin‐sensitive MRI. Human Brain Mapping. 2021;42(9): 2823-2832.
[13] Niaz, M. R., Ridwan, A. R., Wu, Y., et al. Development and evaluation of a high resolution 0.5 mm isotropic T1-weighted template of the older adult brain. NeuroImage. 2022;248:118869.
[14] Shin, D.H., Heo, H., Song, S., et al. Automated assessment of the substantia nigra on susceptibility map-weighted imaging using deep convolutional neural networks for diagnosis of Idiopathic Parkinson's disease. Parkinsonism & Related Disorders. 2021;85:84-90.
Figures
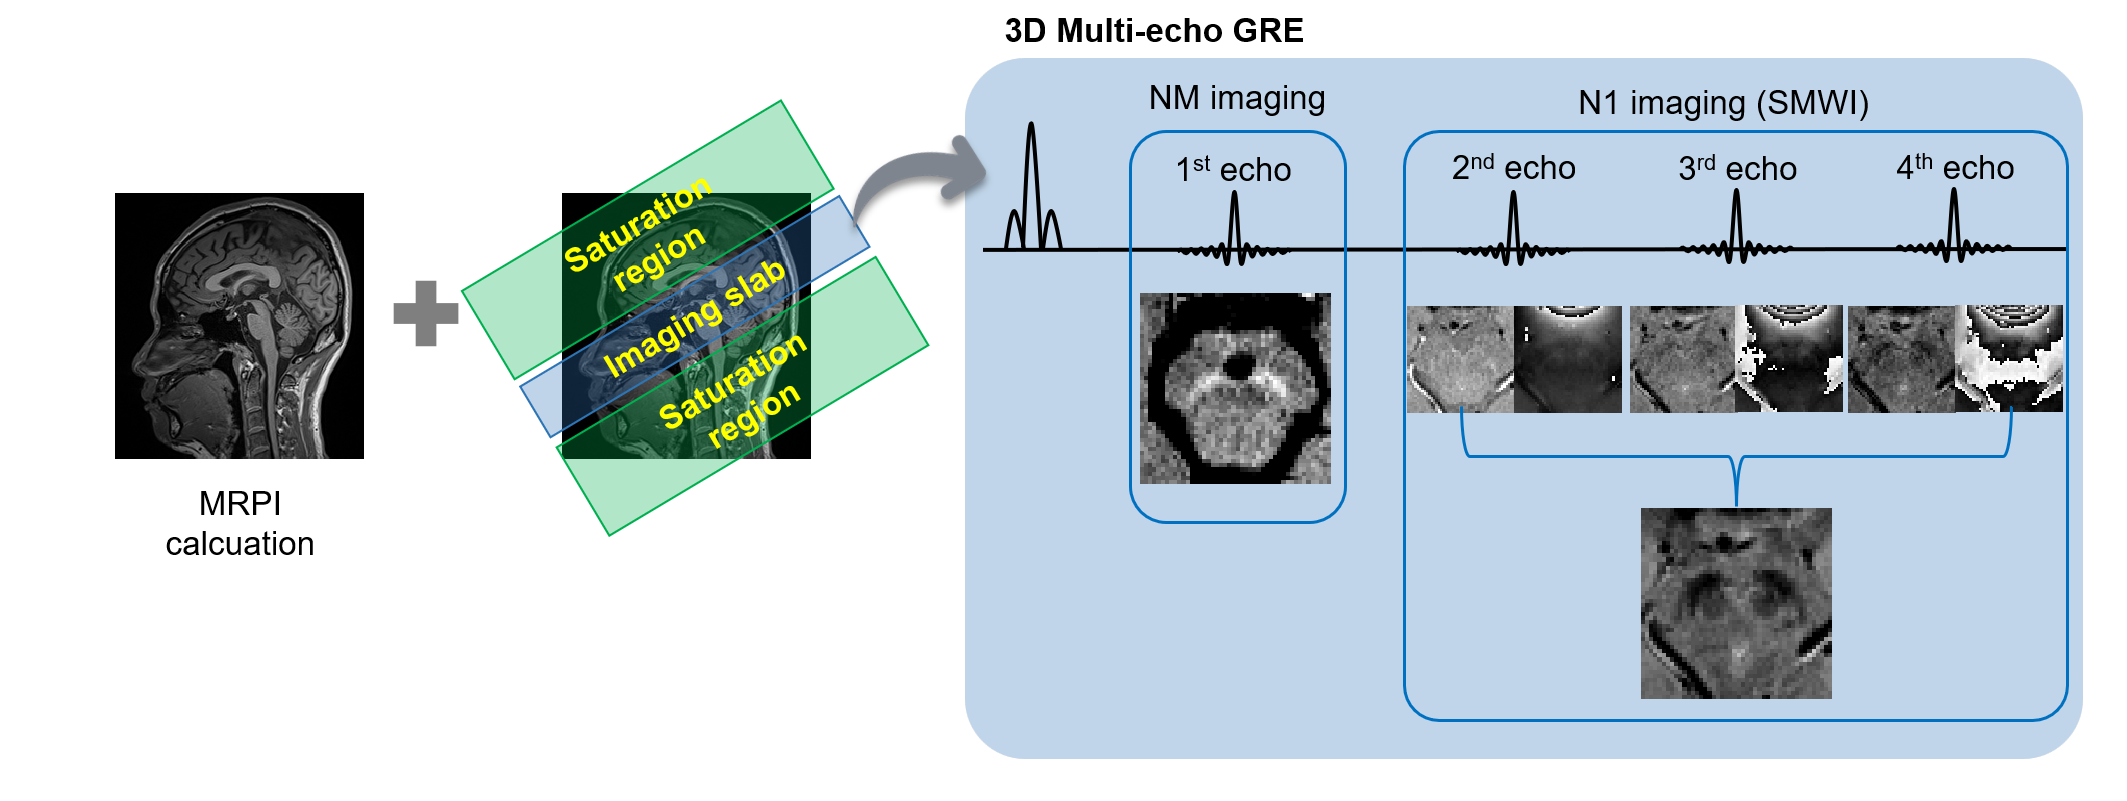
Figure1: Overall process of 3D T1w and simultaneous NM and N1 imaging.
3D T1w imaging is utilized for distinguishing PSP through the calculation of the MRPI. In the 3D multi-echo GRE sequence, the magnitude of the first echo is used for NM imaging, while the magnitude and phase of the remaining echoes are employed to reconstruct the SMWI.
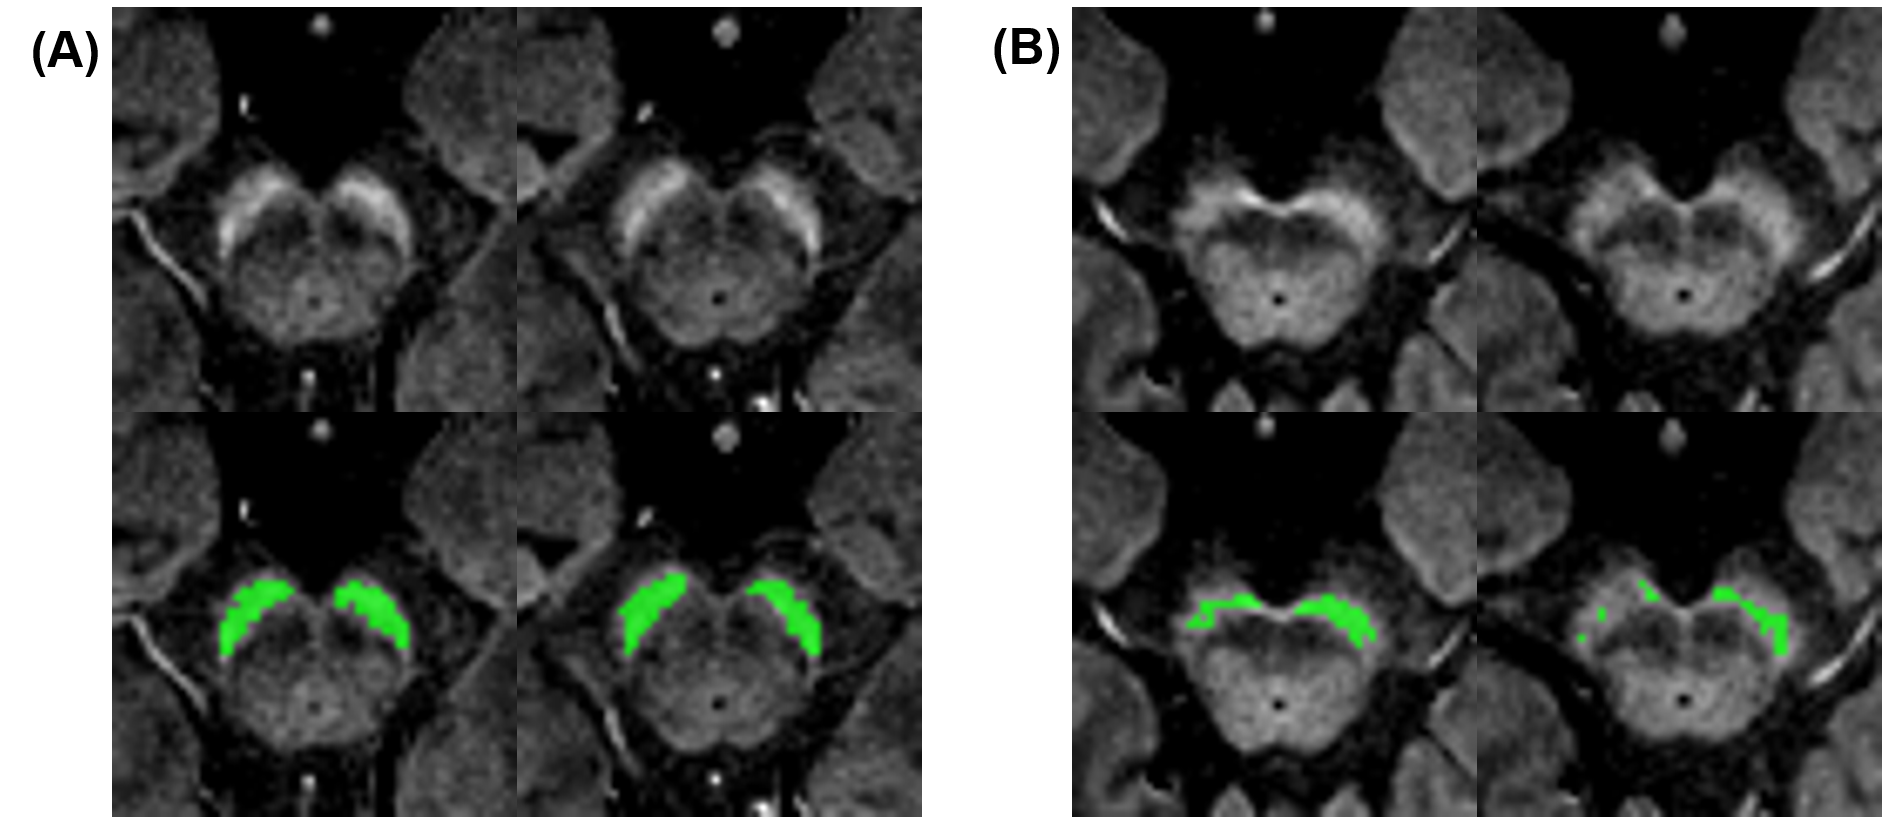
Figure2: NM results for both HC and IPD patient.
Representative slices in a HC ((A), a 46-year-old male case) and a patient with IPD ((B), a 74-year-old female case). The figure demonstrates a reduction in NM signal intensity in the SN of the patient. Automatically segmented hyperintensity areas are indicated by green ROIs in the bottom rows.
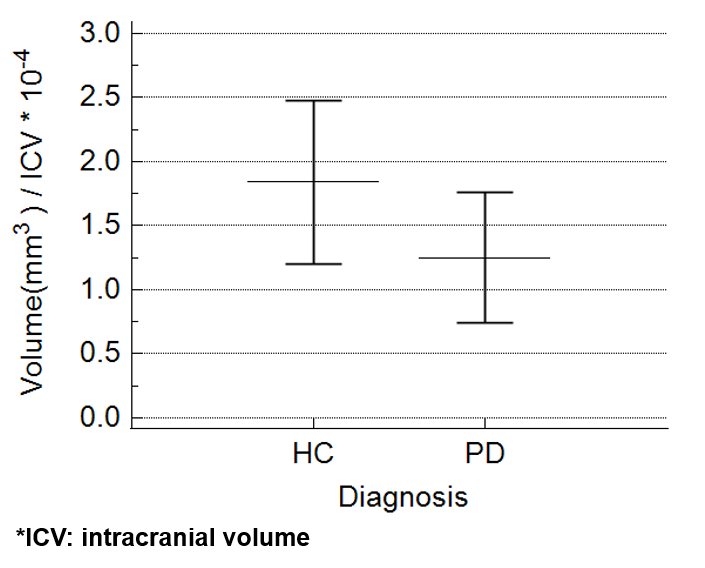
Figure3: Estimated NM volumes from HC and IPD.
The measured volume of NM exhibits a decrease of approximately 32% in patients with IPD compared to HC.
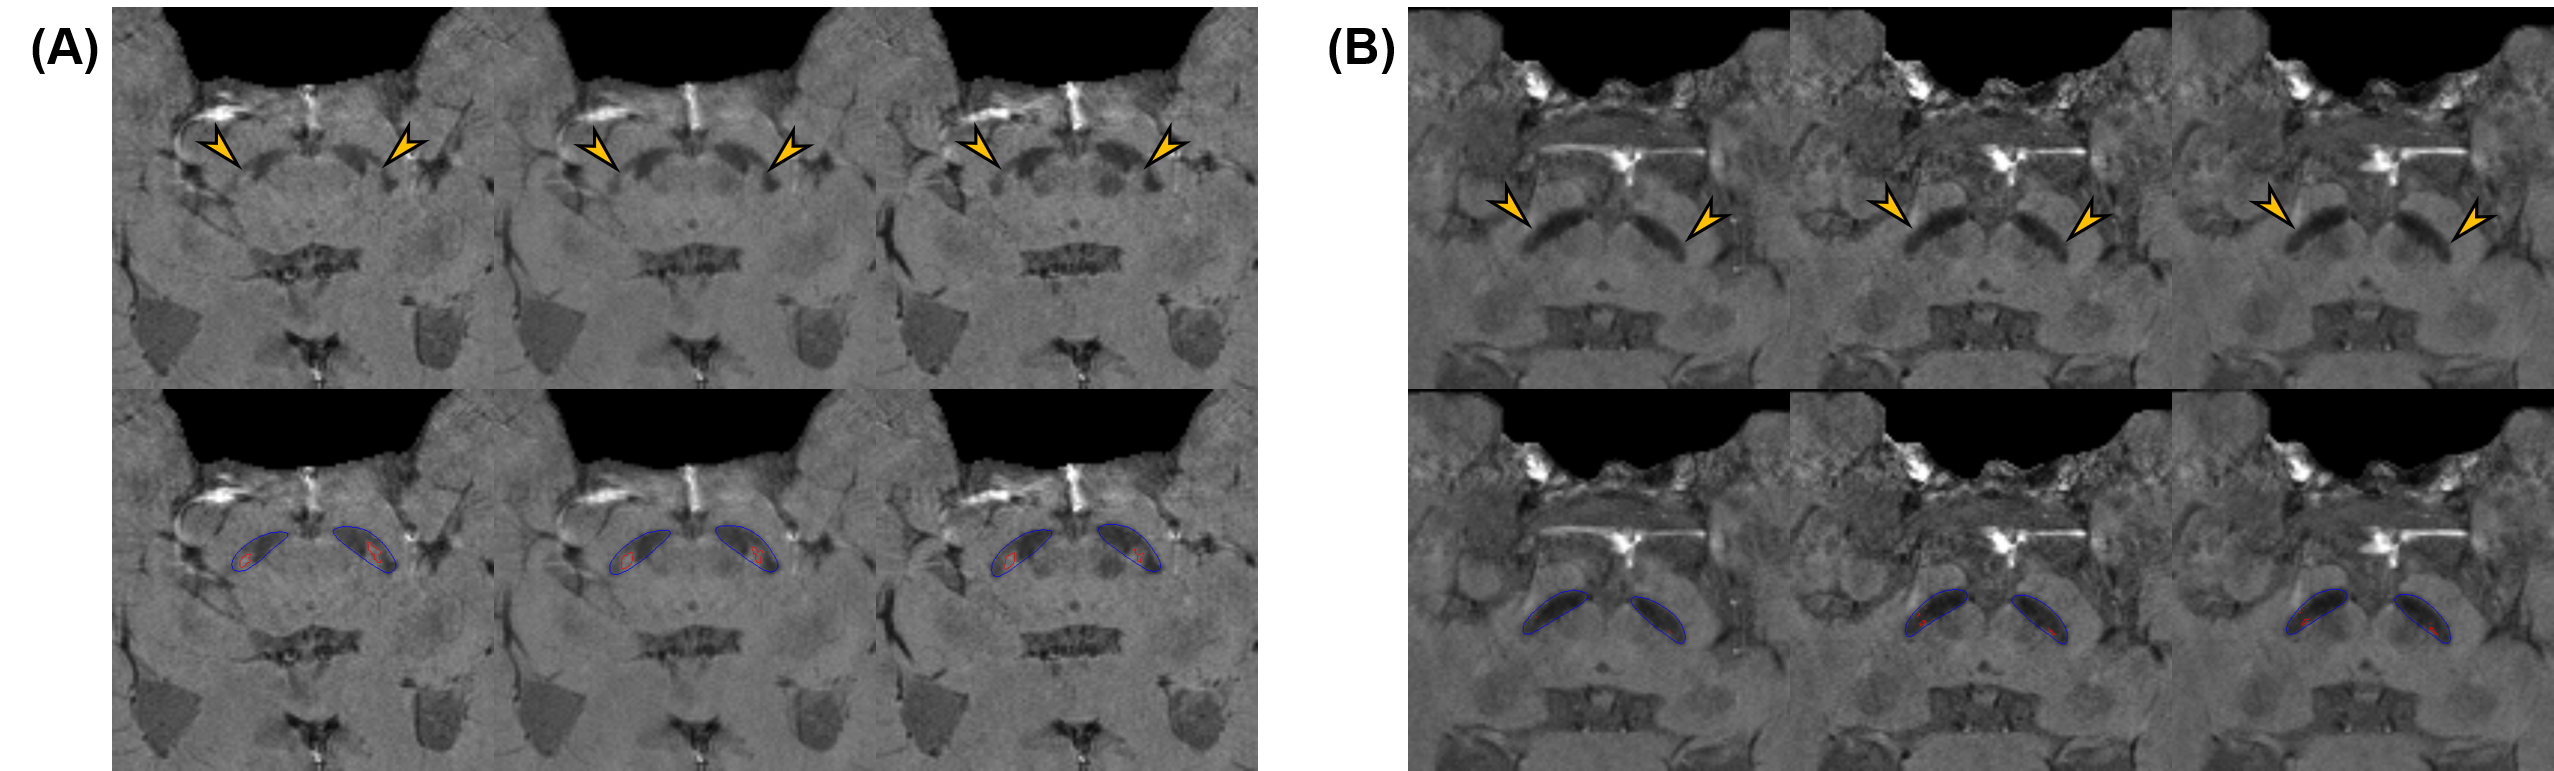
Figure4: SMWI results of N1 for both HC and IPD patient.
(A) Representative N1 images from a HC (a 48-year-old female case). The hyperintensity N1 area within the SN is clearly shown on the three consecutive slices of the N1 images (arrow).(B) Representative N1 images from a patient with IPD (an 84-year-old female case). The hypo-intensity signals are shown on the N1 images (arrow). The bottom images of (A) and (B) show the automatic segmentation results of the SN (blue) and N1 (red).

Table1: Diagnostic performances of N1 classification in all participants.
The values represent mean [range].