5187
MRI-based methods for measuring foot perfusion1Health Sciences Research Centre, UCL University College Odense, Odense, Denmark, 2Regional Health Research,, University of Southern Denmark, Odense, Denmark, 3Radiology, Lillebealt Hospital, Kolding, Denmark, 4Vascular Surgery, Lillebealt Hospital, Kolding, Denmark, 5Radiology, Aarhus University Hospital,, Aarhus, Denmark, 6Institute of Clinical Medicine, Aarhus University, Aarhus, Denmark, 7MR Research Center, Aarhus University, Aarhus, Denmark, 8Regional Health Research, University of Southern Denmark, Odense, Denmark
Synopsis
Motivation: For patients with peripheral artery disease knowing the perfusion in different areas of the foot might have clinical relevance when treating ischemia.
Goal(s): The aim was to measure the reliability of five different MR sequences with quantitative parameters for measuring perfusion when imaging the foot.
Approach: We used a cuff induced ischemia protocol in a test/retest study of 16 healthy volunteers
Results: Flow-sensitive Alternating Inversion Recovery pulsed arterial spin labelling (FAIR) and Blood Oxygenation Level-Dependent (BOLD) sequences had high reliability and were able to distinguish between occluded blood flow and hyperactive response flow
Impact: Reliability test of five different MR sequences for quantitative perfusion measurements in the foot.
Background
Peripheral artery disease affects millions of people world wide[1]. Ischemia might course wounds or gangrene. Usually patients experience severe pathology in only one part of the foot, making it relevant to measure perfusion in different regions or angiosomes of the foot [2]. Angiography shows macro-perfusion but not necessarily micro-perfusion, which could be important for patients suffering from peripheral artery disease. This study aims to test the reliability of five different non-contrast MRI sequences to measure foot perfusion in angiosomes.Methods
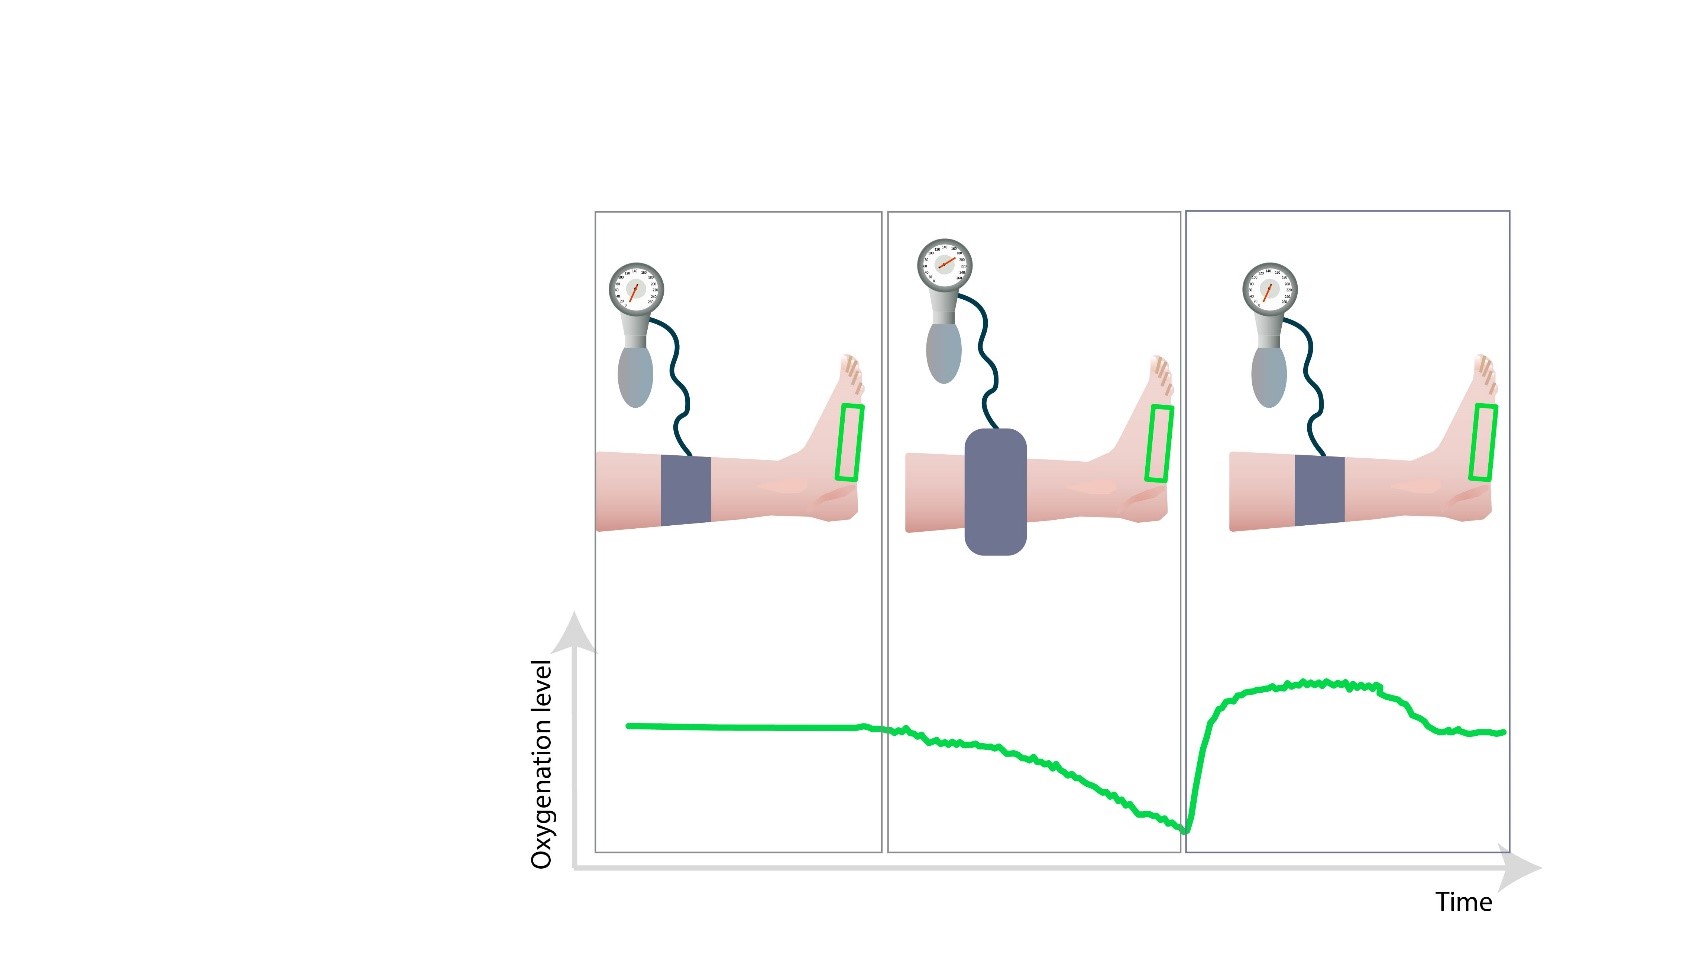
Sixteen healthy volunteers were included in a test/retest study. Mean age was 27.9 ±9.7 years. The volunteers were MRI scanned continuously, first in a resting state followed by a cuff-induced ischemia test for two minutes then measuring the hyper-reactive response for three minutes after the cuff was deflated[3], se figure 1The following MRI sequences were included: 2D and 3D pseudo-Continuous Arterial Spin Labelling (pCASL), Flow-sensitive Alternating Inversion Recovery pulsed arterial spin labelling (FAIR ), multi-echo gradient echo (mGRE) sequence to quantitatively assess T2*, and a dynamic Blood Oxygenation Level-Dependent (BOLD) sequence.
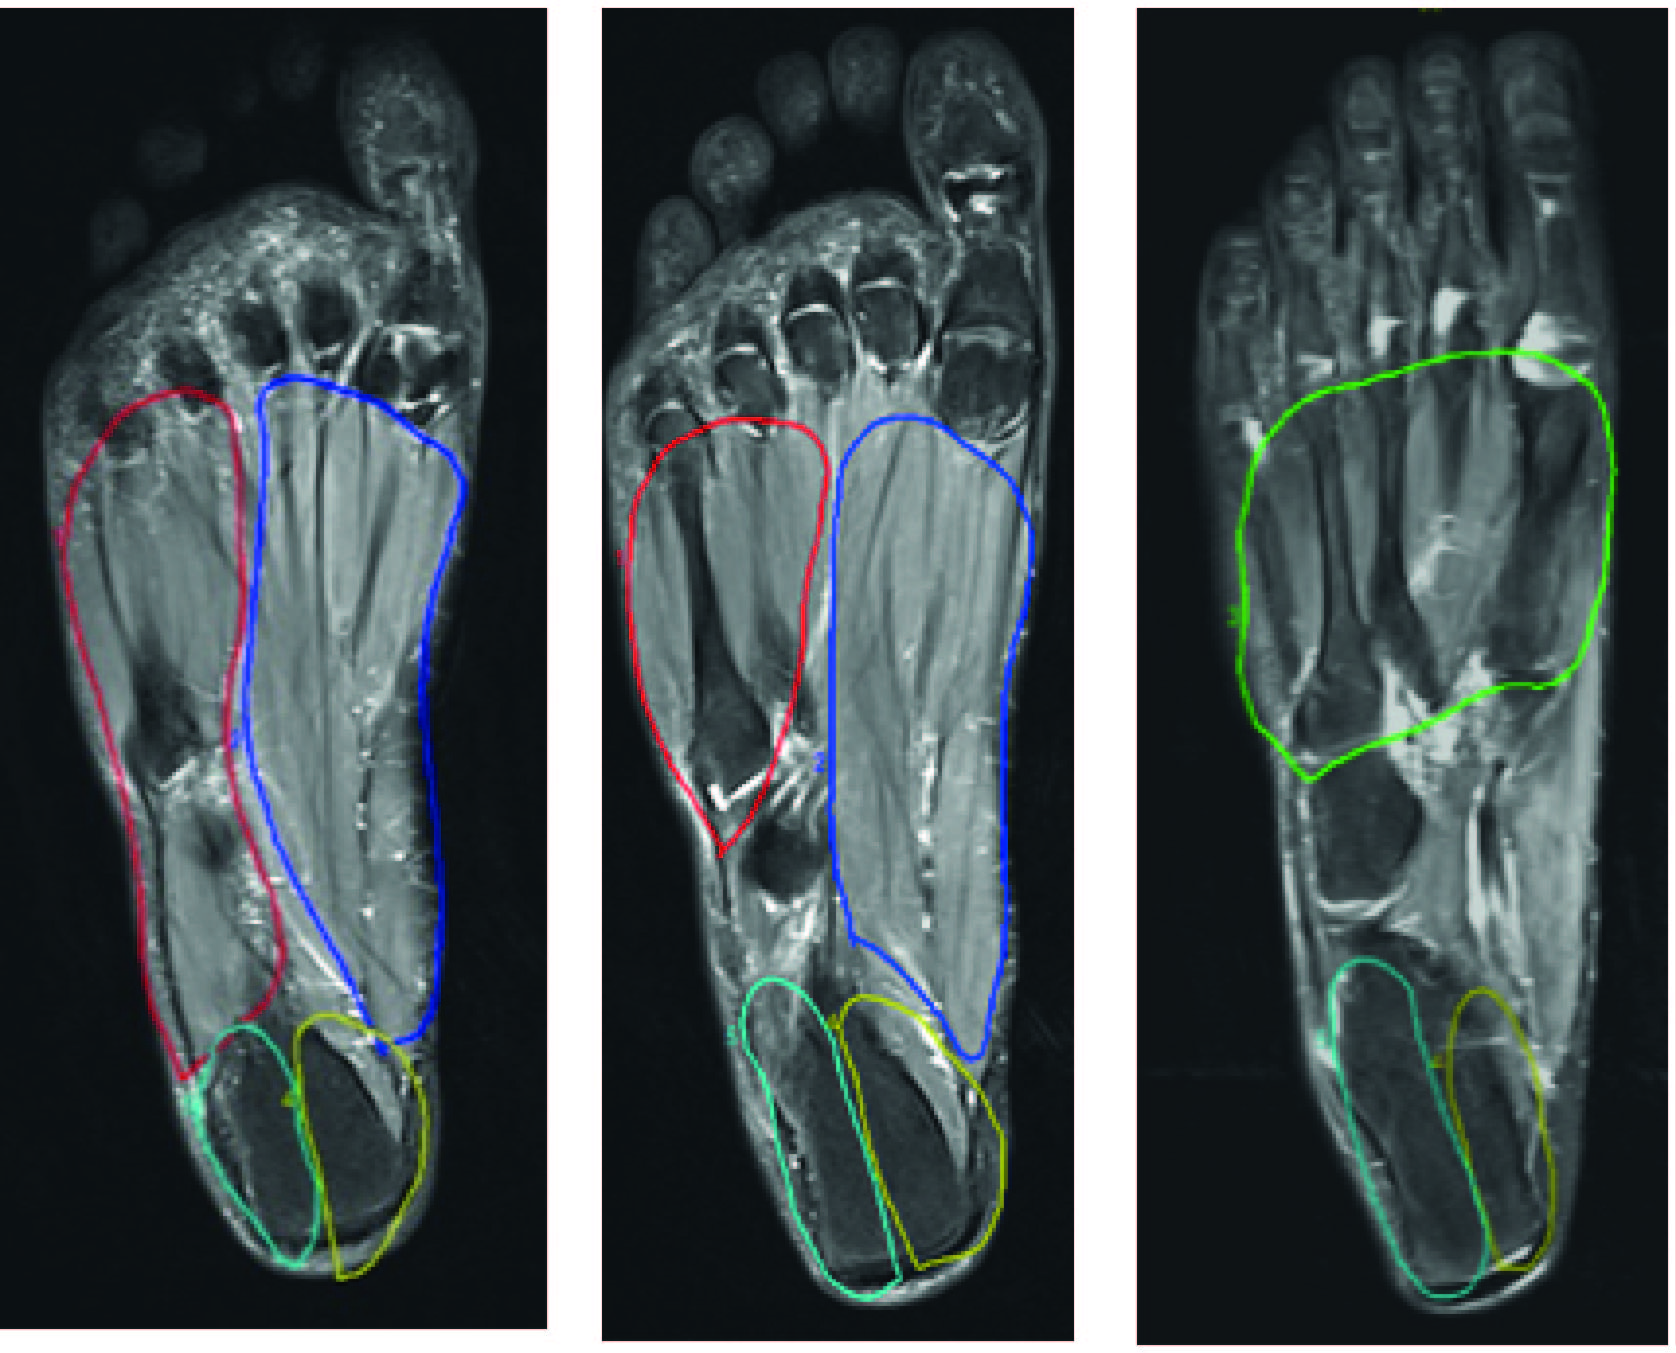
The foot were divided into volumes of interests VOI’s corresponding to angiosomes (Dorsalis Pedis Artery (DPA), Medial Calcaneal Artery (MCA), Medial Plantar Artery (MPA), Lateral Calcaneal Artery (LCA), and Lateral Plantar Artery (LPA) ) and all data were extracted from VOI’s as shown in figure 2.
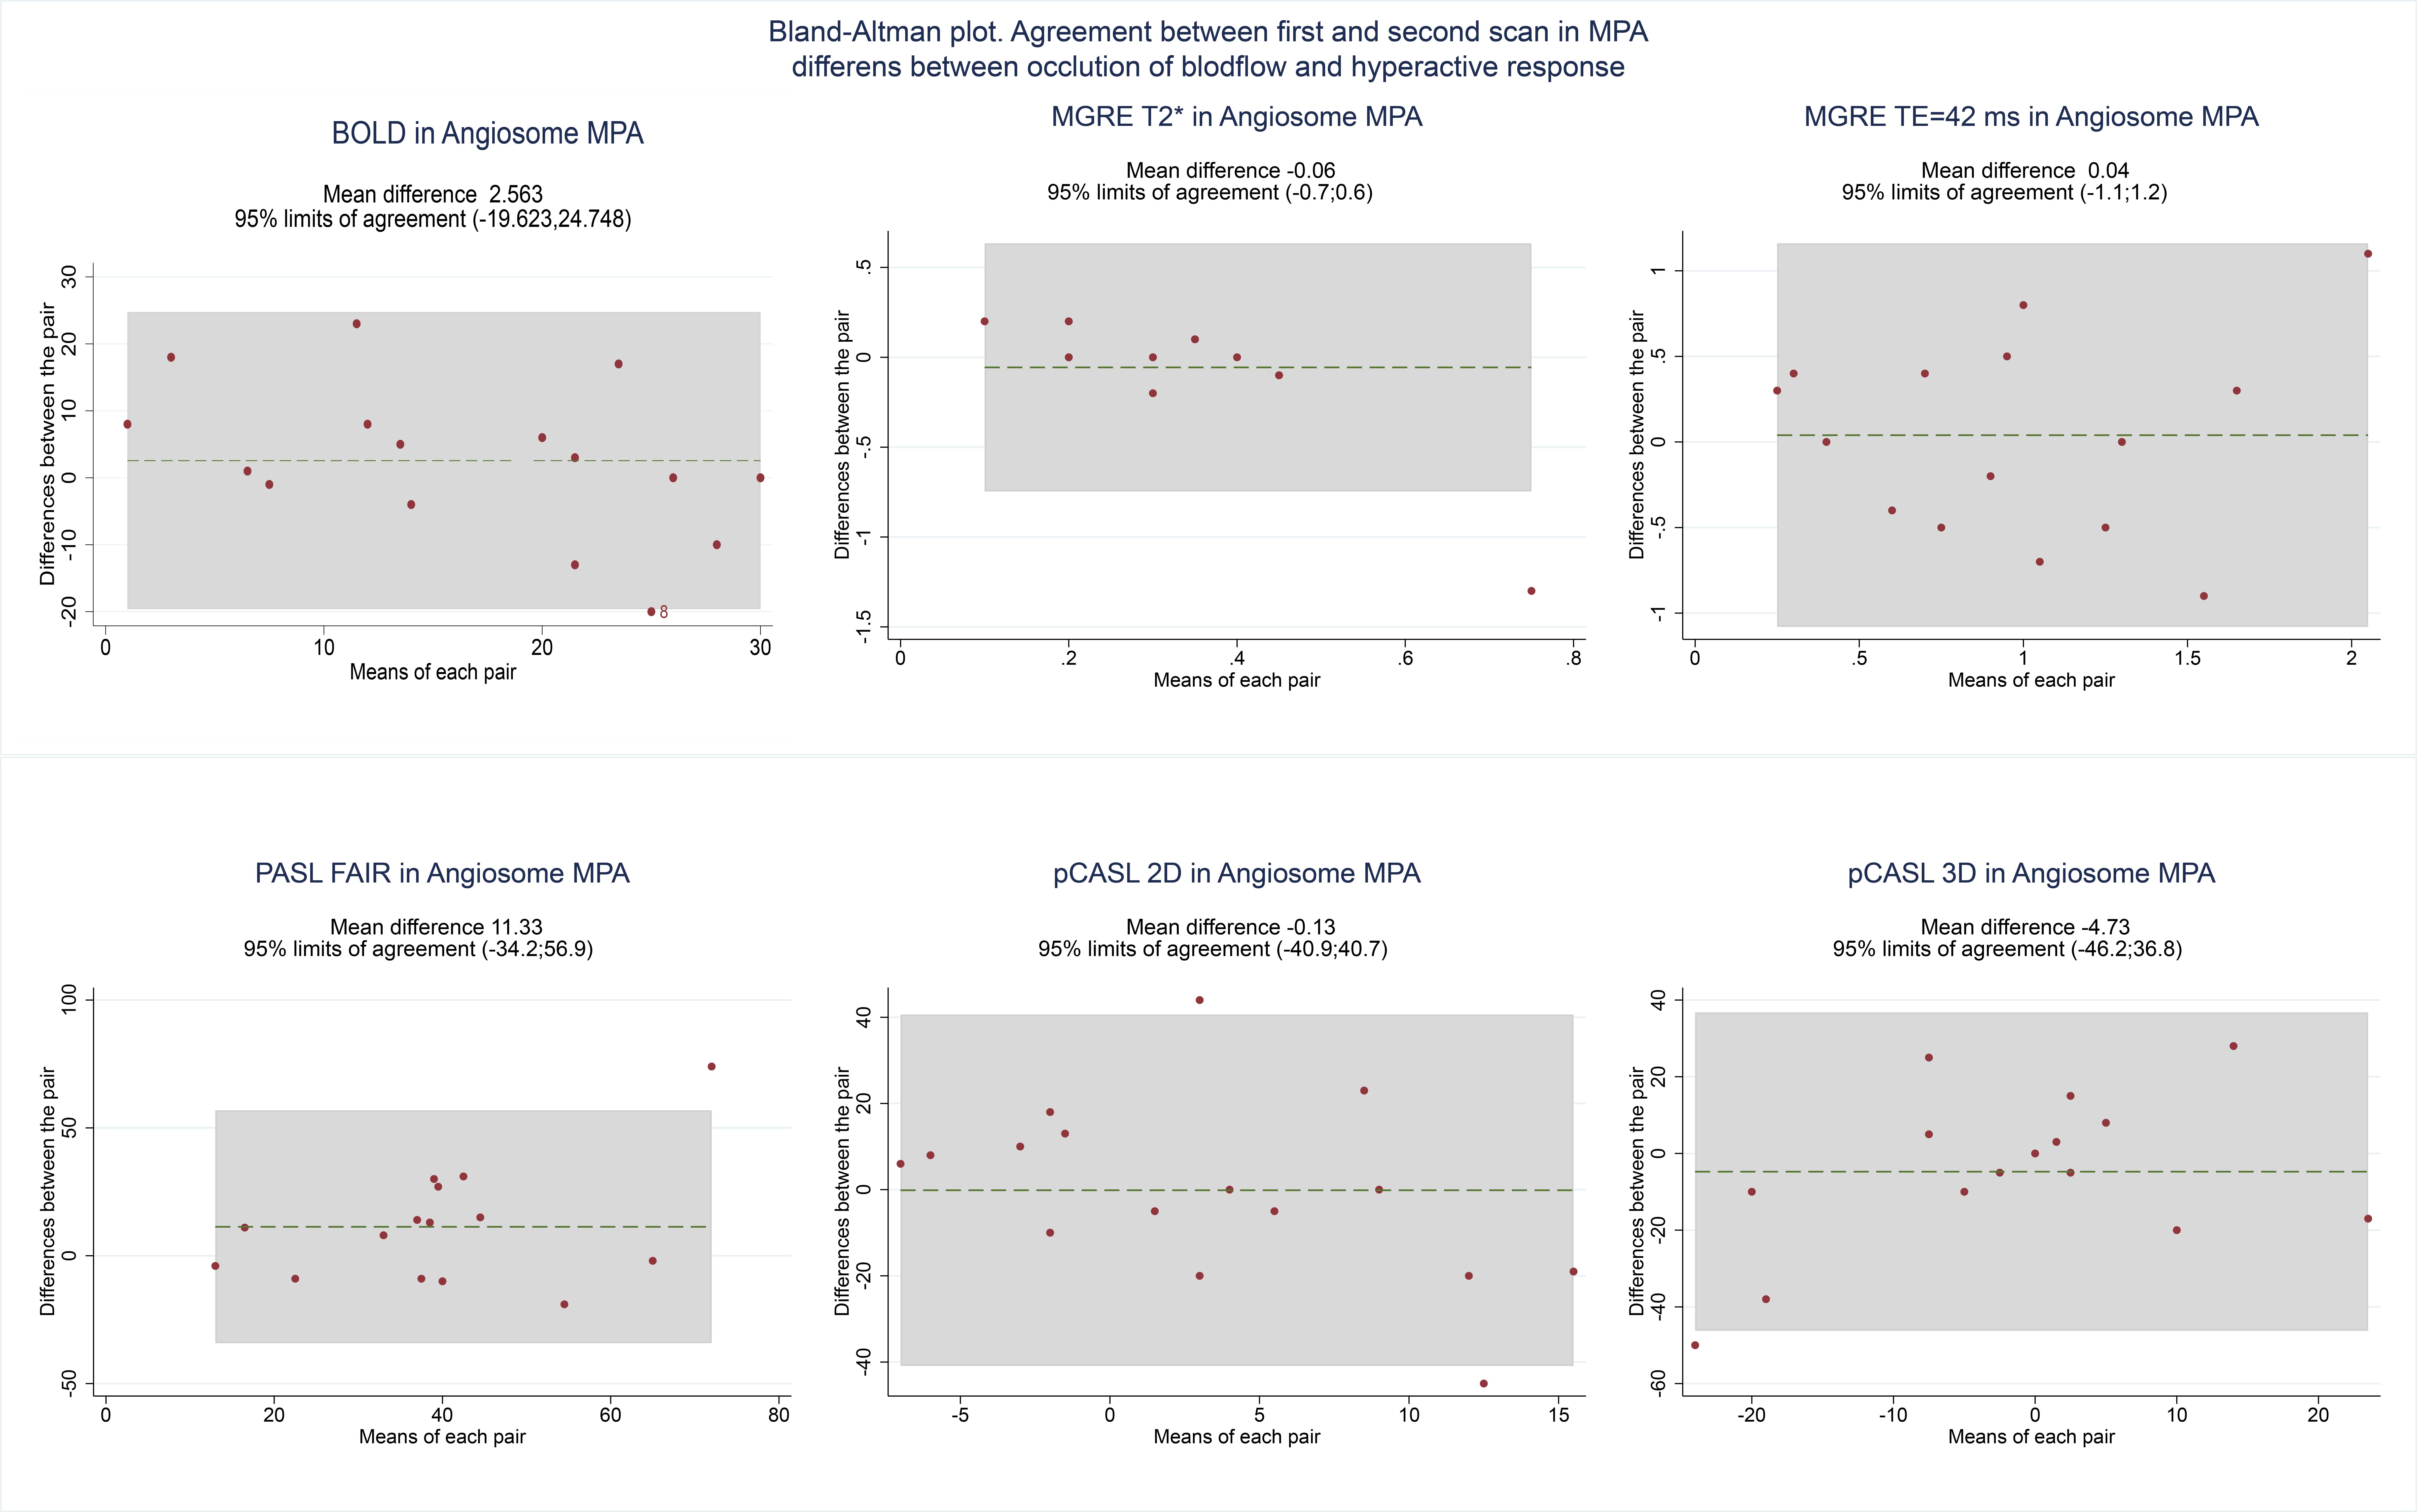
Bland-Altman plots were used to test the agreement of two consecutive scans [4]. The difference between first and second scan was plotted versus the mean. Besides, a Student paired t-test was used to determine if the sequences could distinguish occluded blood flow and hyperactive response.
Results
BOLD and FAIR had high agreement between first and second scans, while both pCASL sequences had very low agreement, se table 1.| Calculated as coefficient of variance vs mean difference. Total (n=16) | |
| BOLD | 0.18 |
| FAIR | 0.11 |
| 2D pCASL | 0.90 |
| 3D pCASL | 1.48 |
| mGRE T2* | 0.25 |
| mGRE TE=42ms | 0.38 |
Bland-Altman plots from one angiosome is shown in figure 3.
The ability to distinguish occluded blood flow from hyperactive response was high for the BOLD and FAIR sequences with p-values below 0.01. mGRE were able to distinguish occluded blood flow from hyperactive response in most angiosomes in the foot. 2D and 3D pCASL sequences had p-values above 0.05, se table 2.
P-values based on students T-test and (Confidence interval)
| Angiosome | DPA | MCA | MPA | LCA | LPA |
| BOLD | <0.01 (5.39;11.86) | <0.01 (2.42;6.58) | <0.01 (13.43;22.19) | <0.01 (2.28;4.97) | <0.01 (3.96;12.04) |
| FAIR | - | <0.01 (60.9;91.76) | <0.01 (32.48;58.19) | <0.01 (58.62;128.84) | <0.01 (44.14;71) |
| 2D pCASL | 0,15 (-2.46;14.96) | 0,15 (-2.36;14.11) | 0,18 (-1.71;8.21) | 0,86 (-12.12;10.25) | 0,15 (-1.19;7.07) |
| 3D pCASL | 0,59 (-5.07;8.54) | 0,67 (-21.55;14.35) | 0,44 (-15.2;6.93) | 0,14 (-4.36;28.36) | 0,26 (-4.59;15.79) |
| MGRE (T2*) | <0.01 (0.17;0.33) | <0.01 (0.14;0.25) | <0.01 (0.25;0.36) | 0,19 (-0.03;0.15) | 0,21 (-0.08;0.34) |
| MGRE (TE=42 ms) | <0.01 (0.53;1.02) | <0.01 (0.26;0.51) | <0.01 (0.62;1.28) | 0,07 (-0.01;0.26) | 0,01 (0.13;0.79) |
Conclusion
The highest reliability in form of agreement was found using BOLD and FAIR. The BOLD, FAIR and mGRE were able to distinguish between occluded and hyperactive response blood flow. In future work we will test BOLD, mGRE and FAIR in patients.Acknowledgements
No acknowledgement found.References
1. Norgren, L., et al., Inter-Society Consensus for the Management of Peripheral Arterial Disease (TASC II). J Vasc Surg, 2007. 45 Suppl S: p. S5-67.
2. Alexandrescu, V., Angiosomes Applications in Critical Limb Ischemia in search for relevance. 2013, Turin, Italy: Edizioni Minerva Medica.
3. Lopez, D., et al., Arterial spin labeling perfusion cardiovascular magnetic resonance of the calf in peripheral arterial disease: cuff occlusion hyperemia vs exercise. J Cardiovasc Magn Reson, 2015. 17(1): p. 23.
4. de Vet, H.C., et al., When to use agreement versus reliability measures. J Clin Epidemiol, 2006. 59(10): p. 1033-9.
Figures