5192
Quantitative assessment of the anterior talofibular ligament after arthroscopic repair using T2* values1Division of Radiology and Nuclear Medicine, Sapporo Medical University Hospital, Sapporo, Japan, 2Department of Orthopaedic Surgery, Sapporo Medical University, Sapporo, Japan, 3Second Division of Physical Therapy, Sapporo Medical University, Sapporo, Japan
Synopsis
Keywords:
Motivation: Although anterior talofibular ligament (ATFL) repair is commonly performed as part of chronic lateral ankle instability (CLAI) surgical treatment, there are no reports that quantitatively evaluate the repaired ATFL.
Goal(s): Our goal was to investigate longitudinal changes in T2* values within ATFL after primary ATFL repair.
Approach: We compared preoperative and 6 months postoperative T2* values of the ATFL using high-resolution T2* map images.
Results: There was a 118% change in the T2* value at 6 months after ATFL repair, including a 130% change on the fibular side.
Impact: These findings provide basic data to help understand the healing process after ATFL repair surgery and provide quantitative values may help predict recurrence and clinical outcomes.
Background and Purpose
Anterior talofibular ligament (ATFL) injury is caused by ankle sprain. Despite adequate conservative treatment, around 20% of patients develop chronic lateral ankle instability (CLAI)1. ATFL repair is the first-line CLAI surgical treatment when residual ligament remains, and good clinical outcomes have been reported2. However, there are no reports that quantitatively evaluate the repaired ATFL. The purpose of this study was to investigate longitudinal changes in T2* values within the ATFL after primary ATFL repair.Methods
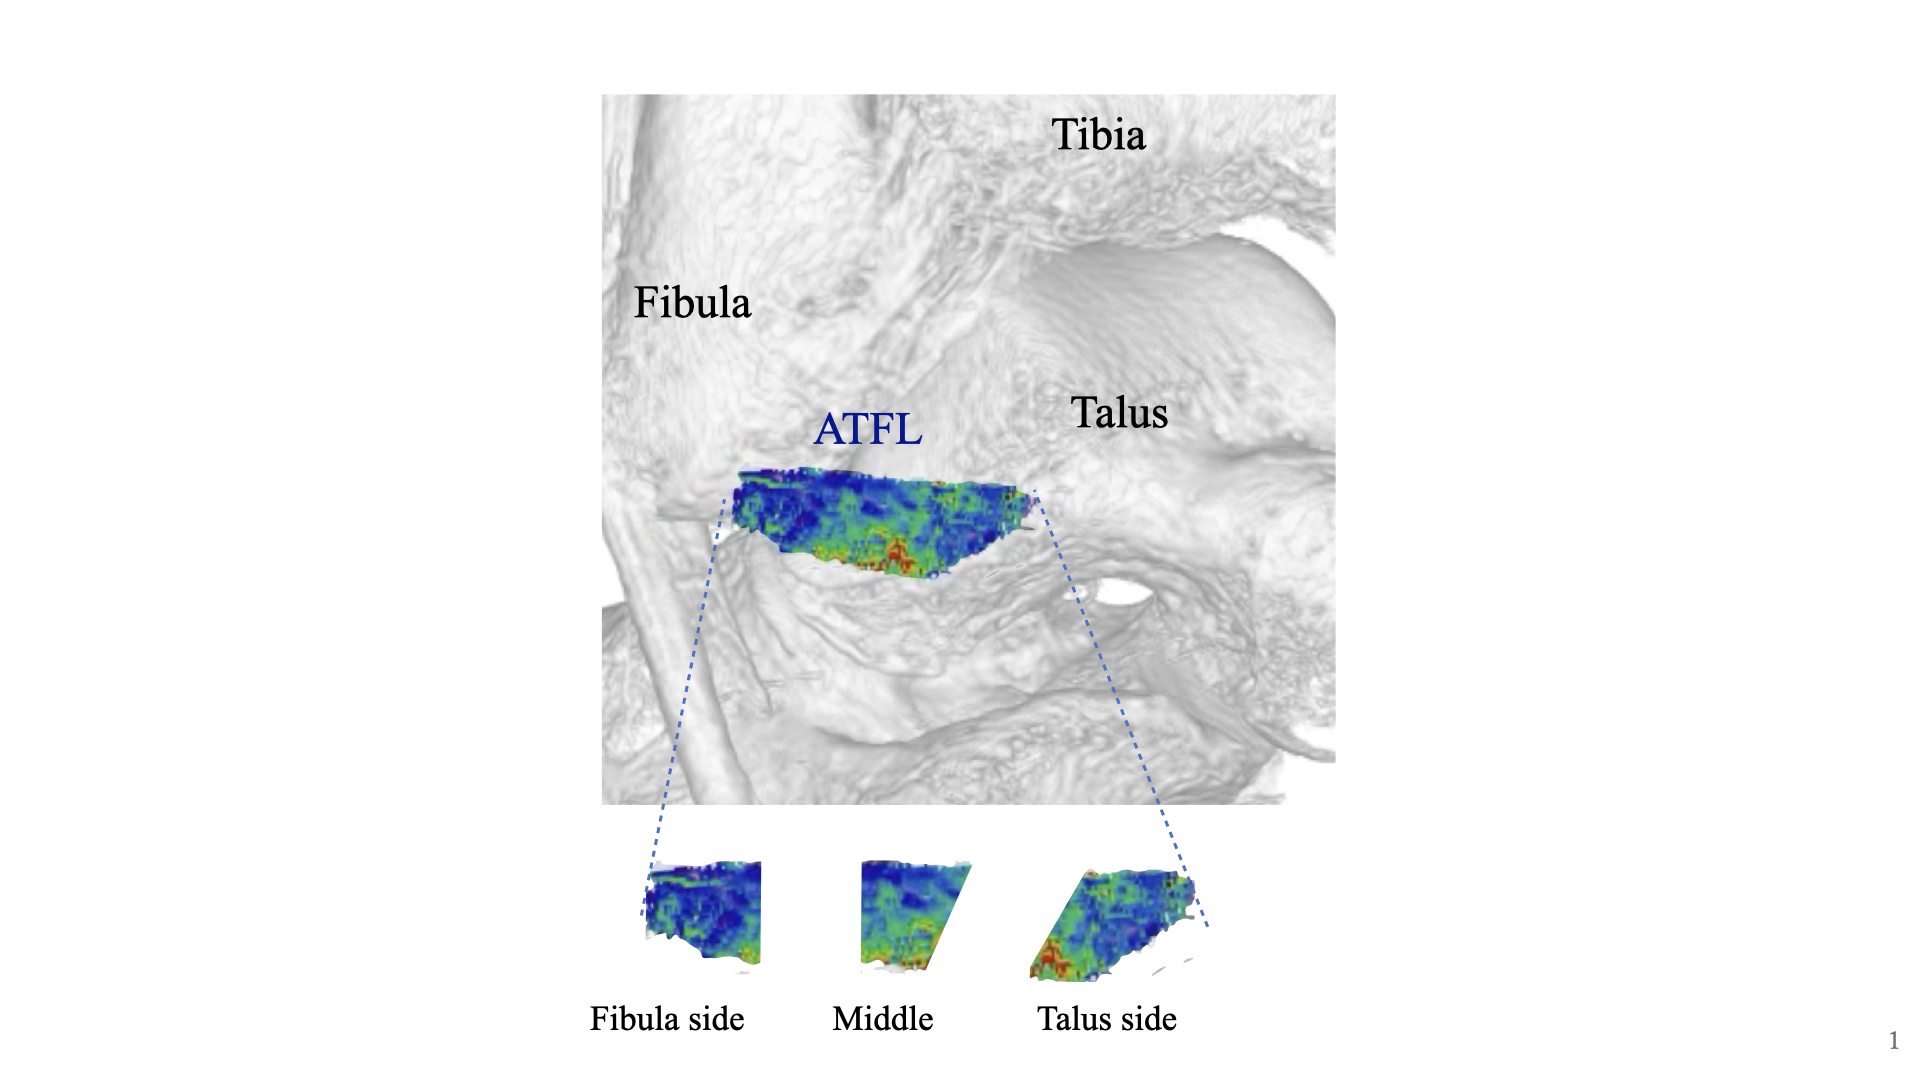
This study included nine patients (four males, five females; mean age 32.9 ± 15.8 years) who underwent arthroscopic ATFL repair for CLAI. All patients underwent 3T MRI consisting of structural three-dimensional T2 weighted images along with T2* map images in a neutral ankle position. The high-resolution T2* map image (multi-echo–Fast Field echo sequence) parameters were as follows: repetition time (TR) = 32 ms; echo time (TE) = 2.3, 4.6, 6.9, 9.2, 11.5, 13.8, and 16.1 ms; flip angle = 13, and voxel size = 0.6 × 0.6 × 0.6 mm. The entire ATFL of each ankle was manually segmented from the T2* map images on the workstation and then divided into three sections: the talar (T), middle (M), and fibular (F) sides (Figure 1). The respective T2* values were then calculated for each section. Clinical outcomes were assessed for stability by a manual test using the anterior translation (AT) value3. The rate of change in the T2* value before and after surgery was then compared.Results
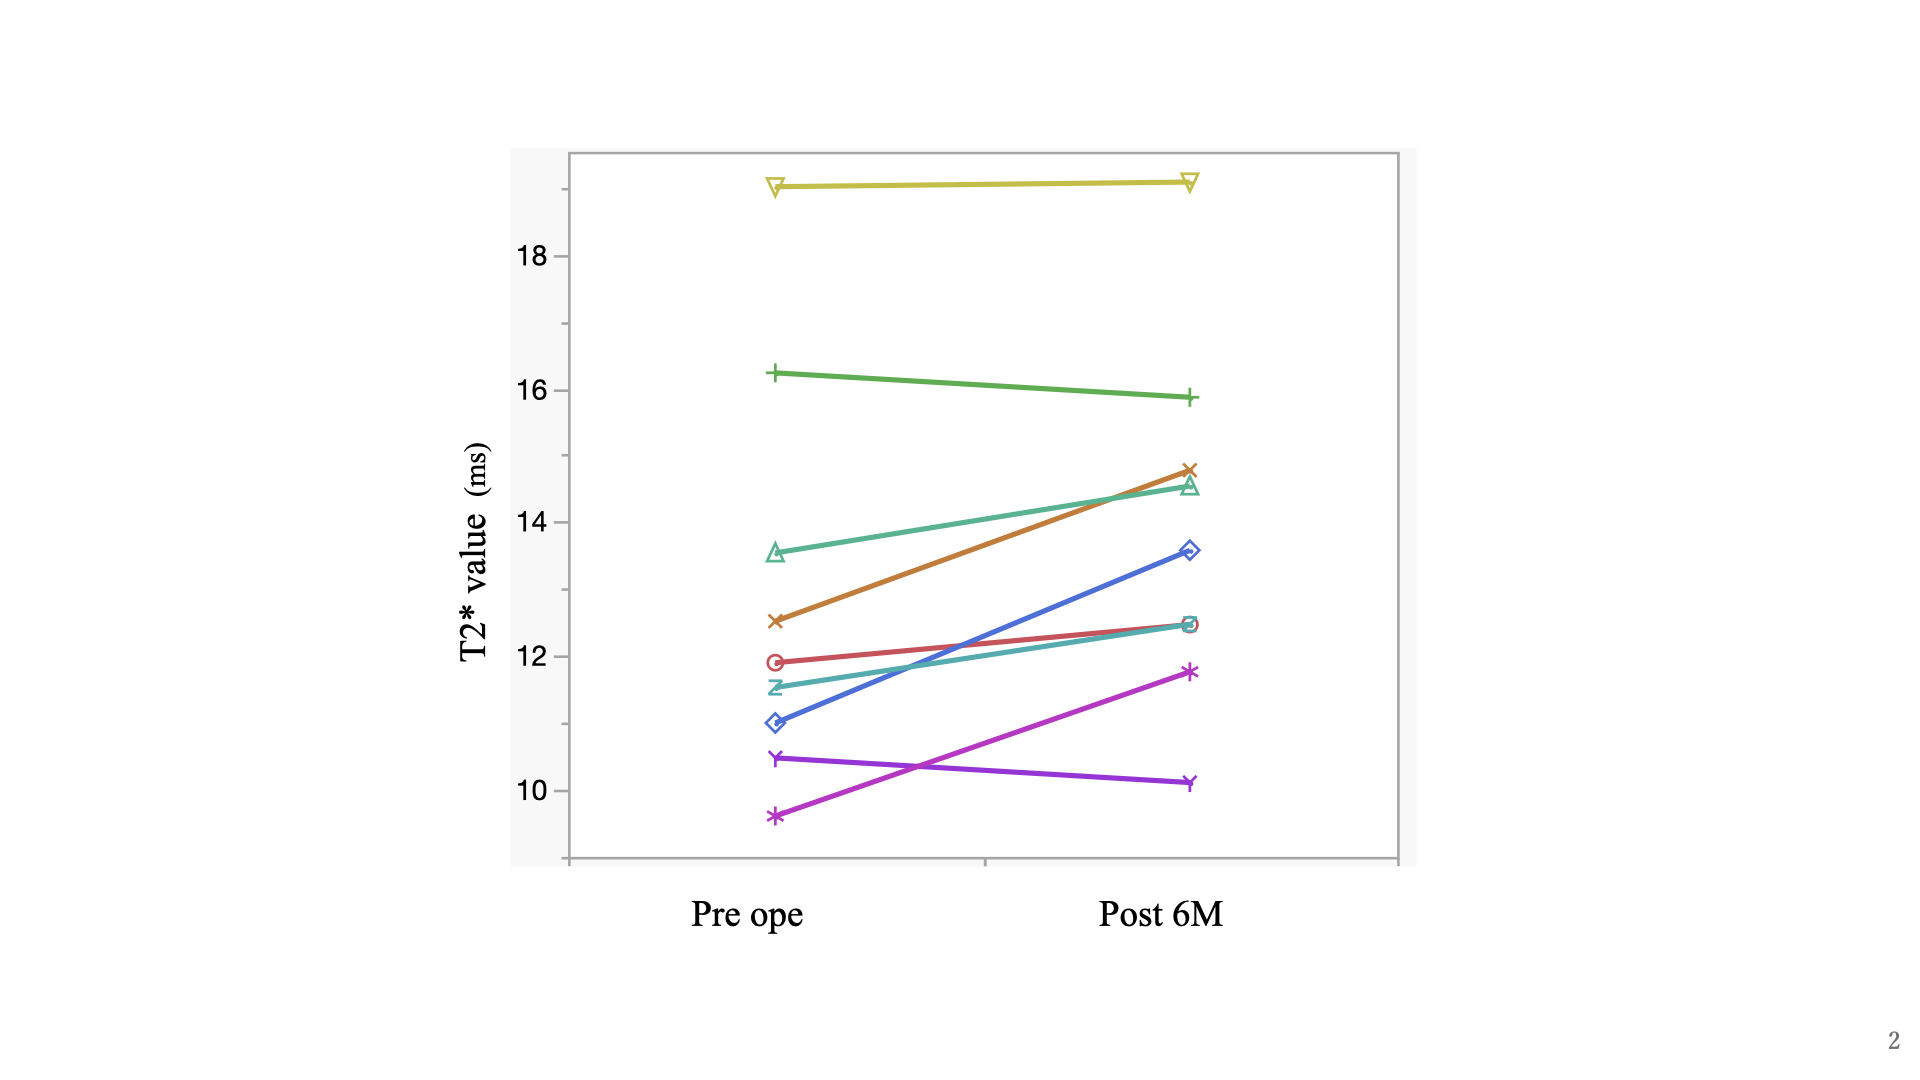
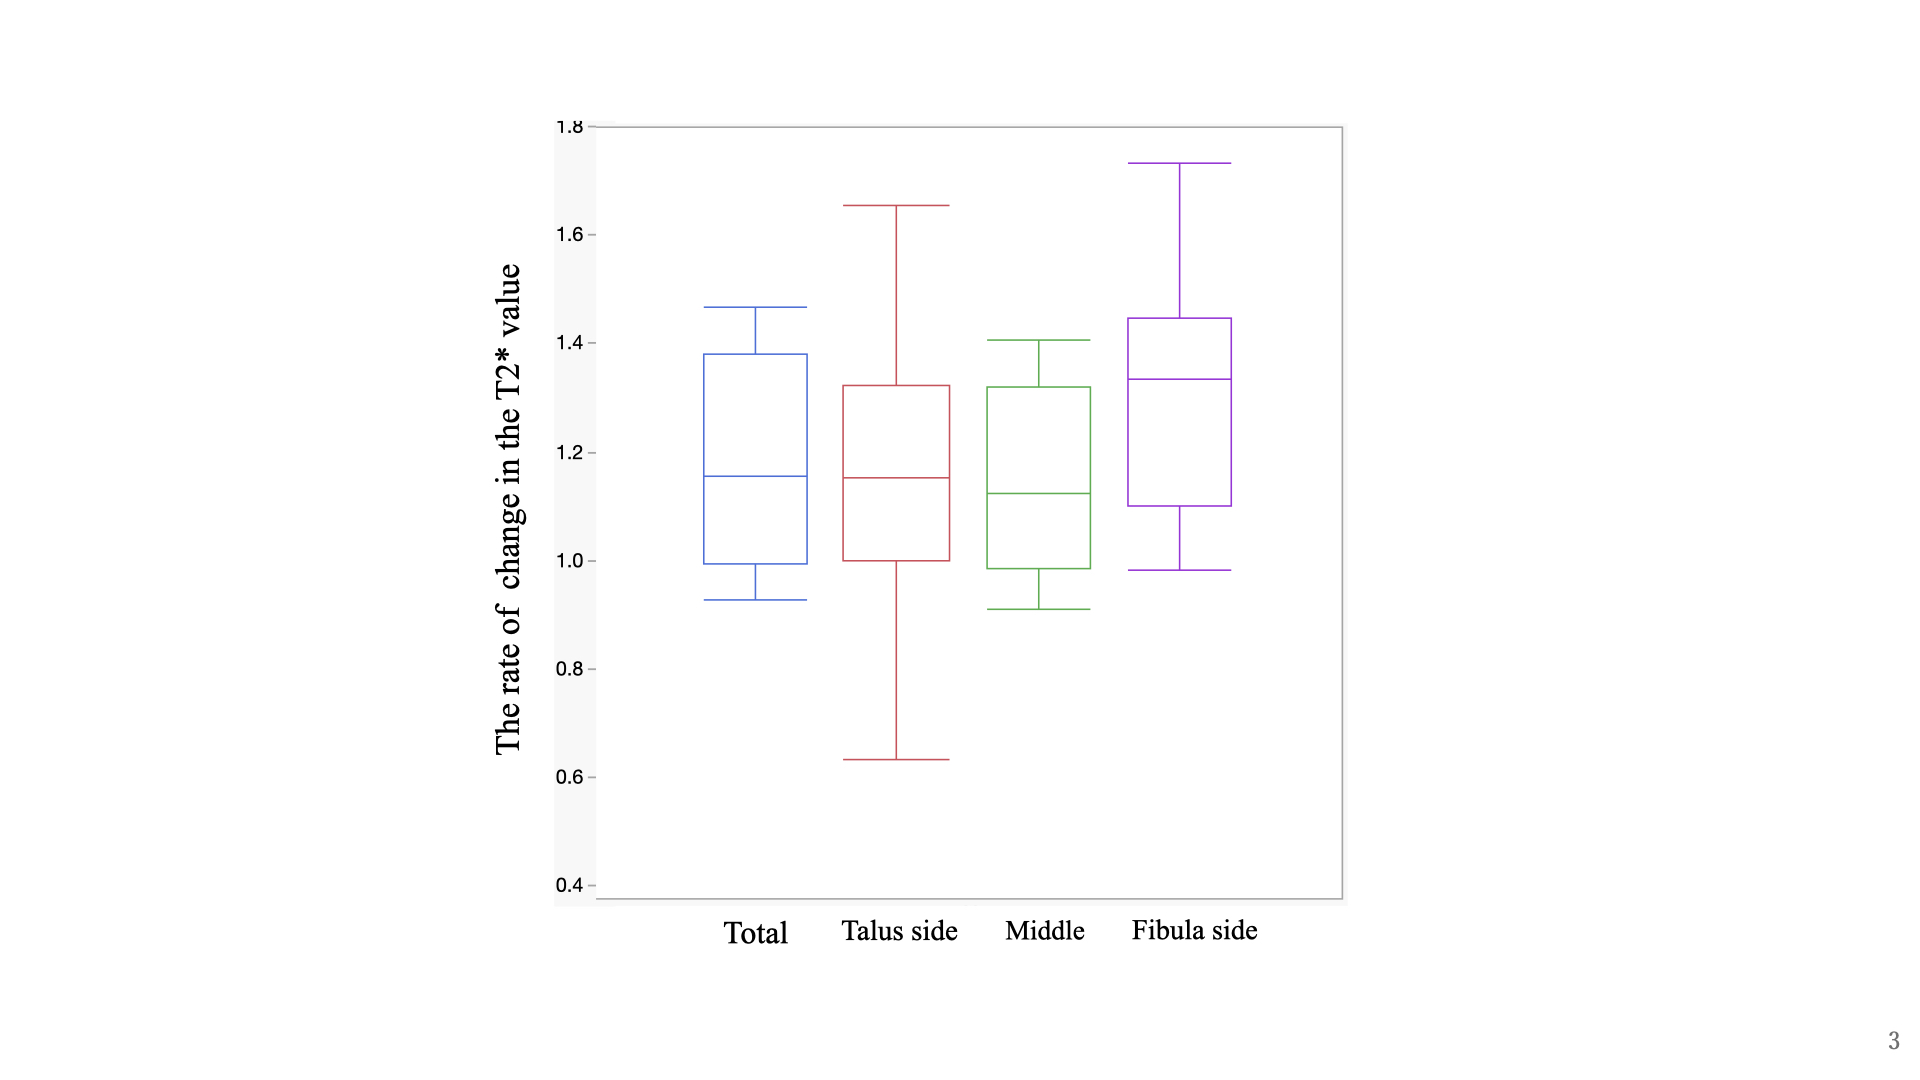
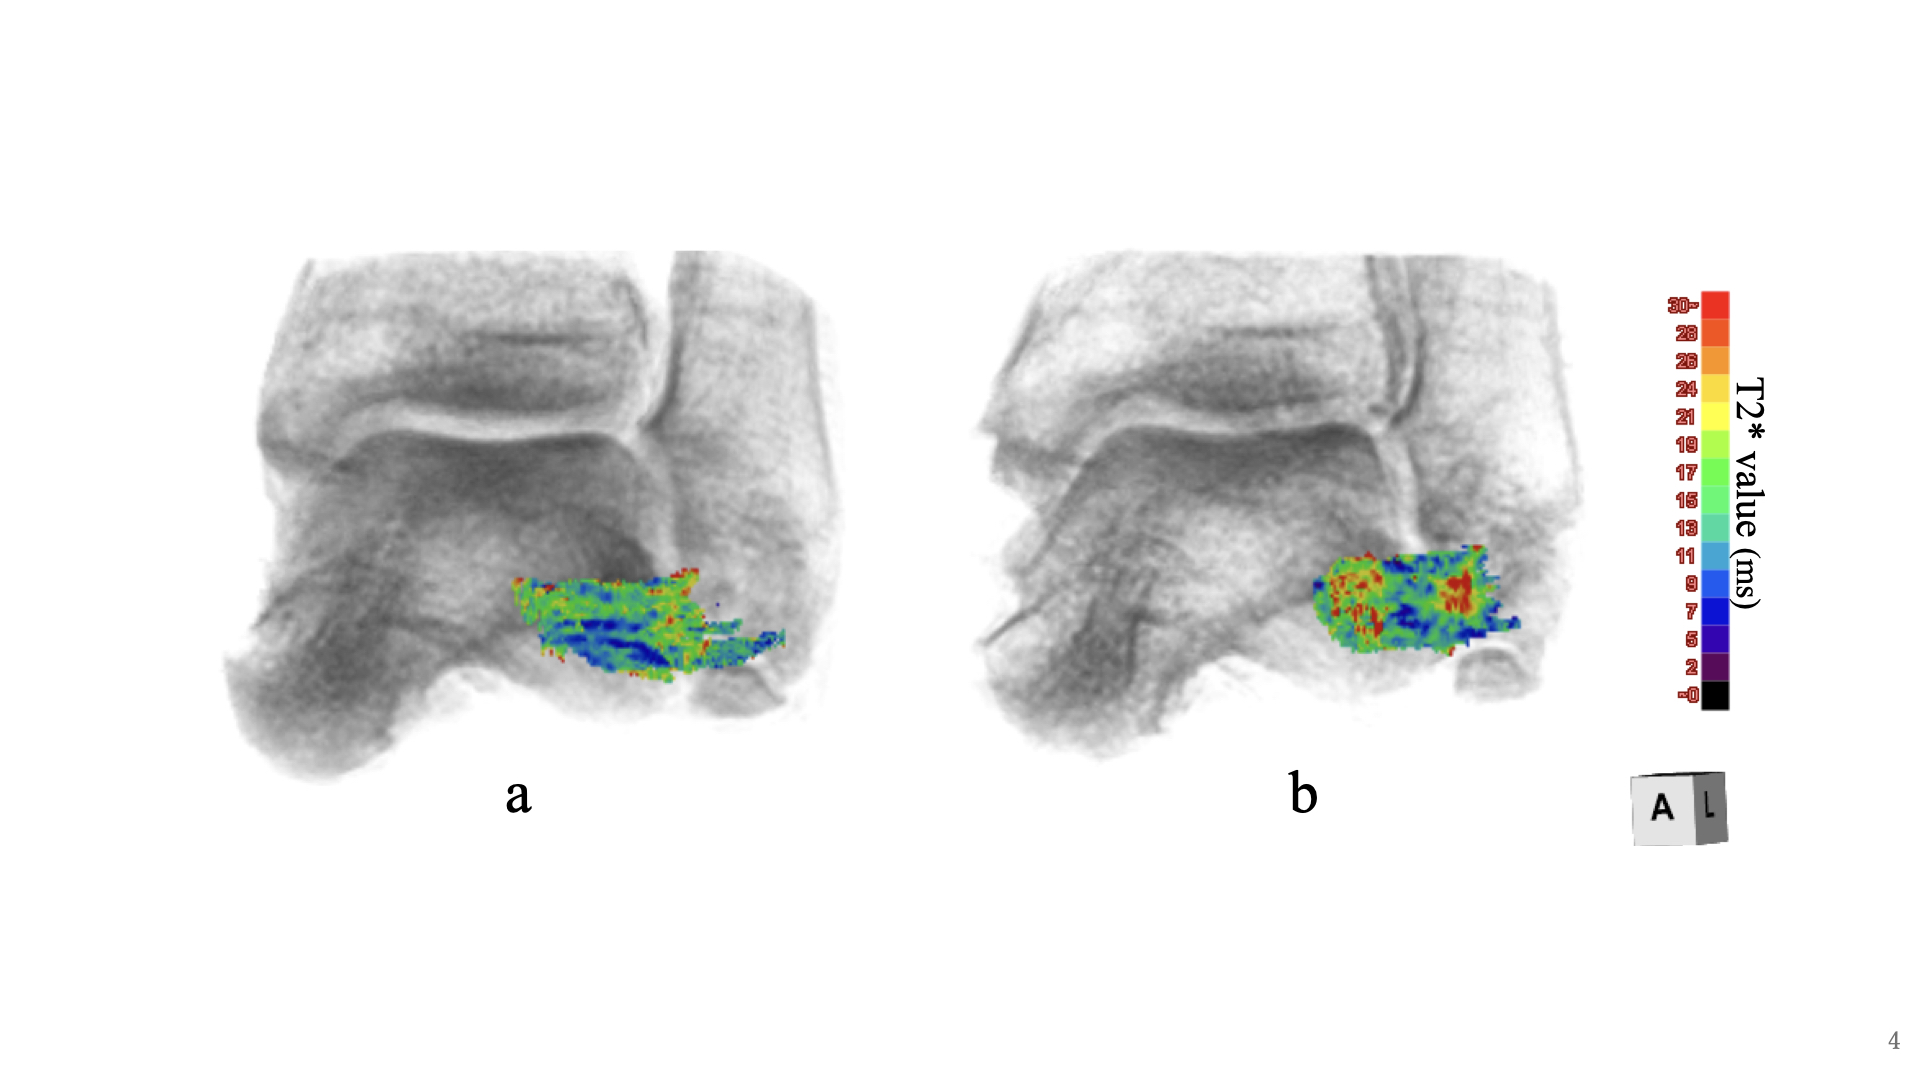
The AT value significantly improved from 8.3 ± 3.0 mm to 4.3 ± 1.0 mm (p < 0.01). The T2* values for all patients are shown in Figure 2. The T2* value of the ATFL before and after surgery was 12.9 ± 3.0 ms and 14.8 ± 2.7 ms, respectively. The mean rate of change and 95% confidence interval of the T2* value overall and for each section was as follows: Total: 118% (101%–133%), T: 116% (92%–140%), M: 111% (99%–124%), and F: 130% (111%–148%) (Figure 3). The Figure 4 present the preoperative and postoperative T2* color map images of the ATFL in a 64-year-old woman with CLAI.Conclusion
The increase in the T2* values of ATFL 6 months after ATFL repair may reflect the degree of edema. Further, long-term data on the rate of change may support understanding of the healing process after repair.Acknowledgements
NoneReferences
1. Valderrabano V, Hintermann B, Horisberger M, et al. Ligamentous posttraumatic ankle osteoarthritis. Am J Sports Med. 2006;34(4): 612-620.
2. Hagio T, Yoshimura I, Kanazawa K, et al. Morphology of anterior talofibular ligament after arthroscopic lateral ankle ligament repair. Foot Ankle Int. 2020;41(8):993-1001.
3. Teramoto A, Iba K, Murahashi Y, et al. Quantitative evaluation of ankle instability using a capacitance-type strain sensor. Foot Ankle Int. 2021;42(8):1074-1080.
Figures