5183
Fat-corrected non-Gaussian diffusion MRI in a non-alcoholic fatty liver disease: diagnostic performance for liver fibrosis1INSERM, Paris, France, 2Beaujon University Hospital, Paris, France
Synopsis
Motivation: In nonalcoholic fatty liver disease (NAFLD), hepatic fibrosis is strongly associated with patient survival. Diffusion MRI has been proposed to assess liver fibrosis, but this evaluation is hampered in hepatic steatosis.
Goal(s): Our goal was to evaluate the diagnostic performance of non-Gaussian diffusion MRI in assessing liver fibrosis in 250 patients with NAFLD.
Approach: We developed a method to calculate the non-Gaussian diffusion coefficient, based on non-linear regression and fat correction.
Results: With this corrected diffusion method, NAFLD patients with liver fibrosis could be differentiated from patients without it.
Impact: With this corrected diffusion method, NAFLD patients with liver fibrosis could be differentiated from patients without it.
Introduction
In nonalcoholic fatty liver disease (NAFLD), fibrosis represents an important predictor of long-term survival (1). Diffusion MRI has been proposed to monitor fibrosis because of the effect of accumulated extracellular matrix components on water diffusion (2). Usually, diffusion MRI is performed with fat suppression, but imperfections in these schemes may result in residual fat signal of sufficiently high magnitude to influence the diffusion coefficient the measurements(3). Recently, non-Gaussian diffusion MRI has been proposed as potential marker of hepatic fibrosis (4)(5). However, the reported diagnostic performance could not be replicated in NAFLD patients despite the application of a fat correction method (6). Here, we propose a different method to calculate the non-Gaussian diffusion coefficient based on a non-linear least-square fit that includes fat correction. Our aim was to evaluate the diagnostic performance of non-Gaussian diffusion for liver fibrosis in a NAFLD population.Methods
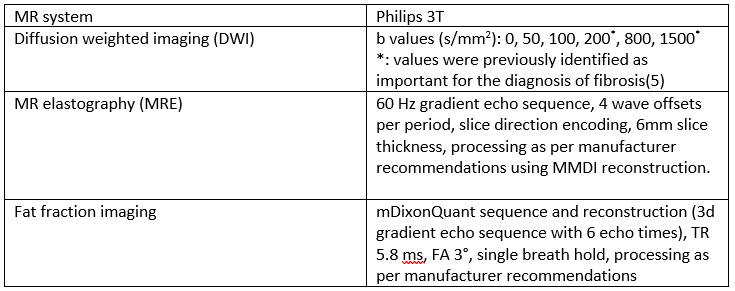
Two-hundred-fifty patients with type 2 diabetes, hepatic steatosis and elevated aminotransferases were included in this prospective study. The MRI acquisition parameters are detailed in Table 1. Fibrosis stage (F0 to F4) and steatosis grade (S0 to S3) were assessed on a liver biopsy performed the same day as the MRI examination.We calculated the non-Gaussian diffusion coefficient DnG with non-linear regression on all b values (Immin C++ library) of the following signal expression:
$$$S(b)=S0\exp{(-bD_{nG}+\frac{1}{6}b^2D_{nG}^2k})$$$
We also calculated the DnG with the shifted ADC method (sADC) according to Le Bihan (5):
$$$D_{nGLeBihan} = sADC = \frac{ln(\frac{Sb1}{Sb2})}{b2-b1}$$$
For the two methods, a fat correction was applied.
For the Le Bihan method, we applied the correction he proposed (7):
$$$D_{nGLeBihan}^{corr}=\frac{b_2ADC_w^{0-b2}-b1ADC_w^{0-b1}}{b2-b1}$$$
Where
$$$ADC_w^{0-b}=\frac{ln\frac{(1-\eta)\exp{(-TE/T2_w})}{\frac{Sb}{S0}((1-\eta)\exp{(-TE/T2_w)}+\gamma\eta\exp{(-TE/T2_f)})-\gamma\eta\exp{(-TE/T2_f)}}}{b}$$$
With Sbi the signal at b-value bi, D the diffusion coefficient, η the proton density fat fraction, TE the sequence echo time (75 ms), T2w and T2f the T2 of water (23 ms) and fat (62 ms), respectively (4), and γ the residual fat percentage because of incomplete fat suppression (8.7% according to (3)).
For our the non-linear least square method, fat correction was performed by fitting the data against a model we developed based on (3) that explicitly accounts for a fat compartment which diffusion is negligible:
$$$S(b)=A[(1-\eta)\exp{(-TE/T2_w)}\exp{(-bD_{nG}^{corr}+b^2D_{nG}^{corr2}k_w)}+\gamma\eta\exp{(-TE/T2_f)}]$$$
Where the free parameters DnGcorr and kw correspond to the kurtosis parameters of the water compartment and A is a free scaling parameter.
Differences of diffusion parameters between fibrosis stages were assessed with the Kruskal-Wallis test and post-hoc Conover test. Multivariate regression was performed with fibrosis stages and steatosis grades as independent variables and diagnostic performance was assessed with ROC curve analysis.
Results
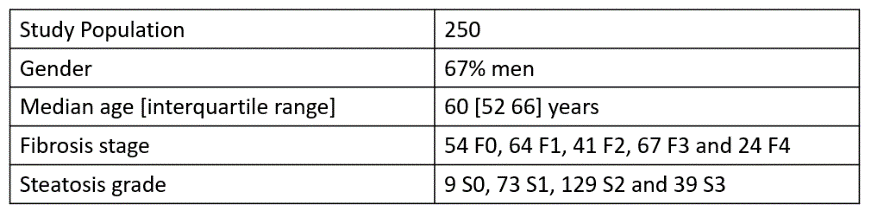
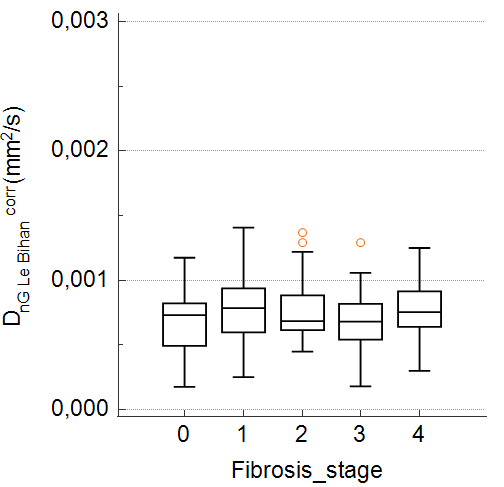
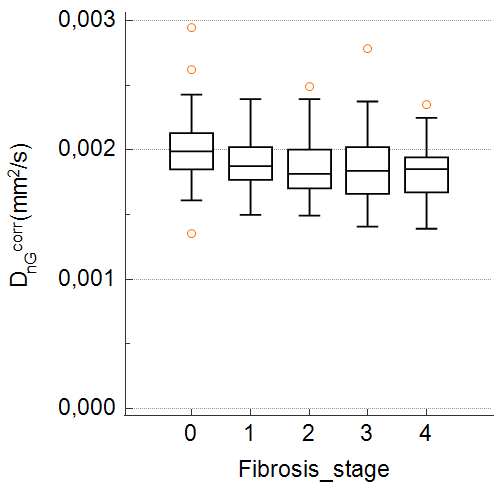
Patient demographic data are detailed in Table 2.DnG and DnG Le Bihan were not significantly different between fibrosis stages, while DnG Le Bihancorr and DnGcorr were significantly different (Kruskall-Wallis p = 0.03 and p = 0.005 respectively) (fig.1 & fig.2). Post-hoc analysis with the Conover test (p<0.05) showed that F0 had significantly higher DnGcorr than the other stage. At multivariate regression, DnGcorr was significantly determined by fibrosis (rpartial / p of - 0,19 / < 0.002), while DnG Le Bihancorr was not found to be determined by fibrosis or steatosis.
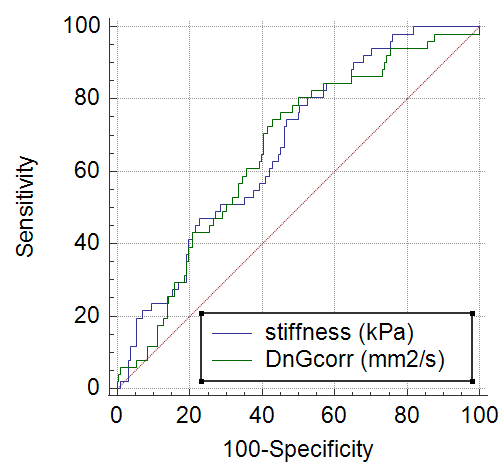
The area under the receiver operating characteristic curve (AUC) for the detection of fibrosis (F ≥ 1) with DnGcorr was 0.66 (p < 0.001). The AUC of MRE stiffness was similar (0.67, p < 0.001) (Fig. 3).
Discussion
In agreement with previous reports in NAFLD-specific patients (6), and in contrast to findings obtained in a general liver disease population (4), we did not find significant differences in DnG Le Bihan among various fibrosis stages in our NAFLD population. As suggested by Le Bihan et al. (7) adding fat correction in the calculation of DnG Le Bihan enabled to show a link between diffusion and fibrosis. However, this result did not hold in our multivariate analysis.The result of the Kruskal-Wallis test for DnG as a function of fibrosis stage was not significant, but once fat suppression was included, the trends changed and the statistical test became significant. The post-hoc test significantly distinguished between F0 and F1-F4 stages. The diagnostic performance of DnGcorr (AUC: 0.66) for liver fibrosis (F ≥ 1) was similar to that of MRE stiffness (AUC: 0.67), the reference parameter.
Conclusion
Application of the diffusion MRI method we are proposing, involving a non-Gaussian model, a non-linear fit model with multiple b values and fat correction, enabled detecting liver fibrosis in a NAFLD population. This method had similar diagnostic performance for liver fibrosis detection as MRE in our study. Fat correction non-Gaussian diffusion might be useful as first line examination to detect liver fibrosis in NAFLD patients in centers without MRE.Acknowledgements
No acknowledgement found.References
1. Sanyal AJ, Van Natta ML, Clark J, Neuschwander-Tetri BA, Diehl A, Dasarathy S, et al. Prospective Study of Outcomes in Adults with Nonalcoholic Fatty Liver Disease. N Engl J Med. 21 oct 2021;385(17):1559‑69.
2. Taouli B, Chouli M, Martin AJ, Qayyum A, Coakley FV, Vilgrain V. Chronic hepatitis: Role of diffusion-weighted imaging and diffusion tensor imaging for the diagnosis of liver fibrosis and inflammation. J Magn Reson Imaging. 2008;28(1):89‑95.
3. Hansmann J, Hernando D, Reeder SB. Fat Confounds the Observed Apparent Diffusion Coefficient in Patients with Hepatic Steatosis. Magn Reson Med Off J Soc Magn Reson Med Soc Magn Reson Med. févr 2013;69(2):545‑52.
4. Le Bihan D, Ichikawa S, Motosugi U. Diffusion and Intravoxel Incoherent Motion MR Imaging–based Virtual Elastography: A Hypothesis-generating Study in the Liver. Radiology. nov 2017;285(2):609‑19.
5. Kromrey ML, Le Bihan D, Ichikawa S, Motosugi U. Diffusion-weighted MRI-based Virtual Elastography for the Assessment of Liver Fibrosis. Radiology. avr 2020;295(1):127‑35.
6. Hanniman E, Costa AF, Bowen CV, Abdolell M, Stueck A, McLeod M, et al. Prospective Evaluation of Virtual MR Elastography With Diffusion-Weighted Imaging in Subjects With Nonalcoholic Fatty Liver Disease. J Magn Reson Imaging. 2022;56(5):1448‑56.
7. Le Bihan D, Bowen C, Clarke S. Diffusion-Based Virtual MR Elastography in Subjects With Nonalcoholic Fatty Liver Disease. J Magn Reson Imaging. 2023;57(2):648‑9.
Figures