5170
MEASUREMENT OF APPARENT DIFFUSION COEFFICIENT IN NORMAL PROSTATE GLAND1Radiology and Imaging, National Academy of Medical Sciences (NAMS), Bhaktapur, Nepal
Synopsis
Motivation: The prostate gland consist of 3 distinctive zones, namely Central zone (CZ), Transitional Zone (TZ), and Peripheral Zone (PZ) having diffusive property, which can be measured by apparent diffusion coefficient (ADC) .
Goal(s): This study aims to measure ADC values of the prostate with age that varies according to tissue density.
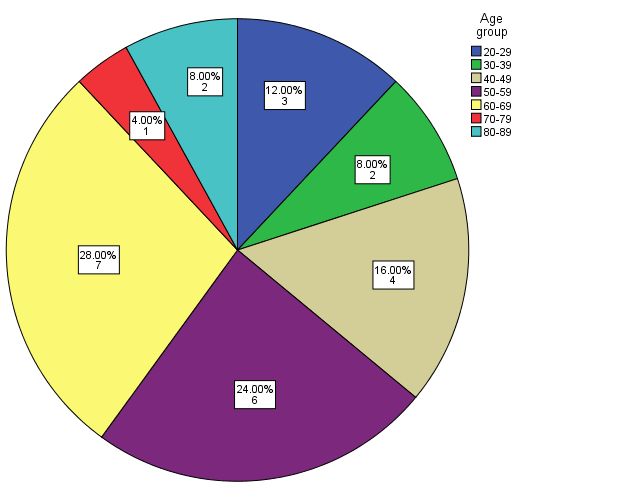
Approach: A retrospective cross-sectional study with a purposive sampling technique was conducted on 25 patients with ages ranging from 20-90 years with no history of prostatic disease.
Results: Age related decrease in ADC value were observed in this study with significant difference in ADC values between zones of prostate.
Impact: when using DWI for diagnosing prostate cancer, age-related changes in ADC value need to be considered. Increase in age have influence in ADC value of different zones showing significant differences, with highest in PZ and lowest in CZ.
Introduction
The prostate gland is commonly described into 3 distinctive zones, namely Central zone (CZ), Transitional Zone (TZ), and Peripheral Zone (PZ). In normal tissues, water molecules meander according to Brownian motion called Diffusion. The measurable physical parameter of diffusion-weighted imaging (DWI) is the apparent diffusion coefficient (ADC) which measures the mobility of the water molecules. The variation in tissue density in these zones produces different ADC values and signal intensity that changes with age. This study aims to measure ADC values of the prostate with age.Methodology
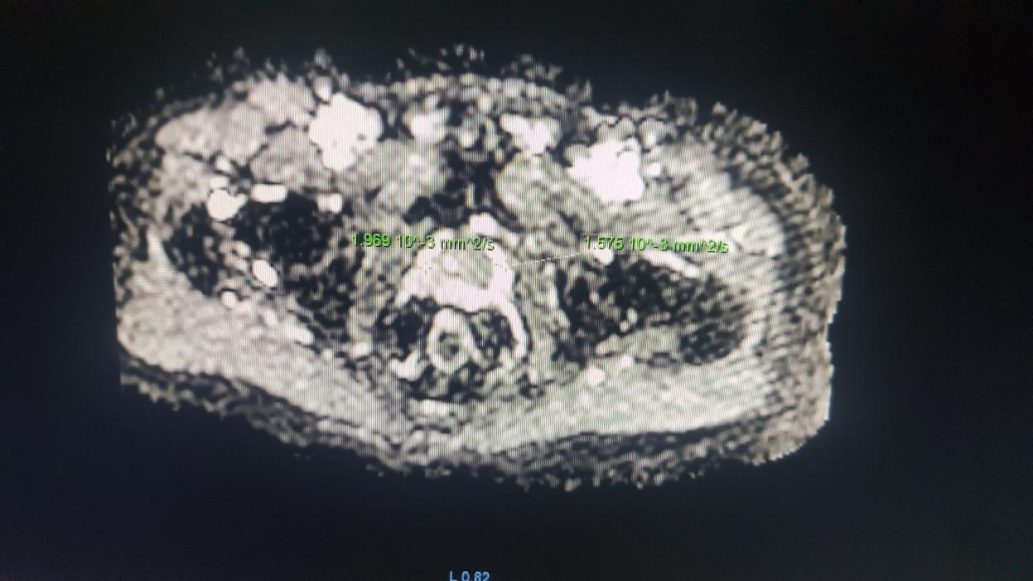
A retrospective cross-sectional study with a purposive sampling technique was conducted from August 2022 to October 2022 at the Department of Radiology and Imaging, Bir Hospital, Kathmandu, Nepal. There were 25 patients with ages ranging from 20-90 years. Adult patients with no history of prostatic disease with normal prostate gland were included in this study. Single-shot echo-planar imaging (EPI) sequences using b-factors of 0 and 1000 seconds/mm2 were used. ADC values of PZ, TZ, and CZ were measured and correlations between region and age were examined.Results
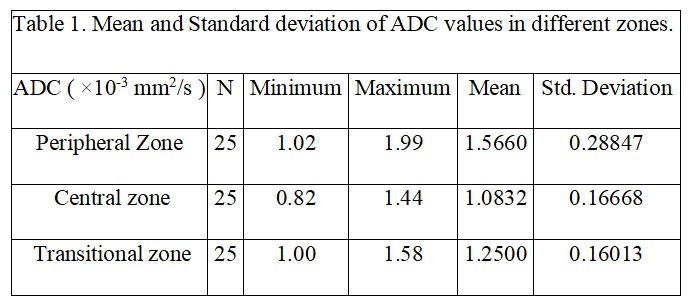
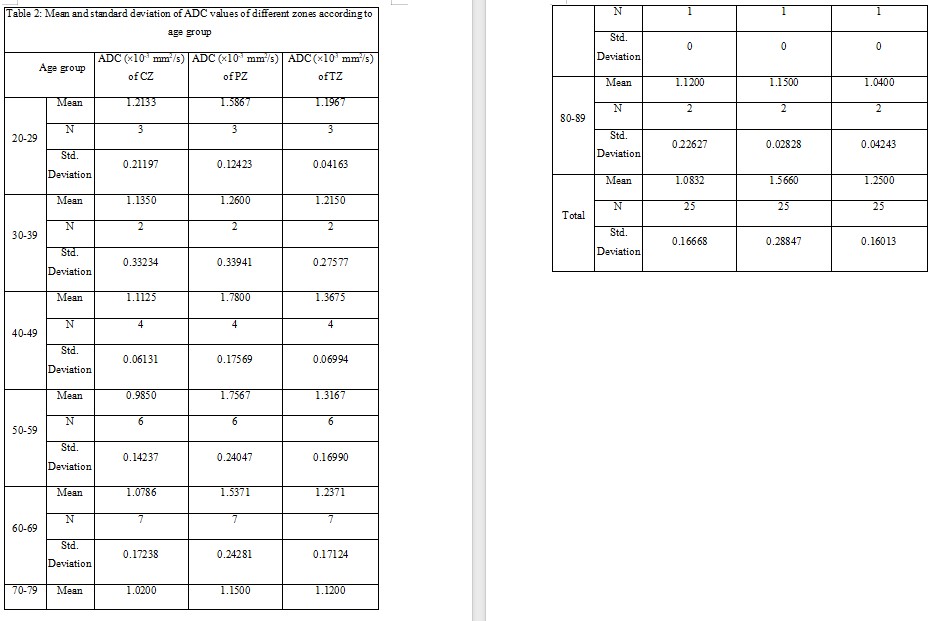
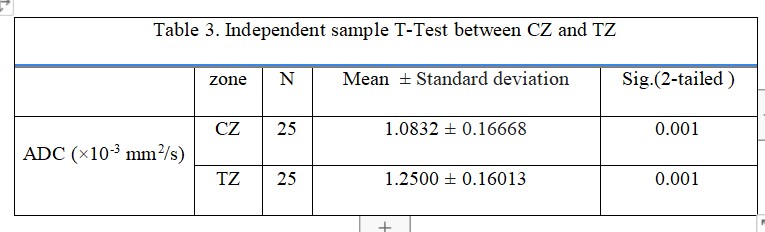
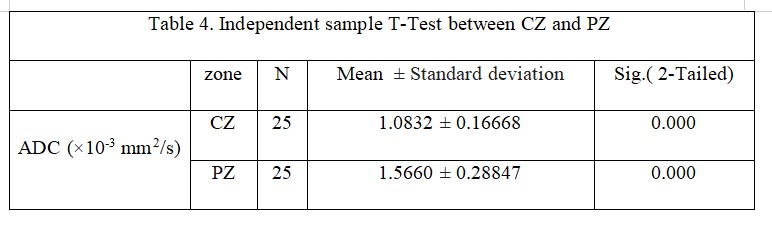
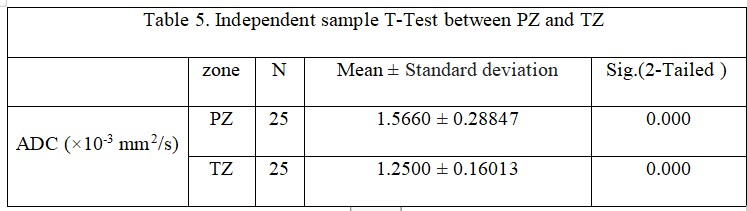
ADC values measured within PZ, TZ, and CZ regions of the prostate showed significant differences (p < 0.005). Mean ADC values were 1.56 ± 0.2×10⁻³ mm2/s for PZ, 1.25±0.16×10⁻³ mm2/s for TZ and 1.08 ± 0.16×10⁻³ mm2/s for CZ, representing a significant difference. In addition, significant negative correlations were identified between ADC values for PZ, TZ, and CZ and subject age. (r = -0.176, p = 0.400; r = -0.273, p = -0.186 ;r = -0.198 , p = 0.343, respectively )Conclusion
ADC values in all three zones of the prostate decrease with age, and this must be taken into consideration when using DWI in the diagnosis of prostate cancer.Keywords
Age, Apparent Diffusion Coefficient, Diffusion Weighted Imaging, Magnetic Resonance Imaging, ProstateAcknowledgements
First and foremost, I would like to express my profound gratitude and appreciation to my revered and erudite supervisor Assistant professor Mr. Damodar Rokka, Unit Incharge, Department of Radiology, NAMS, National Trauma Center, Kathmandu, Nepal for his constant supervision and guidance that made this project work possible.
I am extremely thankful to all of our faculty members including professor Ganesh Bahadur Pokharel Sir, Mr. Damodar Rokka Sir, Mr. Abinash Jha Sir, and Mr. Rajesh Yadav Sir for their direct and indirect help in the completion of my project work.
I am deeply grateful to Mr.Avinesh Shrestha and Mr. Suman Duwal for their valuable suggestions and immense help during the data analysis process.
I would like to express my sincere words of thanks to all my teachers, colleagues, my seniors, and friends who helped me at various points in time.
Lastly, I would like to thank the staff of the Department of Radiology and Imaging for their kind cooperation.
References
1. Standring S, Gray’s anatomy: The Anatomical Basis of Clinical Practice. 41st ed. Philadelphia: Elsevier Limited; 2015. Chapter 79, Bladder, prostate, and Urethra; p.1266-67.
2. Tirkes T, Prostate MRI Essentials: A Practical Guide for Radiologists. 1st edition. Springer; 2021 June 21. Chapter 1, Pathology of benign and malignant diseases of the prostate; p.1
3. Chatterjee A, Thomas S, Oto A. Prostate MR: pitfalls and benign lesions. Abdom Radiol. 2020 Jul 1;45(7):2154–64. DOI :https://doi.org/10.1007/s00261-019-02302-x
4. Sklinda K, Frączek M, Mruk B, Walecki J. Normal 3T MR Anatomy of the Prostate Gland and Surrounding Structures. Adv Med. 2019;2019:2-3. DOI:https://doi.org/10.1155/2019/3040859
5. Pakzad R, Mohammadian-Hafshejani A, Ghoncheh M, Pakzad I, Salehiniya H. The incidence and mortality of prostate cancer and its relationship with development in Asia. Prostate Int. 2015 Dec;3(4):135–40. DOI: http://dx.doi.org/10.1016/j.prnil.2015.09.001
6. Shrestha G, Thakur RK, Singh R, Mulmi R, Shrestha A, Pradhan PMS. Cancer burden 1in Nepal, 1990–2017: An analysis of the Global Burden of Disease study. PLOS ONE. 2021 Aug 3;16(8):e0255499. DOI:10.1371/journal.pone.0255499
7. Abd Alazeez MAA. The Role of Multiparametric MRI in Detection, Localization, and Characterization of Prostate Cancer. Doctoral thesis. UCL (University College London); 2015.
8. Emad-Eldin S, Halim M, Metwally LIA, Abdel-Aziz RM. Diffusion-weighted MR imaging and ADC measurement in normal prostate, benign prostatic hyperplasia, and prostate carcinoma. Egypt J Radiol Nucl Med. 2014 Jun 1;45(2):535–42. DOI :10.1016/j.ejrnm.2014.02.017
9. Jacobs MA, Ouwerkerk R, Petrowski K, Macura KJ. Diffusion Weighted Imaging with ADC Mapping and Spectroscopy in Prostate Cancer. Top Magn Reson Imaging TMRI. 2008 Dec;19(6):261–72. DOI: https://doi.org/10.1097%2FRMR.0b013e3181aa6b50
10. Tamada T, Sone T, Toshimitsu S, Imai S, Jo Y, Yoshida K, et al. Age-related and zonal anatomical changes of apparent diffusion coefficient values in normal human prostatic tissues. J Magn Reson Imaging. 2008;27(3):552–6. DOI:https://doi.org/10.1002/jmri.21117
11. Taha Ali TF, ElHariri MA, Riad MM. Diffusion-weighted MRI in prostatic lesions: Diagnostic performance of normalized ADC using normal peripheral prostatic zone as a reference. Egypt J Radiol Nucl Med. 2018 Mar 1;49(1):239–44. DOI: https://doi.org/10.1016/j.ejrnm.2017.09.007
12. Yagci AB, Ozari N, Aybek Z, Duzcan E. The value of diffusion-weighted MRI for prostate cancer detection and localization. Diagn Interv Radiol [Internet]. 2010 [cited 2023Jan29]; DOI: https://doi.org/10.4261/1305-3825.dir.3399-10.1
13. Tamada, Tsutomu, et al. "Apparent diffusion coefficient values in peripheral and transition zones of the prostate: comparison between normal and malignant prostatic tissues and correlation with histologic grade." Journal of magnetic resonance imaging: JMRI vol. 28,3 (2008): 720-6. DOI: 10.1002/jmri.2150
14. Kumar V, Jagannathan NR, Kumar R, Das SC, Jindal L, Thulkar S, et al. Correlation between metabolite ratios and ADC values of the prostate in men with increased PSA level. Magn Reson Imaging. 2006 Jun 1;24(5):541–8. DOI: 10.1016/j.mri.2006.01.001
15. Pickles MD, Gibbs P, Sreenivas M, Turnbull LW. Diffusion-weighted imaging of normal and malignant prostate tissue at 3.0T. J Magn Reson Imaging. 2006;23(2):130–4 DOI: 10.1002/jmri.20477
16. Issa B. In vivo measurement of the apparent diffusion coefficient in normal and malignant prostatic tissues using echo-planar imaging. J MagnResonImaging. 2002;16(2):196–200 DOI: 10.1002/jmri.10139
Figures