5169
Relationship between uterine displacements and quality of T2-weighted images of the female pelvis1Fukushima Medical University Hospital, Fukushima, Japan, 2Graduate School of Ibaraki Prefectural University of Health Sciences, Ami, Japan, 3School of Health Sciences, Fukushima Medical University, Fukushima, Japan, 4Fukushima Medical University School of Medicine, Fukushima, Japan
Synopsis
Motivation: In some cases, the quality of T2-weighted images is poor independent of the position of the uterus in the pelvis.
Goal(s): Our goal was to investigate the relationship between uterine displacement and quality of T2-weighted images.
Approach: T2-weighted images of the female pelvis were classified according to image quality. Additionally, uterine displacements were calculated by analyzing cine images of the uterus.
Results: The quality of the T2-weighted images of the female pelvis degrades with increasing uterine displacement.
Impact: The quality of T2-weighted images is expected to be improved by the analysis of uterine displacements because this would enable us to address the artifacts in advance.
Purpose
Uterine artifacts are noticeable on T2-weighted images of the female pelvis in some cases. Image quality has been reported to be better when the uterus is located posterior to the pelvis and adjacent to the vertebra1. We hypothesized that larger uterine displacement would worsen the quality of T2-weighted images. Therefore, we aimed to investigate the relationship between uterine displacement and quality of T2-weighted images of the female pelvis.Method
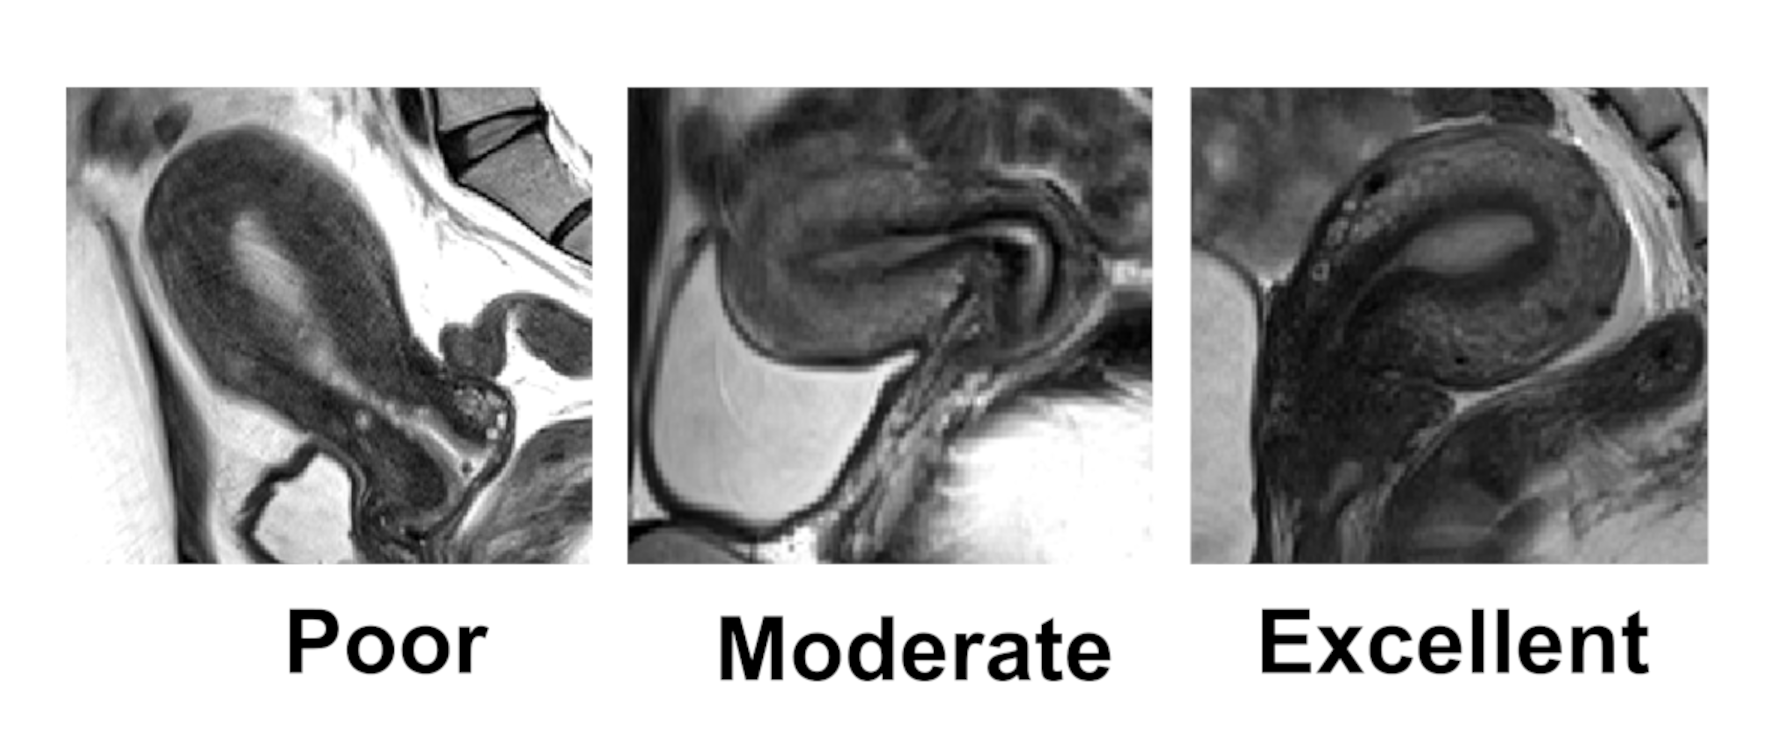
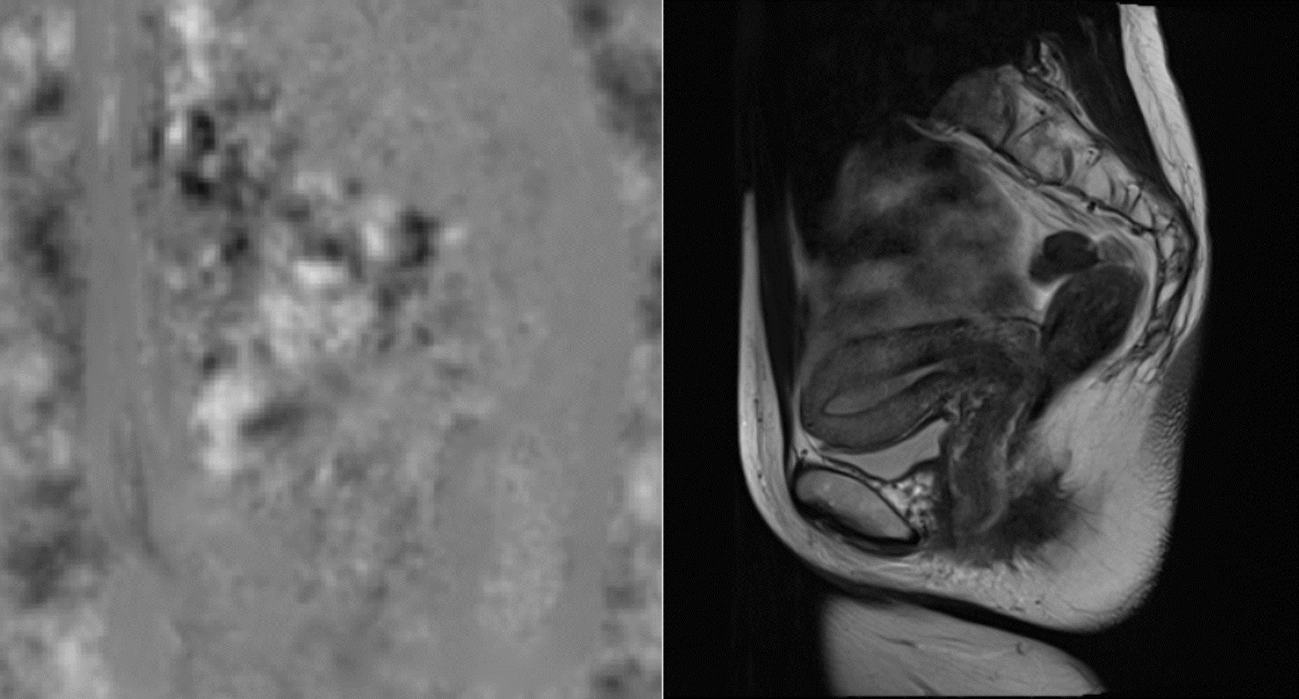
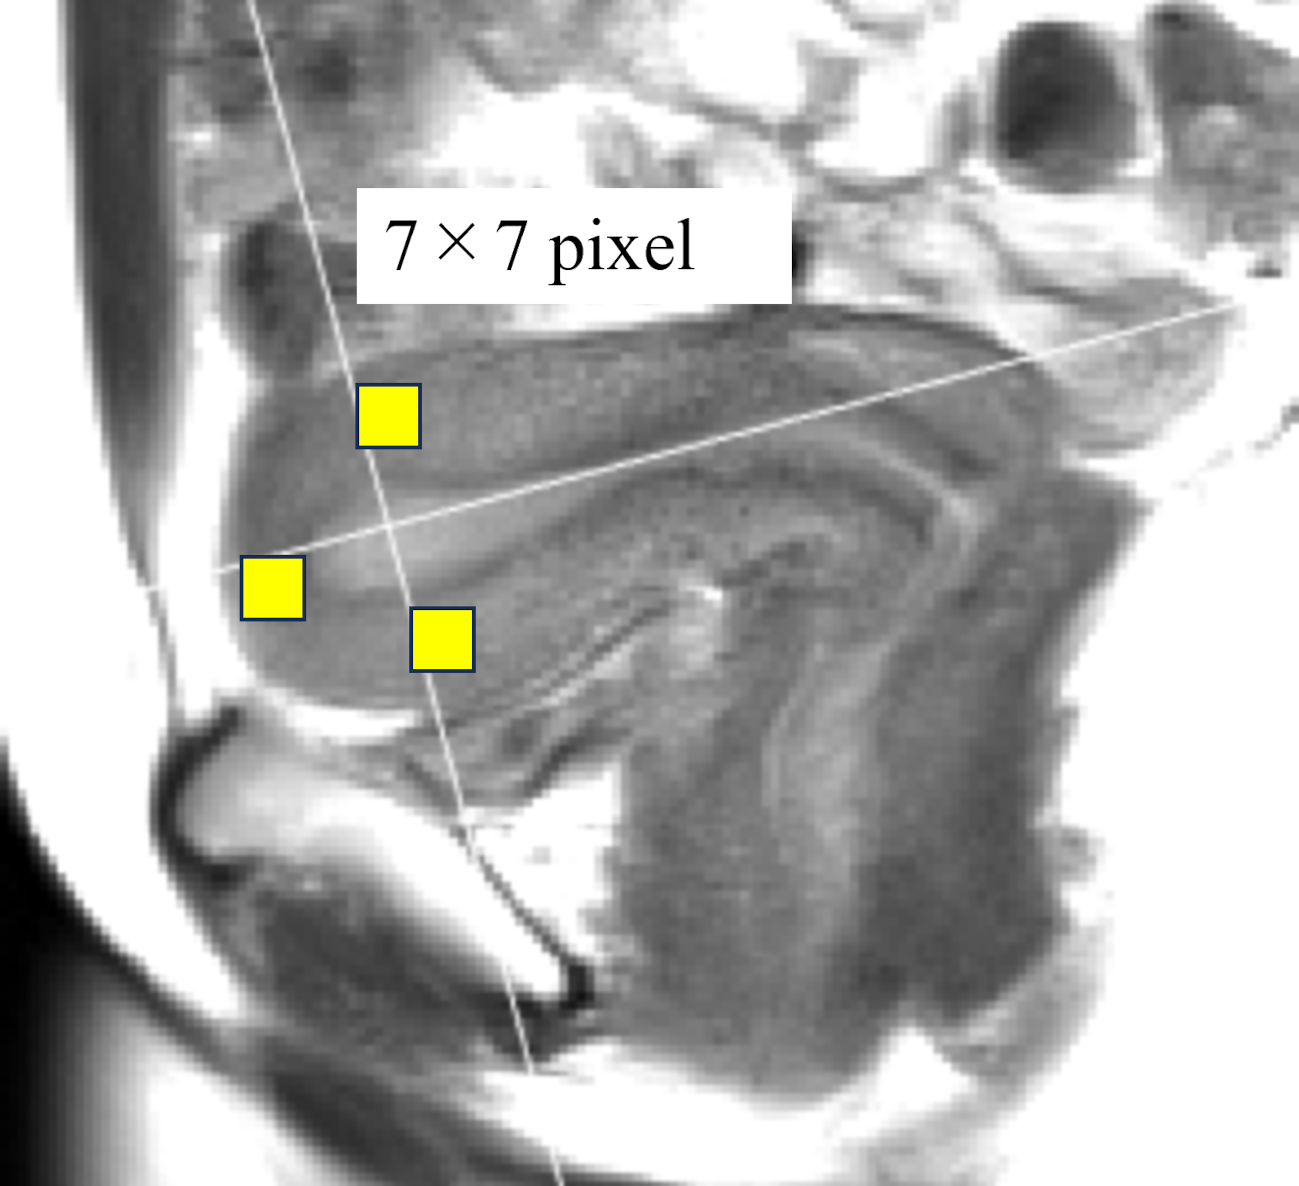
The participants were 81 adult women who underwent pelvic MRI examinations using a SIEMENS 3.0 T MRI machine (Magnetom Skyra). FSE was used for T2-weighted images and SSFSE for cine images. Imaging parameters for T2-weighted images are TR of 4000 ms, TE of 99 ms, slice thickness of 5 mm, FOV of 260 mm, matrix size of 384*307, ETL of 14. Imaging parameters for cine images are TR of 1000 ms, TE of 76 ms, slice thickness of 10 mm, FOV of 256 mm, matrix size of 256*256, 1 frame/s (total 32 flames). Two radiologists classified T2-weighted images into three groups based on quality: poor, moderate, and excellent (Figure 1). Using cine images of the female pelvis with a temporal resolution of 1 s, we calculated the displacement field maps of the uterus in the anteroposterior and head-foot directions. The displacement field maps were created using the imregdemons function (MATLAB 2022b) as shown in Figure 2. This function estimates the displacements of the target image from the reference image2. The first image was excluded because of the contrast. The mean and maximum displacement values during 30 s were calculated using the displacement field maps. Three regions of interest were set on the body of the uterus in the displacement field maps (Figure 3). R (ver.4.2.2) was used to verify whether there was a significant correlation between each displacement and the image quality of T2-weighted images. Kruskal–Wallis test and Steel–Dwass tests were used for statistical analysis. The significance level was set at P < 0.05. This study was approved by the Ethics Committee of the hospital.Results
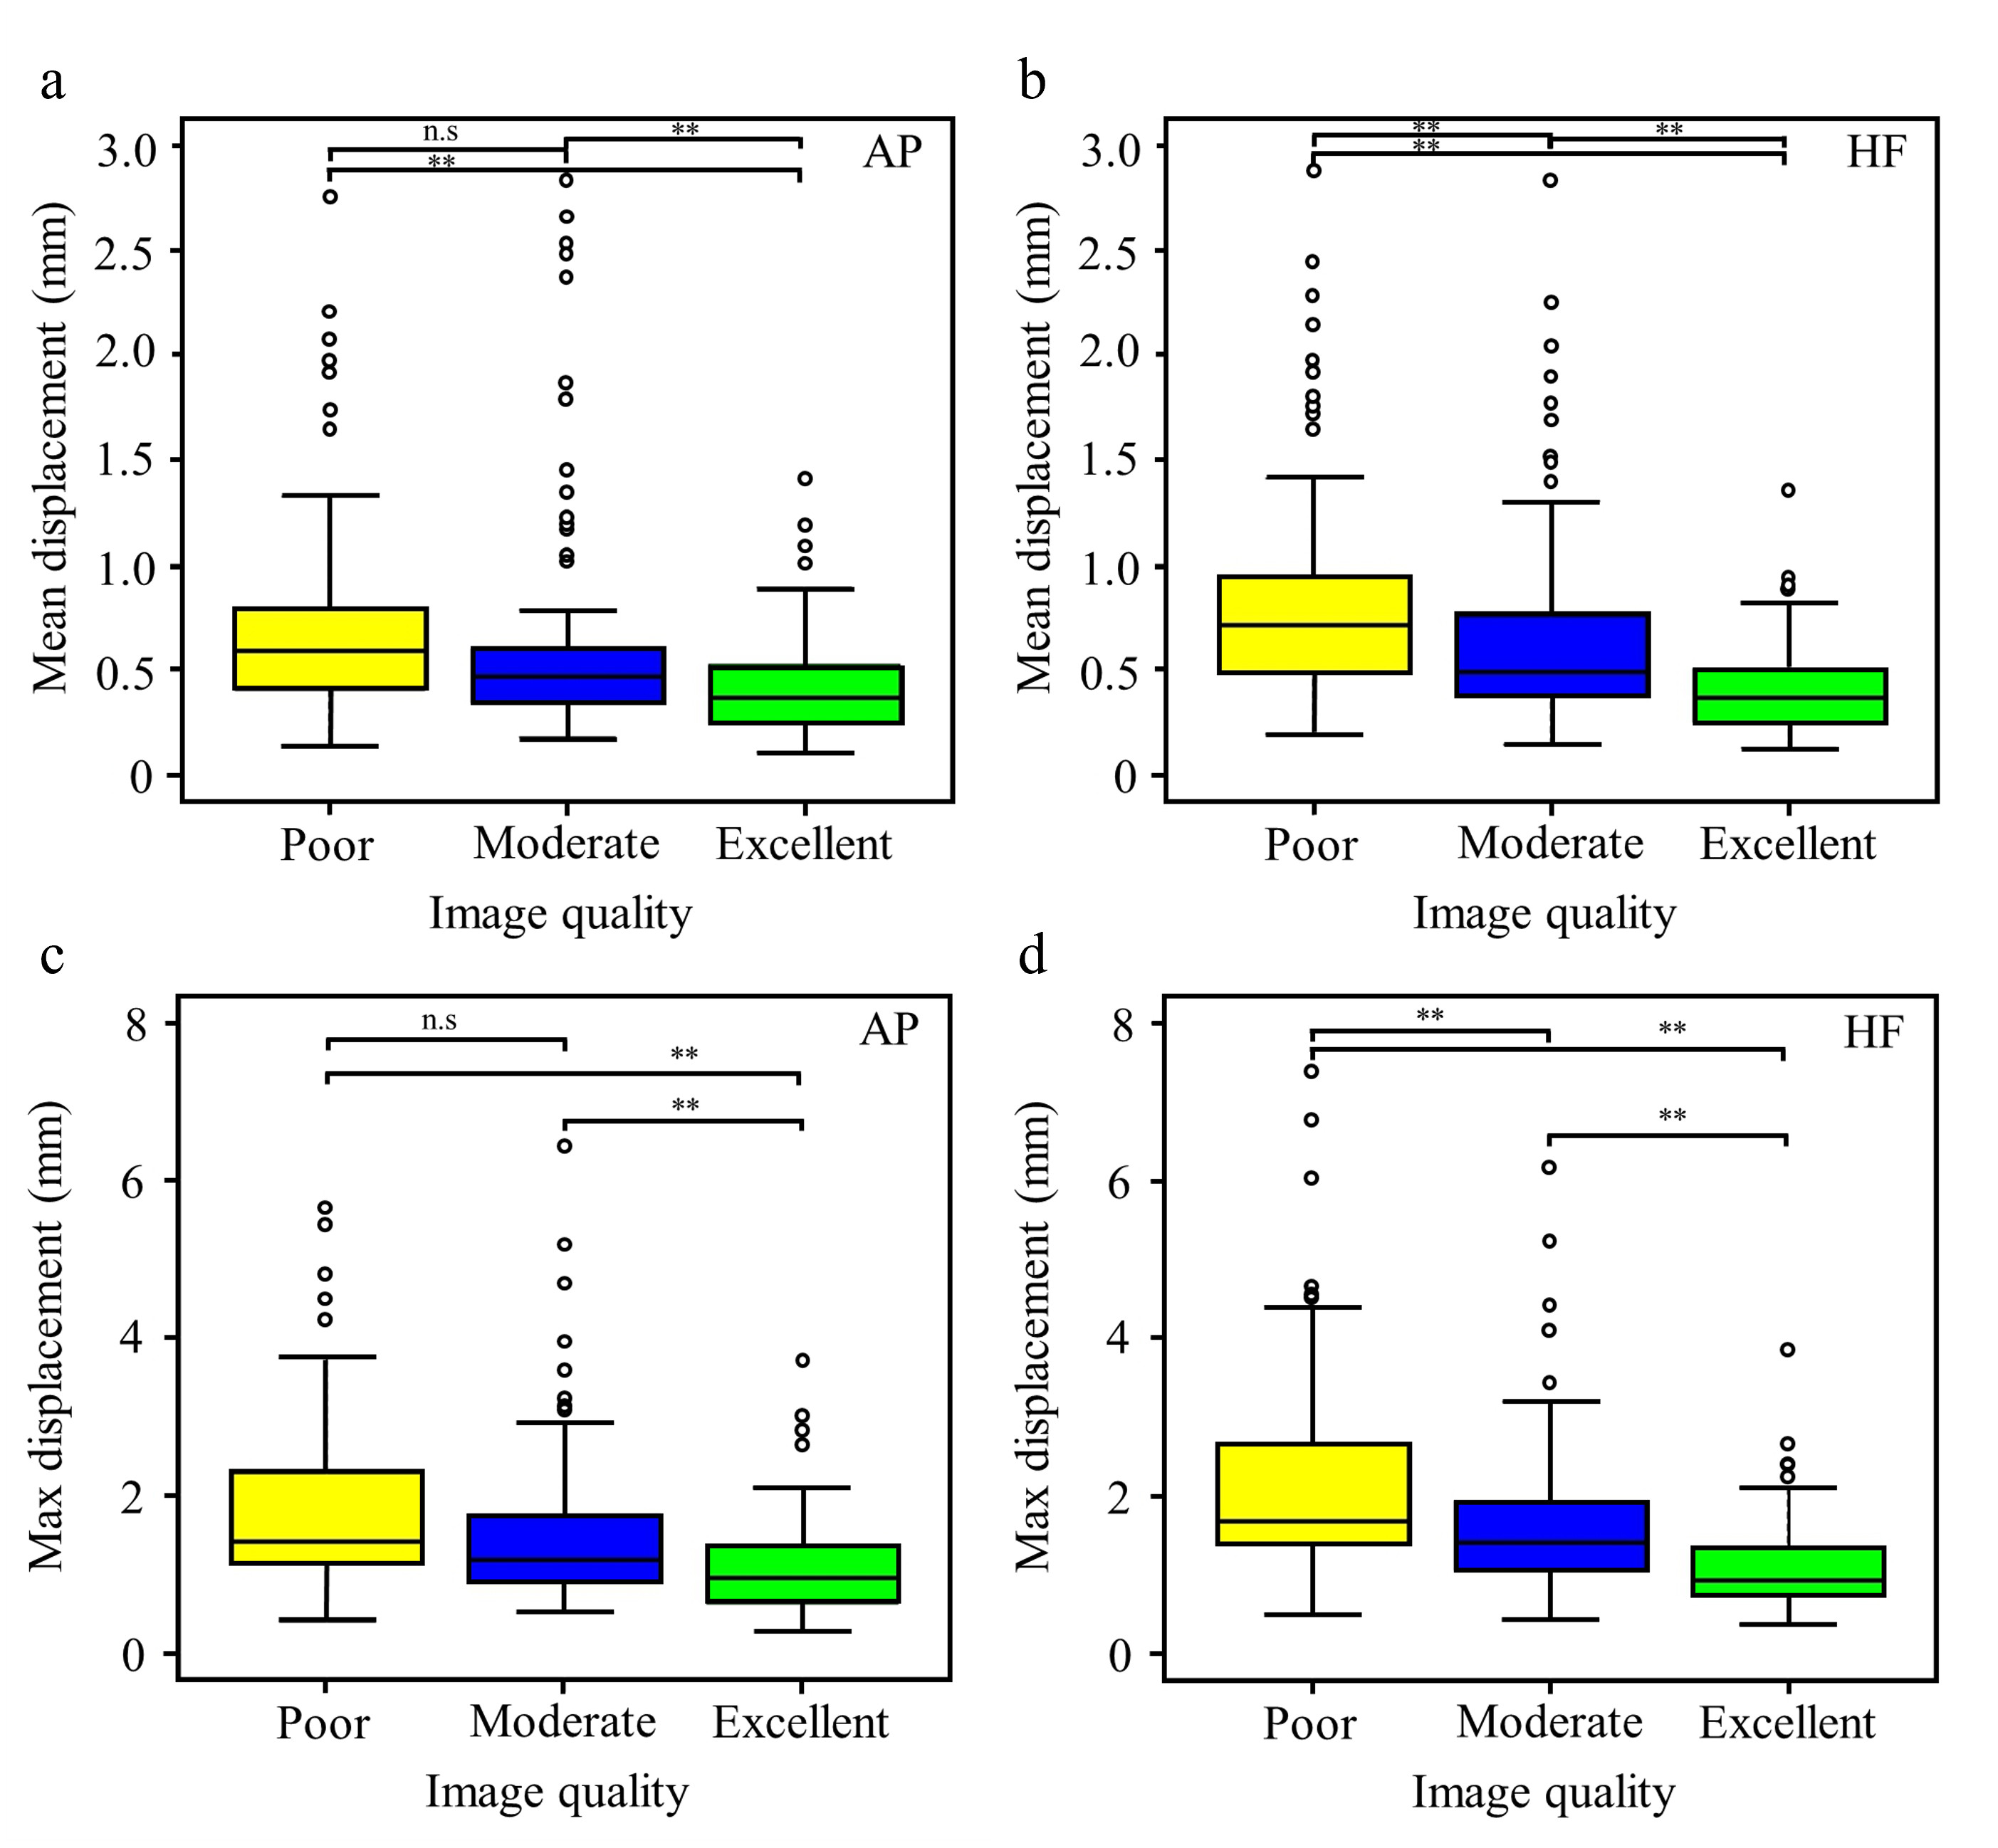
The mean displacements in the anteroposterior direction of the poor, moderate, and excellent images were 0.71 ± 0.49, 0.67 ± 0.60, and 0.42 ± 0.25 mm, respectively (Figure 4a); the maximum displacements in the anteroposterior direction of these images were 1.77 ± 1.09, 1.57 ± 1.13, and 1.09 ± 0.63 mm, respectively (Figure 4c). The mean displacements in the head-foot direction of the poor, moderate, and excellent images were 0.88 ± 0.63, 0.68 ± 0.51, and 0.42 ± 0.23 mm, respectively (Figure 4b); the maximum displacements in the head-foot direction of these images were 2.19 ± 1.4, 1.69 ± 1.07, and 1.10 ± 0.61 mm, respectively (Figure 4d). There was a significant difference in the anteroposterior displacements between the poor and excellent images and the moderate and excellent images (P < 0.01). There was a significant difference in the displacements of head-foot direction among all three groups of images (P < 0.01).Conclusion
The quality of T2-weighted images tended to worsen with large uterine displacements. Therefore, the quality of T2-weighted images is expected to improve because we would be able to deal with the artifacts beforehand for images judged as poor based on uterine displacement.Acknowledgements
We would like to thank Editage (www.editage.jp) for English language editing.References
1. Tsuboyama T, et al. Effect of uterine position and intrapelvic motions on the image quality of 3D T2-weighted MRI of the uterus: Can short prescans predict the non-diagnostic image quality? Eur J Radiol. 2020;130:109186.
2. MathWorks. https://www.mathworks.com/ Accessed 7 Nov 2023.
Figures