5165
Multi-echo SWI at 0.5T: Acquisition and AI-Reconstruction1GE HealthCare, Bangalore, India, 2Narula Diagnostics, Rohtak, India
Synopsis
Motivation: To explore the feasibility of multi-echo susceptibility weighted imaging at 0.5T as lower field strength MRI scanners are cost effective.
Goal(s): Assess the effectiveness of swi at lower field strength as it is one of the important sequences in Brain MRI
Approach: This study involves acquisition of 3D multi-echo gradient echo sequence to generate SWI with combination of protocol optimization specifically for 0.5T and Denoising both real and imaginary images using deep learning algorithm to boost SNR
Results: Findings shows SWI at 0.5T can provide information about susceptibility variations in brain and helps improve diagnosis.
Impact: SWI at 0.5T using deep learning-based reconstruction will increase the quality of image by improving SNR, reducing artefacts imparted by the noise in phase.
Introduction
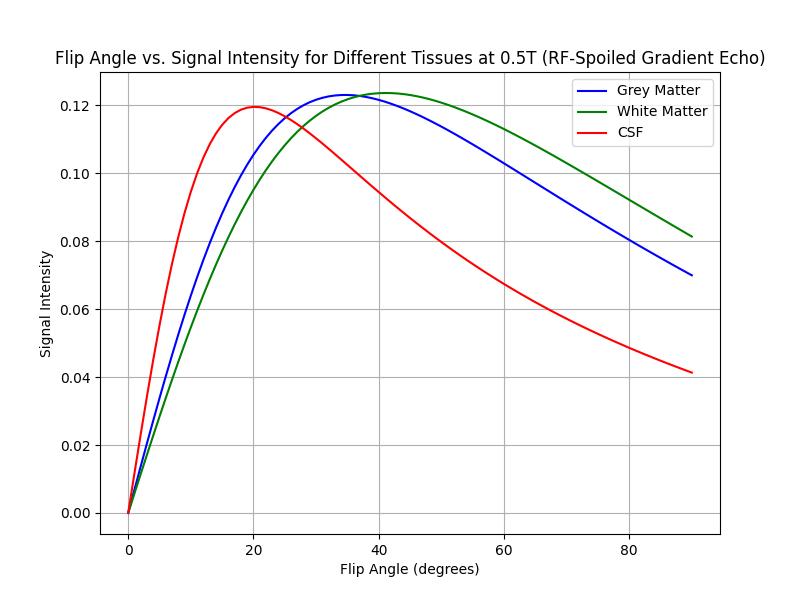
Susceptibility weighted imaging (SWI) is an essential sequence for brain to study micro hemorrhages, calcifications, and intravascular thrombosis [1]. It is a 3D gradient echo sequence that leverages T2* effects in combination with SWI processing by utilizing the phase information to generate contrast based on the susceptibility variations due to dia and para magnetic components [2-3]. Since susceptibility effects are lower at low field strengths such as 0.5T, optimization of protocol parameters such as TR, TE & Flip angle are required to generate adequate susceptibility image contrast. Through simulation shown in Figure1, we found the optimal flip angle at 0.5T for swi contrast is 45° to ensure that CSF is neither too bright nor dark. This will be useful to detect edema which appear bright, and hemorrhages that appear dark (signal void). Simulations were based on the T1 and T2* values of gray matter, white matter, and CSF at 0.5T obtained from literature [4]. Another disadvantage in going to lower field strength is reduced SNR. This loss in SNR can be compensated by separately denoising both real & imaginary parts of SWI using our proposed deep learning method.Materials & Methods
GE 1.5T Signa Creator scanner ramped down to 0.5T and 14 channel receive only Head Neck Coil was used to image brain. 10 patients were scanned at a diagnostic centre with conventional clinical MRI scan on the commercial 1.5T scanner along with 3 to 6 clinically relevant series including 3D SWAN sequence on the 0.5T scanner after obtaining informed consent approved by IRB. Protocol was optimized on 3 healthy volunteers and the scan parameters used for 3D SWAN after optimization are FOV:24cm, Slice thickness: 3mm, TR: 149ms, TE: 108ms, Flip angle: 45°, No. of echoes:7, Receiver Bandwidth: +/- 15.6kHz. ARC acceleration factor of 2 was applied to reduce scan time. The scan duration was 5 minutes. Phase filtering was performed after channel combination from all 14 channels. Echo combination was performed for magnitude and phase separately and then combined in the complex plane. Data was then passed through deep learning (DL) algorithms for denoising both magnitude and phase. This denoised phase is used to create phase mask and multiplied 5 times with magnitude to generate final SWI processed image.Results & Discussion
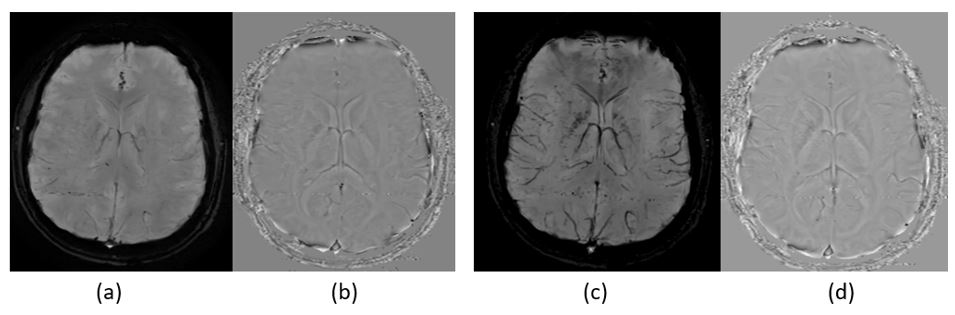
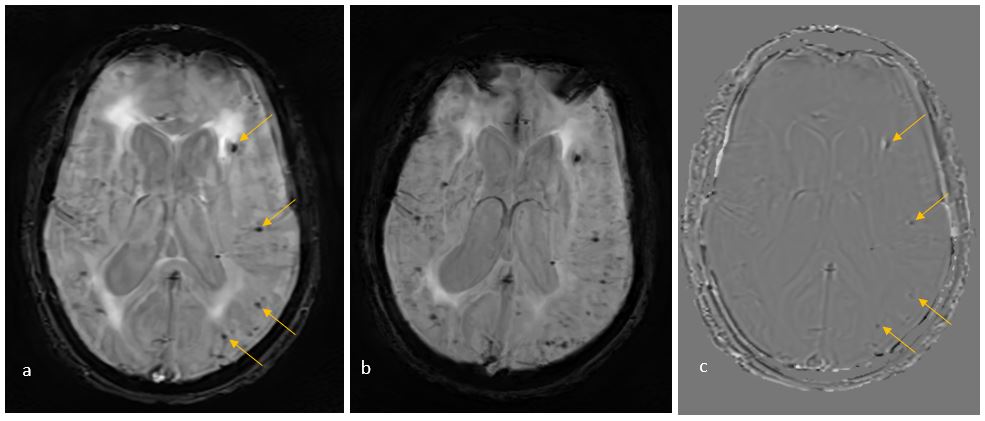
The image quality of SWI images was found to be adequate for diagnosis in all 10 subjects. The image quality improved significantly by optimizing the acquisition (Figure 2) when compared to acquisition used with 1.5T protocol without any optimization. Figure3 shows a sample SWI image after DL Processing. This patient has multiple cerebral micro bleeds, and it is preserved in the 0.5T image. The same findings are appearing as signal voids in filtered phase image because of the presence of deoxyhemoglobin which causes negative phase shift. Since susceptibility effect is less in 0.5T, we need to use longer echo time up to 108ms. with multiple echoes, the SNR of later echoes are poor. Aggressive denoising of the low SNR echoes will result blurring. When the blurred echoes are later combined, the final IQ is reduced. Hence, we propose to combine the echoes first, by combining the magnitude and phase images separately and brought back to complex domain, where the denoising and super-resolution is performed. In SWI, as phase is raised to a high power and multiplied with magnitude image to accentuate the bleeds and minerals, even minimal noise added back to the phase will appear as hypointense spots. Hence phase images are 100% denoised, but a percentage of residue can be added to provide texture to magnitude image.Conclusion
Susceptibility weighted imaging at 0.5T is feasible and provides adequate diagnostically useful information with protocol optimization. Low SNR due to reduced field strength can be compensated by applying deep learning algorithms for denoising both real and imaginary images to produce final susceptibility weighted image.Acknowledgements
No acknowledgement found.References
- ACR–ASNR–SPR Practice parameter for the performance and interpretation of magnetic resonance imaging (mri) of the brain
- Haacke, E. M., Xu, Y., Cheng, Y. C., and Reichenbach, J. R. (2004). Susceptibility weighted imaging (SWI). Magn. Reson. Med. 52, 612–618.
- Reichenbach JR, Venkatesan R, Schillinger DJ, Kido DK, Haacke EM. Small vessels in the human brain: MR venography with Deoxyhemoglobin as an intrinsic contrast agent. Radiology. 1997 Jul;204(1):272-7. doi: 10.1148/radiology.204.1.9205259.
- Adrienne E. Campbell-Washburn et.al Opportunities in Interventional and Diagnostic Imaging by Using High-Performance Low-Field-Strength MRI. Radiology 2019 293:2, 384-393.
Figures