5162
Unrolled Variational Networks and Super Resolution in Clinical MRI at 3 Tesla: An Evaluation of Noise Characteristics, Contrast, and Sharpness1Radiological Technology, Kobe City Medical Center General Hospital, Kobe, Japan, 2Department of Diagnostic Radiology, Kobe City Medical Center General Hospital, Kobe, Japan
Synopsis
Keywords:
Motivation: Deep Learning based reconstruction methods, specifically Unrolled Variational Networks (UVN), have been proposed to enhance MRI image quality at high reduction factors. However, physical image characteristics have not been fully evaluated.
Goal(s): This study evaluated the noise, contrast characteristics, and sharpness in images reconstructed using UVN.
Approach: Various phantoms were utilized for evaluation, assessing SNR, Noise Power Spectrum, Contrast Ratio, and Point Spread Function.
Results: With an increase in the reduction factor, the SNR improved, but both low-frequency and high-frequency noise increased. Despite a slight decrease in the contrast ratio with the increase in reduction factor, DL application notably enhanced image sharpness.
Impact: Our study investigates the application of Unrolled Variational Networks in MRI systems. The potential improvement in image quality could lead to more accurate diagnoses, changing the way clinicians approach MRI imaging and prompting further research in medical imaging.
Purpose
Magnetic Resonance Imaging (MRI) is an indispensable diagnostic tool in clinical practice. The quality of MRI images, determined by factors such as noise characteristics, contrasts, and sharpness play a crucial role in ensuring accurate diagnosis. Recently, Deep Learning (DL) based reconstruction method using unrolled variational networks (UVN) named Deep Resolve Boost and Sharp, has been proposed to enhance the quality of MRI images, potentially allowing for higher reduction factors 1,2,3. However, the physical image characteristics of this method have not been fully evaluated. The purpose of this study was to evaluate the noise characteristics, contrast ratio (CR), and sharpness of images reconstructed by clinical MRI systems using UVN. Noise characteristics were assessed using Signal to Noise Ratio (SNR) and Noise Power Spectrum (NPS), while sharpness was evaluated using Point Spread Function (PSF).Methods
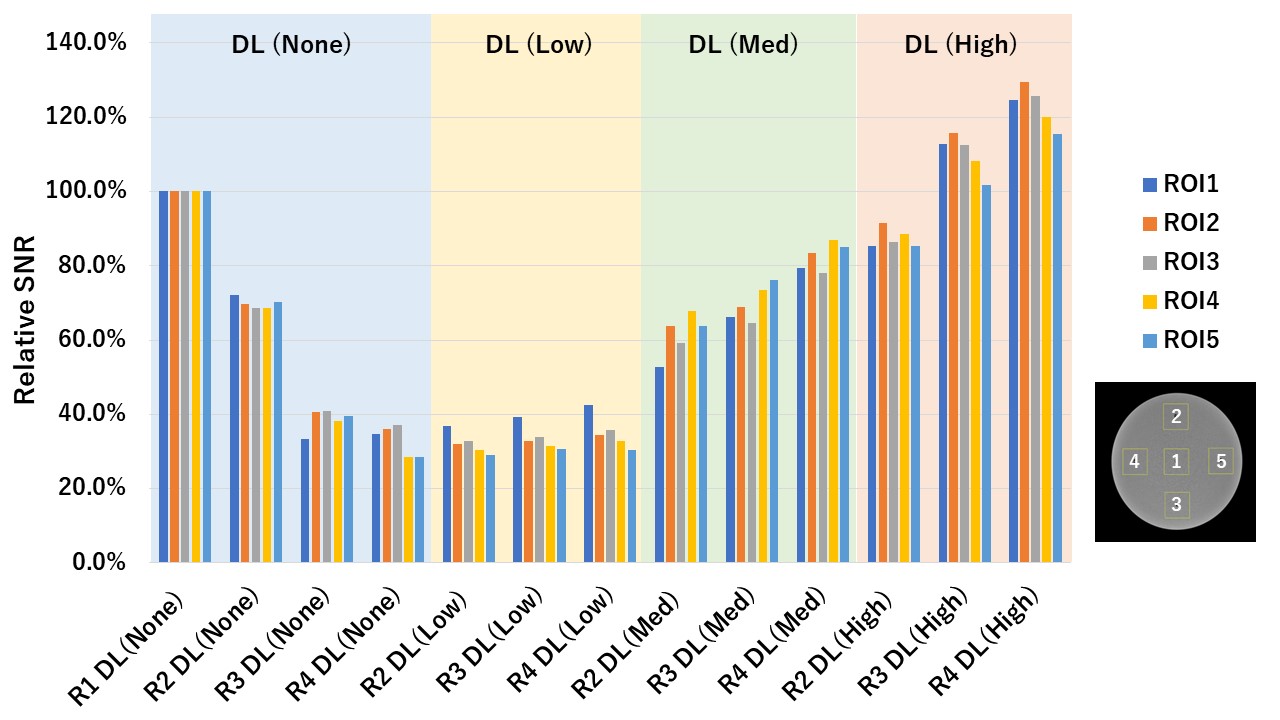
All imaging was performed on a 3.0 T MRI scanner (MAGNETOM Vida XT, Version XA 50; Siemens Healthineers, Erlangen, Germany) with a Head-Neck 64Ch Coil. For SNR and NPS analysis, we used the JMR-Ⅱ phantom (180 mm in diameter, 160 mm in height, T1/T2: 241/89 msec; Kyoto Kagaku, Kyoto, Japan). We created seven types of contrast phantoms using indigestible dextrin and olive oil (T1: 274 ~ 2449 msec, T2: 24 ~ 583 msec) for CR analysis. Additionally, a slit phantom (Polypropylene bowl filled with gelatin, slit: polystyrene resin plate thickness: 0.4mm) was made for PSF analysis. Two-dimensional (2D) Turbo Spin Echo (TSE) was performed for each phantom. The acquisition parameters of 2D TSE were as follows: repetition time/echo time (TR/TE) = 5000/80 msec, flip angle =140 degrees, acquisition matrix size = 320×312 (reconstructed matrix size = 640×640), Field of View (FOV) = 200 mm × 200 mm, Echo Train Length (ETL) = 15, number of excitations = 1. The reduction (R) factor of parallel imaging was changed in range [1, 2, 3, 4], and reconstructed DL intensities were also converted in range [None, Low, Medium, High].The SNR measurements were performed using the Subtraction Mapping Method 4. Following this, regions of interest (ROIs) were set in the central and peripheral areas of the created SNR map. The relative SNR was calculated using DL (None) with an R factor of 1 as the reference.
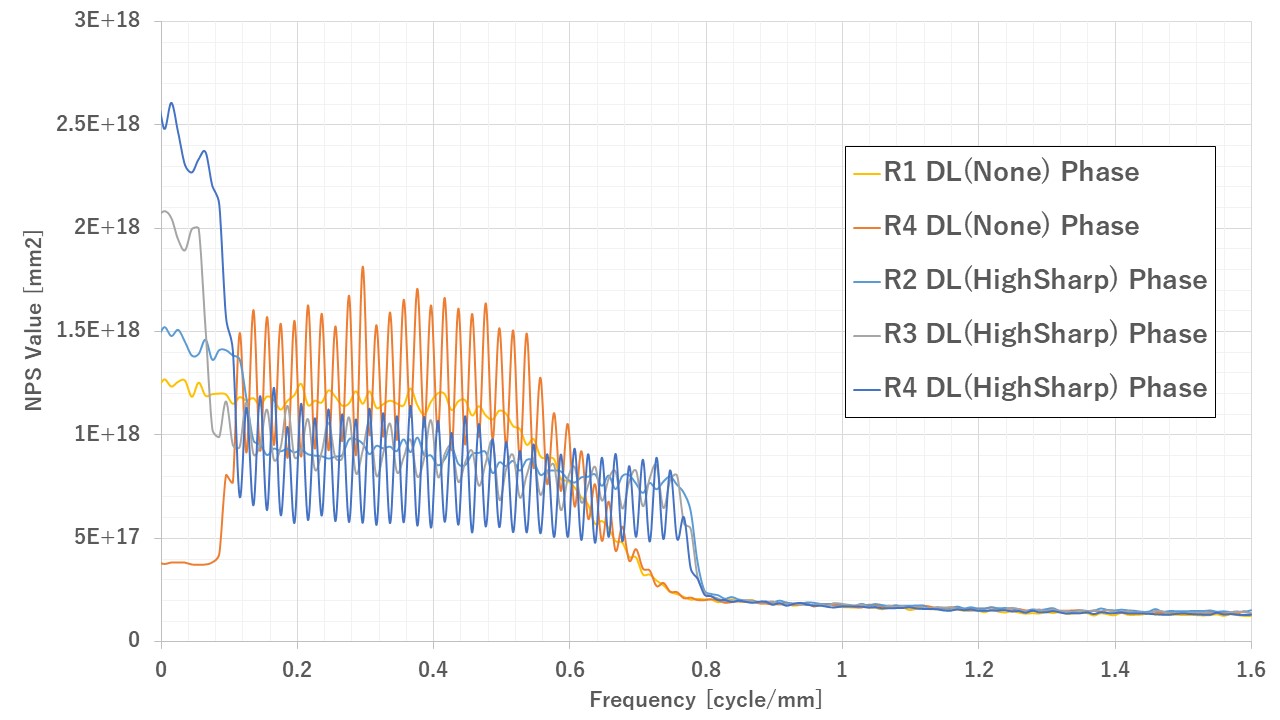
The NPS measurements were performed as follows: We obtained a subtracted image from two phantom images. Then, we selected the central region (320 × 320) of the subtracted image, squared the absolute value of the 2D Fourier transform to generate a pre-averaging 2D-NPS, and averaged 5 pre-averaging 2D-NPS to calculate a 2D-NPS. Finally, the NPS was generated separately from the 2D-NPS, averaged along both the readout direction and the phase encoding direction5,6.
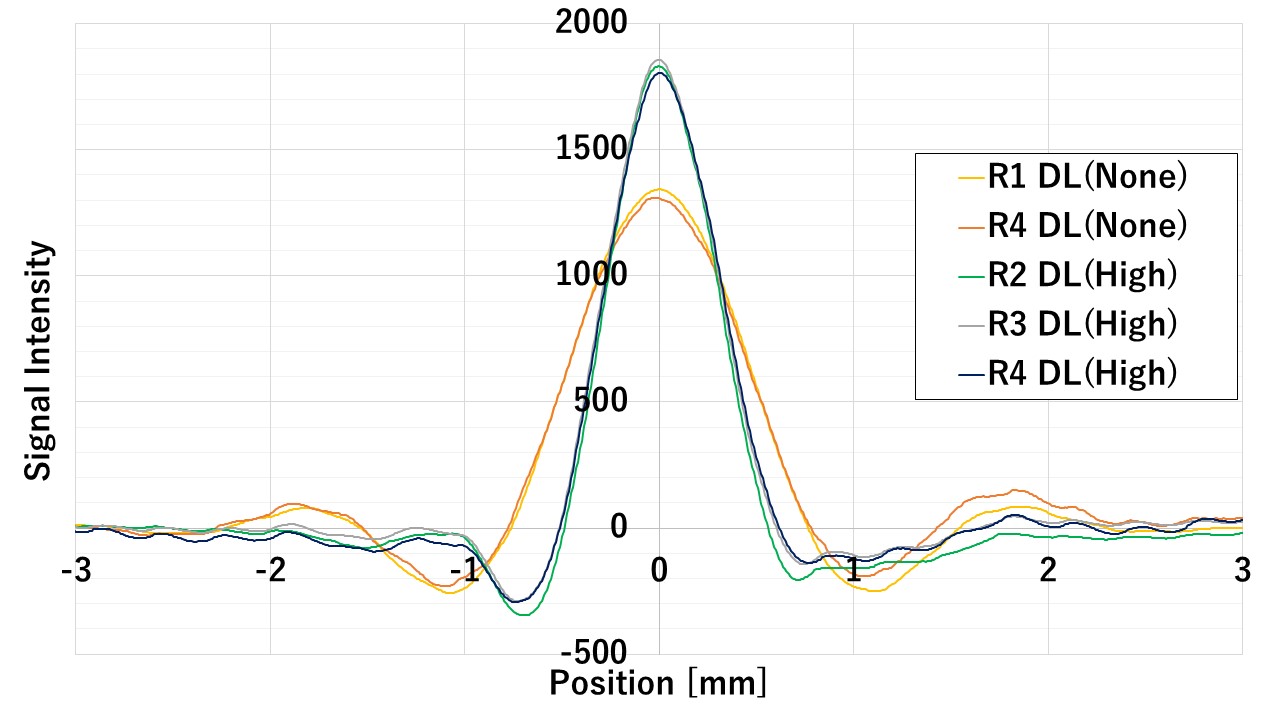
The PSF measurements were performed as follows: We obtained a slit phantom image, then cropped the image to contain the slit. A Line Spread Function (LSF) was obtained from the cropped image. The Point Spread Function (PSF) was subsequently calculated7. Additionally, the Full Width at Half Maximum (FWHM) was determined from the PSF to quantify the sharpness of the image.
The NPS and PSF were calculated automatically using Python software.
The evaluation was conducted by comparing the SNR, NPS, CR, and PSF (FWHM) values obtained from the images reconstructed using UVN to those from images without the application of UVN.
Results
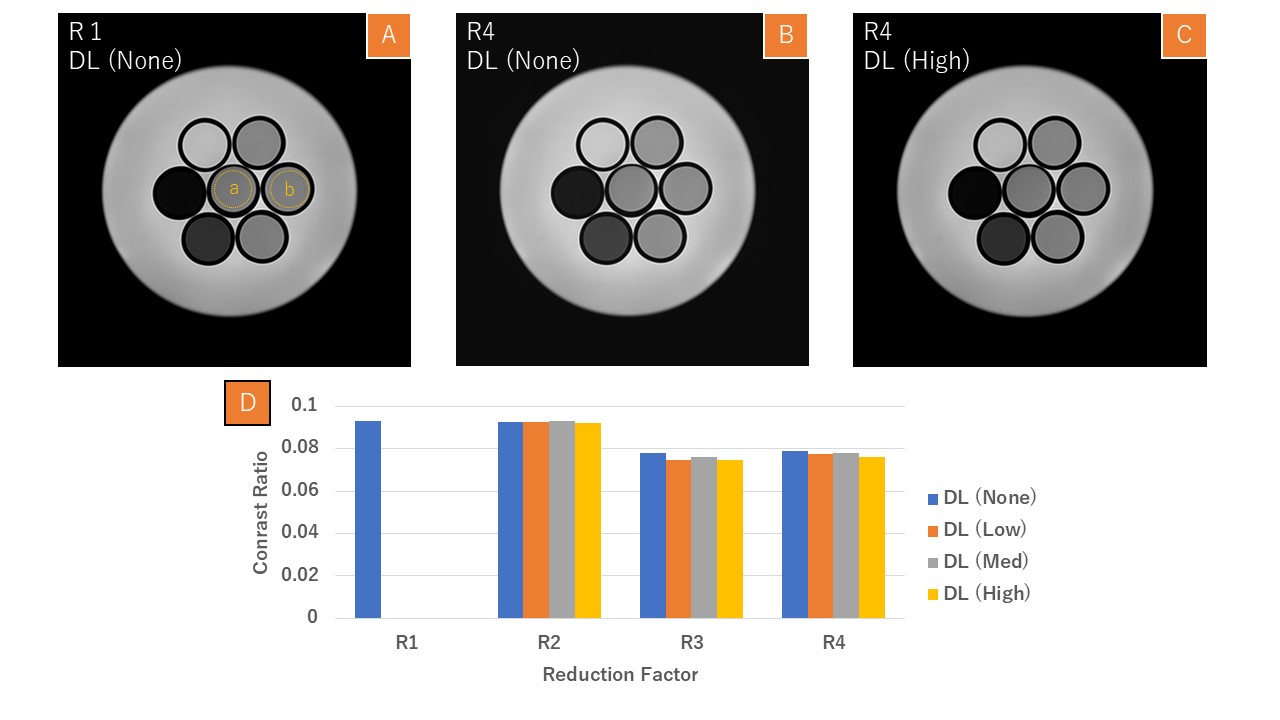
The SNR measurement results indicated an inverse relationship compared to the expected trend: in the case of DL(None), the SNR decreased as the R factor increased, but when using DL, the SNR improvement effect increased as the R factor increased. When comparing the SNR increase rate by DL intensity based on DL(None) at each R Factor, the SNR increase rate increased as the DL intensity increased. The NPS analysis revealed that the application of UVN induced the generation of both low-frequency and high-frequency noise. The CR results indicated that the application of DL, particularly at higher R factors, leads to a slight decrease in contrast under low contrast conditions. In the PSF analysis, we observed a reduction in the FWHM from 0.94 mm at R1, DL(None) to 0.61 mm at R4, DL(High), indicating that the application of DL enhances image sharpness.Conclusions
The application of DL-based reconstruction using Unrolled Variational Networks and Super Resolution in MRI systems can enhance image sharpness and SNR, particularly at high reduction factors. However, it may also result in an increase in both low-frequency and high-frequency noise, and a slight deterioration in the contrast ratio.Acknowledgements
No acknowledgement found.References
- Behl, N. Deep Resolve Mobilizing the Power of Networks. MAGNETOM Flash, 2021; 78 : 29-35.
- Sebastian Gassenmaier,Saif Afat,Marcel Dominik Nickel, et al. Accelerated T2-Weighted TSE Imaging of the Prostate Using Deep Learning Image Reconstruction: A Prospective Comparison with Standard T2-Weighted TSE Imaging. Cancers. 2021 Jul; 13(14): 3593.
- Sebastian Gassenmaier, Thomas Küstner,Dominik Nickel, et al. Deep Learning Applications in Magnetic Resonance Imaging: Has the Future Become Present? Diagnostics. 2021 Dec; 11(12): 2181.
- Imai H, Miyati T, Ogura A, et al. Signal-to-noise Ratio Measurement in Parallal MRI with Subtraction Mapping and Consecutive Methods. Jpn.J.Radiol.Technol. 2008;64: 930-936
- Ichinoseki Y, Nagasaka T, Miyamoto K, et al. Noise Power Spectrum in PROPELLER MR Imaging. Magn Reason in Med Sci. 2015;14:235-42
- Takahashi J, Machida Y, Aoba M, et.al. Noise power spectrum in compressed sensing magnetic resonance imaging. Radiol Phys Technol. 2017;10:161-70
- Nasada, R. et al. Noise Powe Spectrum and Modulation Transfer Function in Deep Learning Based Reconstruction Method. Proc. Intl. Soc. Mag Reson. Med. 2022; 30, 5073.
Figures