5159
Study on 2 Channel Application of Microscopy Coil Using Self-made Phantom1Radiology, Seoul National University Bundang Hospital, Seongnam-si, Korea, Republic of
Synopsis
Motivation: Microscopy coil has high spatial resolution and SNR, but it has a limited effective Signal Intensity(SI) range.
Goal(s): This study suggests a method to improve SI & effective SI range by various combinations of Microscopy Coil.
Approach: We made a MRI Marker Phantom and analyzed SI using Microscopy Coil with 1channel (23mm, 47mm), 2channel (23+47mm, 23+23mm, 47+47mm). We measured effective SI range and SI.
Results: In the results, SI of 2channel was higher than that of 1channel in all 12 ROI. Furthermore, change of changing of sense factor showed no significant change. Effective SI range was 47+47mm, 23+47mm, 47mm, 23+23mm, 23mm coil respectively.
Impact: Various combinations of Microscopy 2channel Coil had advantage of increasing Signal Intensity(SI) and effective SI range compared to 1channel. Also use of sense factor in 2channel can reduce scan duration without SI change for patients who have difficulty in cooperating.
INTRODUCTION
The use of microscopy coil for small lesions provides better spatial resolution and SNR compare to conventional surface coil.[1,2,3] It is widely used to evaluate not only small tumors, but also small joints, fractures, cartilage, and ligaments.[4,5] However, microscopy coil can only be applied to small lesions that match the diameter, and Signal Intensity(SI) drop-off increases with distance from the coil, resulting in diminished image uniformity.[6] Therefore, in this study, we would like to present a method to increase SI and image uniformity through various combinations of microscopy coil using our self-made phantom.MATERIALS and METHODS
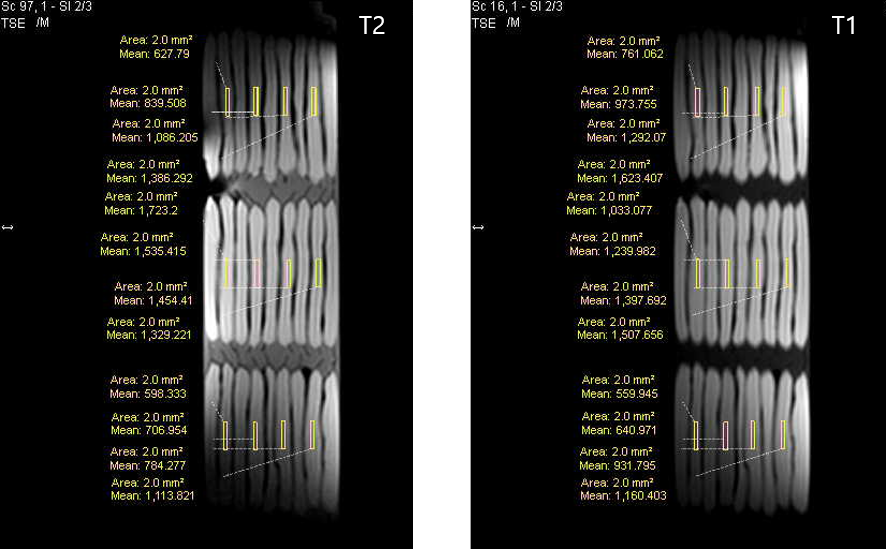
We made a phantom using MRI marker (MR-SPOT Packets, Beekley Medical) that shows high SI in both T2 and T1 sequences. Also, utilized 20cc syringe that was similar in size to an average adult finger and toe. The equipment used in study was Philips Elition 3.0T. 23mm, 47mm microscopy coils were placed in the center of the self-made Phantom. We used 1channel (23mm, 47mm) and 2channel (23+47mm, 23+23mm, 47+47mm) microscopy coils. [Fig.1] We then obtained T2 and T1 Sagittal scan data. In addition, using sense algorism that is activated only in 2channel, T2 and T1 Sagittal data were acquisitioned by changing Sense Factor to 1, 1.5, 2 with combination of 23mm+47mm, 23mm+23mm, 47mm+47mm Coils. All data were measured repeatedly 5times. 12Region of Interest(ROI) were placed; 4 ROI were equally placed along 3 rows and each ROI was a 2.0㎟ rectangle. [Fig.2] ROI was set in the same area of the image for each coil, and the average and standard deviation of the SI were calculated. SI by coil changes statistical analyses were conducted using one-way ANOVA and Dunnett T3 post-hoc tests.(SPSS v.21) SI by Sense Factor changes were calculated in percent based on inactivation of sense algorithm.RESULTS
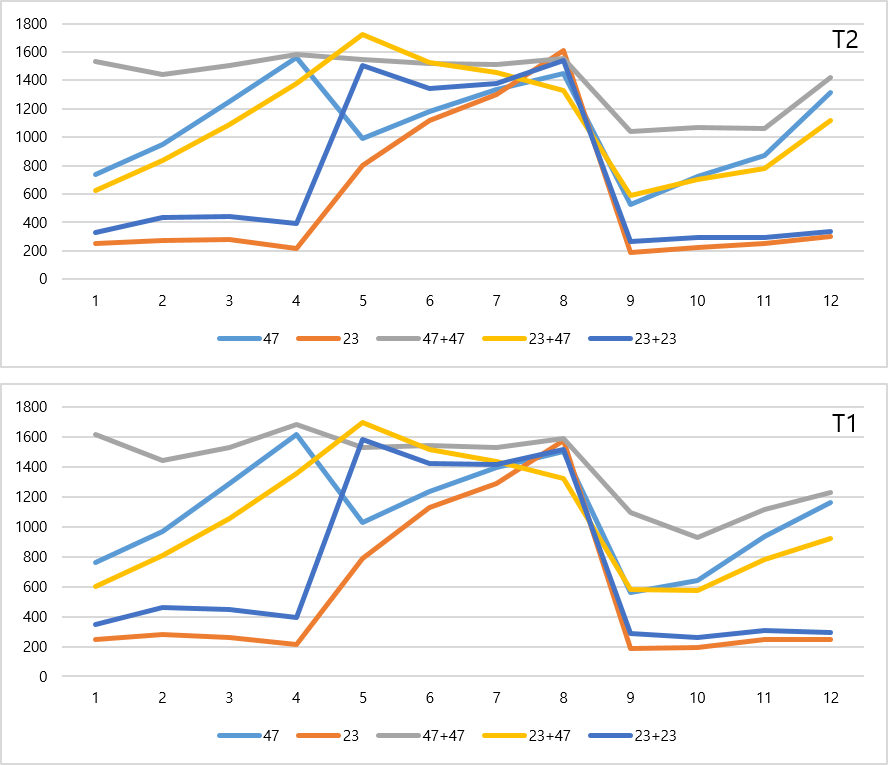
As a result of one-way ANOVA, p-value for T2 and T1 were 0.012 and 0.003, respectively, confirming heteroscedasticity rather than equal variance. As a result of performing a homogeneity test on the average of T2 and T1, both Welch and Brown-Forsythe confirmed that there was a significant difference in SI by coil changes with p-value of 0.000. In the Dunnett T3 post hoc analysis, p-value between all coils of T2 and T1 was 0.000. SI was compared as a percentage with the average SI according to the combination of 2channel based on the use of 1channel. When using 47+47mm 2channel in T2 image, high SI was achieved in all ROI with a minimum of 107.47% and a maximum of 207.20% compared to 47mm 1channel. When using 23+23mm 2channel, the minimum value was 95.7% and maximum 188.16% higher than 23mm 1channel. Only one ROI slightly decreased to 95.7%, and all other ROI showed high SI. When using 23+23mm 2channel, the minimum value was 95.7% and maximum 188.16% higher than 23mm 1channel. Only one ROI slightly decreased to 95.7%, and all other ROI showed high SI. In T1 images, when using 47+47mm 2channel, SI was high in all ROI, with a minimum of 103.85% and a maximum of 212.56% compared to 47mm 1channel. When using 23+23mm 2channel, the minimum value was 96.19% and maximum 200.51% higher than 23mm 1channel. Only one ROI slightly decreased to 96.19%, but all other ROI showed high SI. The average T2 and T1 of 12ROI for each coil are shown in graphs. [Fig.3] As a result of comparing the average value of SI by the changes in sense factor (1, 1.5, 2) as a percentage in 12 ROI without sense algorithm, which is only possible when applied to 2channel, the minimum is 95.97%, the maximum is 102.69% in T2. In T1, the minimum was 94.01% and the maximum was 105.48%. Effectives SI range was set to window width 2000 and level 1000 after T2, T1 color mapping of original images for each coil, and the effective SI was determined based on the value of 1000 window level. As a result of identifying the ranges occupied by yellow, orange, and red in color map, the effective SI range was the same for T2 and T1, as the order of 47+47mm, 23+47mm, 47mm, 23+23mm, 23mm coil. [Fig.4][Fig.5]CONCLUSION
In this study, we found that using Microscopy 2channel Coil has the advantage of increasing SI and effective SI range compared to 1channel, and that there was no significant change in SI when applied sense factor. In conclusion, it is possible to broaden SI improvement by various combinations of 2channel. Moreover, the use of sense factor can reduce scan duration which will be useful for patients who are difficult to cooperate.Acknowledgements
Thank you to my hospital colleagues and family (wife and three daughters) for support and love.
References
[1] Yoshioka H, Ueno T, Tanaka T, et al. High-resolution MR imaging of triangular fibrocartilage complex (TFCC): comparison of microscopy coils and a conventional small surface coil. Skeletal Radiol. 2003;32(10):575-581.
[2] Yoshioka H, Tanaka T, Ueno T, et al. High-resolution MR imaging of the proximal zone of the lunotriquetral ligament with a microscopy coil. Skeletal Radiol. 2006;35:288–294.
[3] Nakayama‐Takeda R, Sakakibara S, Kurokawa M, et al. Comparison of Malignant Skin Tumor Thickness and Relative Depth of Invasion Estimates from Preoperative MR‐Microscopy and Pathological Evaluation. Dermatologic surgery. 2013;39(12):1767-1773.
[4] Wiener E, Kolk A, Neff A, et al. Evaluation of reconstructed orbital wall fractures: high-resolution MRI using a microscopy surface coil versus 16-slice MSCT. Eur Radiol. 2005;15:1250–1255.
[5] Kim HJ, Lee SH, Kang CH, et al. Evaluation of the chondromalacia patella using a microscopy coil: Comparison of the two-dimensional fast spin echo techniques and the three-dimensional fast field echo techniques. Korean Journal of Radiology. 2011;12(1):78-88.
[6] Lee IS, Choi JA, Oh JH, et al. Microscopy Coil for Preoperative MRI of Small Soft-Tissue Masses of the Hand and Foot: Comparison with Conventional Surface Coil. AJR. 2008;191:256–263.
Figures
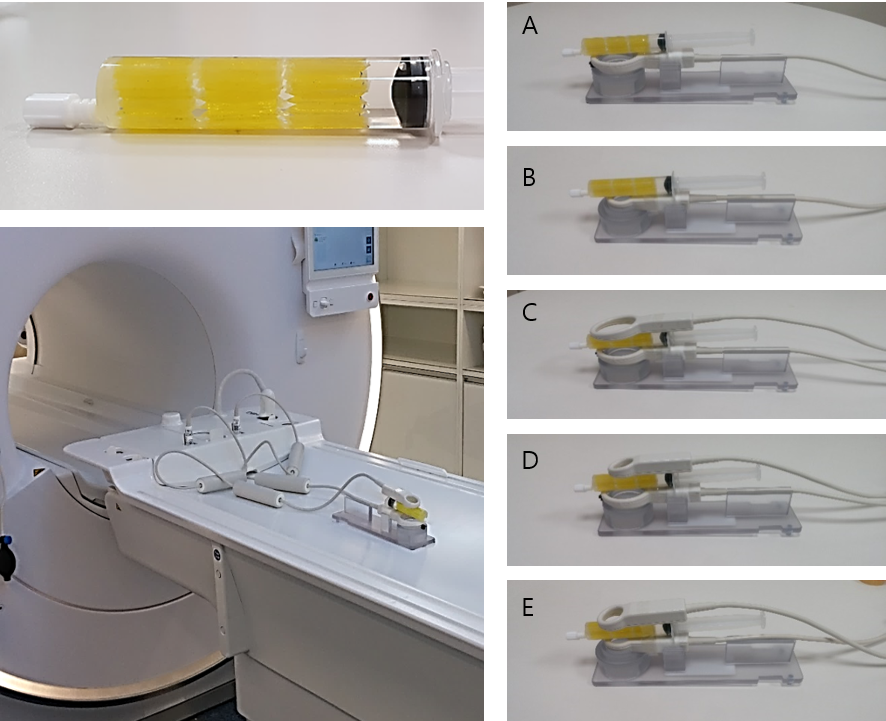
Self-made MRI Marker phantom & Location of 1 Channel, 2 Channel Microcopy Coil
(A) 47mm (B) 23mm (C) 47+47mm (D) 23+47mm (E) 23+23mm
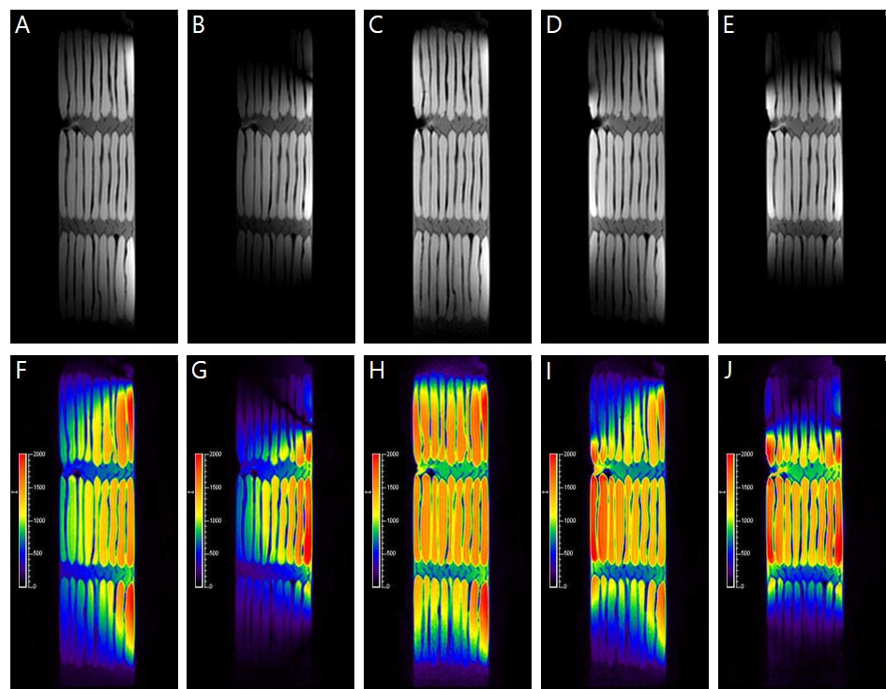
Signal Intensity(SI) Gray scale & color mapping of T2
(A),(F) 47mm (B),(G) 23mm (C),(H) 47+47mm (D),(I)23+47mm (E),(J) 23+23mm
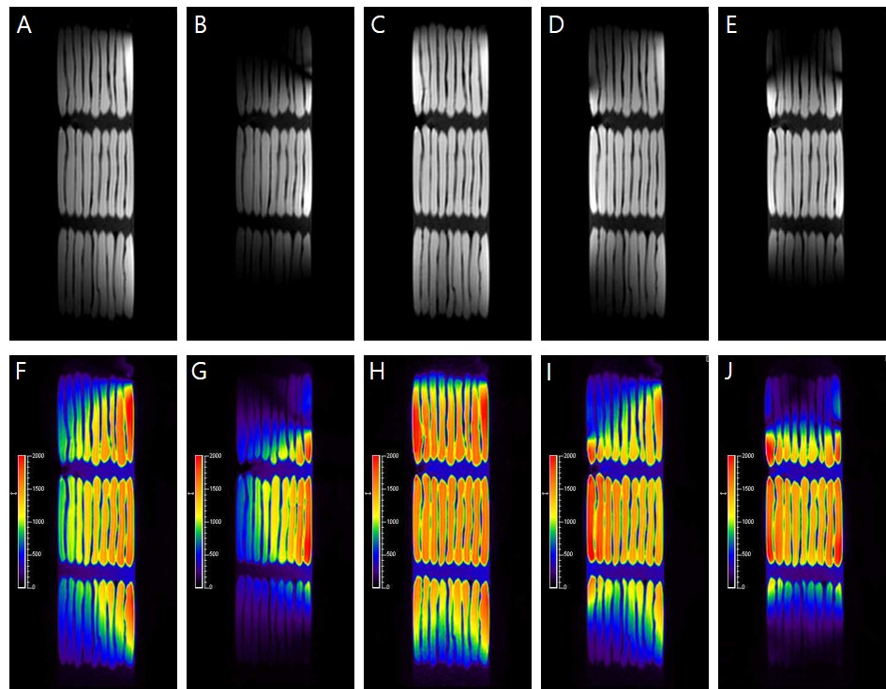
Signal Intensity(SI) Gray scale & color mapping of T1
(A),(F) 47mm (B),(G) 23mm (C),(H) 47+47mm (D),(I)23+47mm (E),(J) 23+23mm