5158
Correlation between quantitative software analysis-based white matter hyperintensity volume on FLAIR image and cognitive impairment1Department of diagnostic imaging, Institute of Brain and Blood Vessels Mihara Memorial Hospital, Isesaki, Japan, 2Graduate School of Radiological Technology, Gunma Prefectural College of Health Sciences, Maebashi, Japan, 3Department of Radiological Technology, Gunma Prefectural College of Health Sciences, Maebashi, Japan, 4Department of Neurology, Institute of Brain and Blood Vessels Mihara Memorial Hospital, Isesaki, Japan
Synopsis
Motivation: Acquiring new knowledge about the clinical significance of white matter hyperintensity (WMH) is important.
Goal(s): This study aimed to investigate the relationship between WMH volume and cognitive impairment.
Approach: Patients information (sex, age, education level), neuropsychological examinations (Mini-Mental State Examination and the Japanese version of Montreal Cognitive Assessment), and FLAIR images were retrospectively examined as clinical data. WMH volume was analyzed from FLAIR images with fully automated analysis software. The relationship between WMH volume and clinical data was investigated.
Results: WMH volume significantly differed according to education level, and that WMH volume was associated with neuropsychological examinations.
Impact: The white matter hyperintensity volume obtained from fluid-attenuated inversion recovery images using a fully automated white matter signal analysis software could provide important clinical information about cognitive impairment in patients.
Background
White matter hyperintensity (WMH) appears as a clear and high-intensity area on fluid-attenuated inversion recovery (FLAIR) images. Recently, WMH has been reported to be associated with Alzheimer's disease, cerebrovascular dementia, and cognitive decline, although the clinical significance of WMH remains unclear [1-7]. Previous studies have reported a strong relationship between the presence of WMH and cognitive dysfunction, comparing WMH volumes with patients' clinical information [8-10]. However, most of those studies used semi-automated methods of FLAIR imaging for WMH segmentation. Moreover, few studies have compared and evaluated WMH volume with neuropsychological examinations. Therefore, this study aimed to clarify the relationship between WMH volume using a fully automated analysis software and cognitive impairment, and to elucidate novel findings on the clinical significance of WMH.Methods
Patients with suspected cognitive impairment at our institution were retrospectively examined. Patients information (sex, age, education level), neuropsychological examinations (Mini-Mental State Examination (MMSE), Japanese version of Montreal Cognitive Assessment (MoCA-J)), and FLAIR images were collected as clinical data. WMH volumes were analyzed from FLAIR images using fully automatic analysis software for research (Fujifilm Healthcare Corporation, Tokyo, Japan), and the relationship with each clinical data was examined. Mann-Whitney U test was used to investigate the association between patients’ sex and WMH volume. Pearson's product-moment correlation coefficient test was used to investigate the association between WMH volume and age. The Kruskal-Wallis analysis and post hoc pairwise comparisons were used to evaluate differences in mean WMH volume based on patients’ education level. Pearson's product-moment correlation coefficient test was used to investigate the association between WMH volume and MMSE, and MoCA-J. Patients were categorized into groups based on the MMSE and MoCA-J cut-off scores. MMSE scores ≤23 were classified as suspected dementia; scores 24–27, as mild cognitive impairment (MCI); and scores 28–30, as normal, and were evaluated by Kruskal-Wallis test and post-hoc pairwise comparisons. MoCA-J scores ≤25 were classified as MCI and scores 26–30, as normal, and were evaluated by Mann-Whitney U test.Results
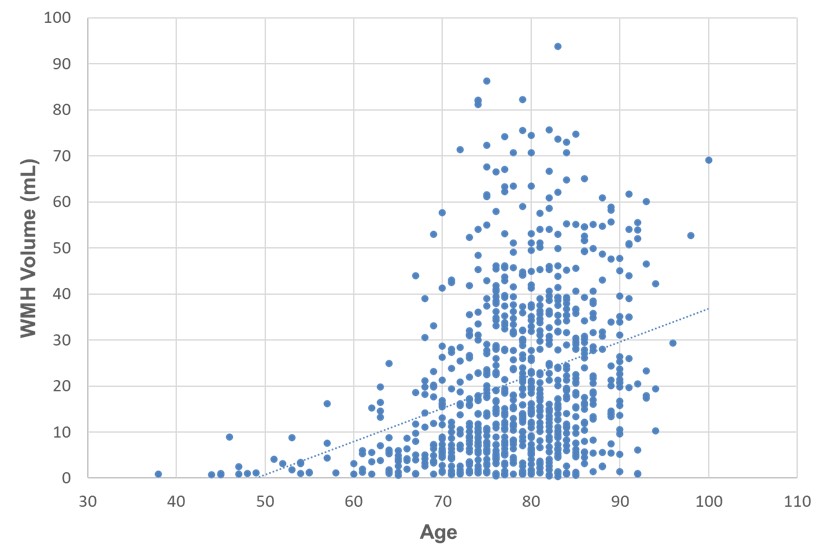
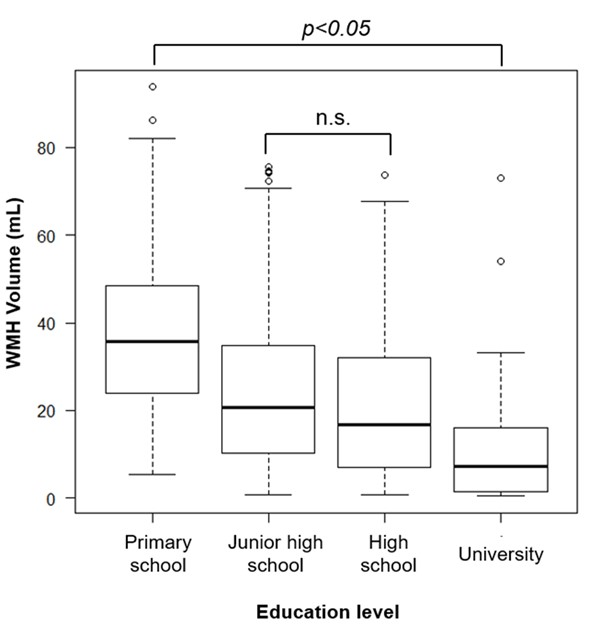
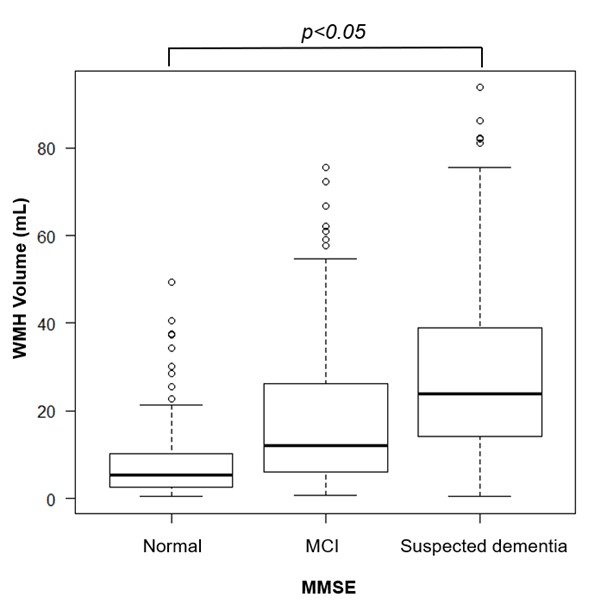
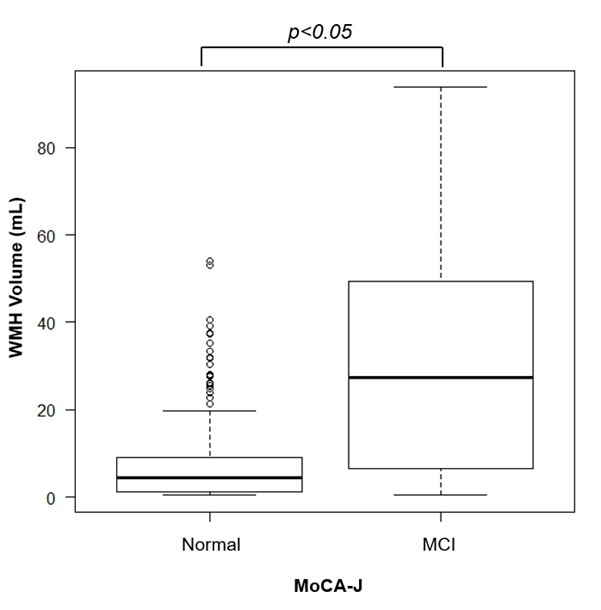
WMH volume was analyzed from 889 FLAIR images. The mean (standard deviation) WMH volume was 20.87 (18.21) ml. The maximum WMH volume measured was 93.75 ml, minimum was 0.38 ml, and median value was 15.72 ml. Figure 1 illustrates the comparison of the mean WMH volumes between sexes of the patients. The mean WMH volume did not significantly differ based on sex. Figure 2 illustrates the results of Pearson's product-moment correlation coefficient test between WMH volume and the age of the patients. The WMH volume showed a significant positive correlation with age (R=0.45, p<0.01). Figure 3 shows the comparison of mean WMH volumes between education level using a multiple comparison test. Multiple comparison test showed that there was no significant difference in the mean WMH volume between junior high school and high school graduates, but all other differences were significant (p < 0.05). We observed a negative correlation between WMH volume and MMSE (R=-0.52, p<0.01). Figure 4 illustrates the comparison of mean WMH volumes between each group of classified MMSE using a multiple comparison test. Multiple comparison tests revealed significant differences in the mean WMH volume among all groups (p<0.05). We observed a negative correlation between WMH volume and MoCA-J (R=-0.68, p<0.01). Figure 5 illustrates the comparison of mean WMH volumes between the two groups of classified MoCA-J. There was a significant difference in the mean WMH volume between the two groups (p < 0.05).Conclusions
This study revealed a positive correlation between patients’ age and WMH volume (as reported in previous studies [8-11]), suggesting that aging can have a significant impact on the WMH volume. The WMH volumes significantly differed according to education level, and was Lower education level , such as primary school graduate was the higher. Therefore, it is possible that there is a close relationship between education level and the amount of WMH volume. In the comparison of WMH volume and MMSE, the mean WMH volume was higher in the suspected dementia group. The mean WMH volume was also higher in the MCI group in the comparison of WMH volume and MoCA-J. These results suggest that quantitative analysis of WMH volume is relevant to neuropsychological examinations, the larger the WMH volume, the more likely the patient was to have MCI or suspected dementia. Therefore, we concluded that the quantitative analysis of WMH volumes from FLAIR images using a fully automated analysis software has the potential to impart useful information in cognitive impairment clinical.Acknowledgements
We gratefully acknowledge support of Fujifilm Healthcare Corporation for lending us the automatic white matter signal analysis software for research free of charge.
References
1. Fazekas F, Chawluk JB, Alavi A, et al. MR signal abnormalities at 1.5 T in Alzheimerʼs dementia and normal aging. AJR Am J Roentgenol 1987;149:351-356.
2. Black S, Gao F, Bilbao J. Understanding white matter disease: imaging-pathological correlations in vascular cognitive impairment. Stroke 2009;40 Supplement:S48-52.
3. Henneman WJ, Sluimer JD, Cordonnier C, et al. MRI biomarkers of vascular damage and atrophy predicting mortality in a memory clinic population. Stroke 2009;40:492-498.
4. De Groot JC, De Leeuw FE, Oudkerk M, et al. Periventricular cerebral white matter lesions predict rate of cognitive decline. Ann Neurol 2002;52:335-341.
5. Sachdev PS, Thalamuthu A, Mather KA, et al. White matter hyperintensities are under strong genetic influence. Stroke 2016;47:1422-1428.
6. Kertesz A, Black SE, Tokar G, et al. Periventricular and subcortical hyperintensities on magnetic resonance imaging: ‘Rims, caps, and unidentified bright objects’. Arch Neurol 1988;45:404-408.
7. Debette S, Markus HS. The clinical importance of white matter hyperintensities on brain magnetic resonance imaging: systematic review and metaanalysis. BMJ 2010;341:c3666.
8. H Koga, T Yuzuriha, H Yao : Quantitative MRI findings and cognitive impairment among community dwelling elderly subjects. J Neurol Neurosurg Psychiatry 2002;72:737–741.
9. Rhoda Au, Joseph M. Massaro, Philip A. Wolf, et al: Association of White Matter Hyperintensity Volume with Decreased Cognitive Functioning. Arch Neurol 63(2): 246-250, 2006.
10. Torgil Riise Vangberg, Live Eikenes, Asta K. Håberg: The effect of white matter hyperintensities on regional brain volumes and white matter microstructure, a population-based study in HUNT. NeuroImage 203: 1-16, 2019.
11. Vernooij MW, Ikram MA, Tanghe HL, et al: Incidental findings on brain MRI in the general population. N Engl J Med 357:1821–1828, 2007.
Figures
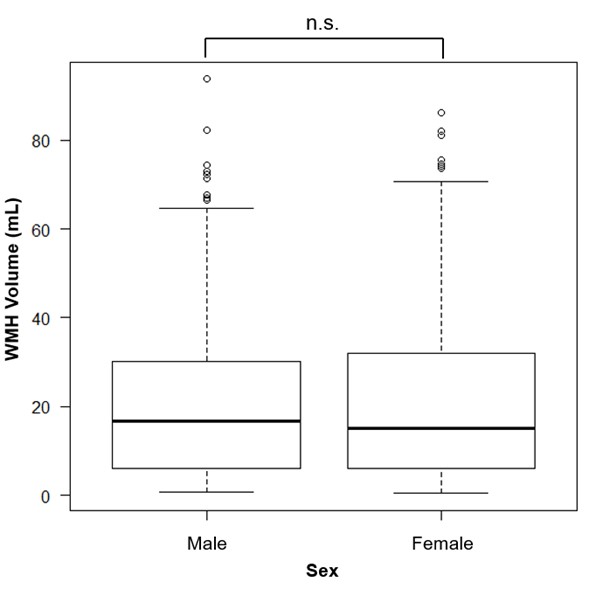
Figure 1. Comparison of mean WMH volumes based on the patients’ sex Of the 889 patients, 399 were male and 490 were female. The mean (standard deviation [SD]), maximum, minimum, and median WMH volumes in the male patients were 21.33 (18.30), 93.75, 0.77, and 16.77 ml respectively, whereas those in the female patients were 20.52 (18.14), 86.22, 0.38, and 15.15 ml, respectively, with no significant differences in mean WMH volume based on sex.