5148
Comparative Assessment of Deep Learning (DL) for Femoral Cartilage Thickness in Healthy Controls: A Study on 0.55T vs 3.0T MRI Scanners.1Radiology and Biomedical Imaging, University of California San Francisco, San Francisco, CA, United States
Synopsis
Keywords:
Motivation: Prior knee osteoarthritis studies favor high-field (3.0T) over mid-field (0.55T) MRI. Motivation is explore sustainable, economical, low-footprint 0.55T alternative.
Goal(s): To address the research gap, this study aims to compare cartilage thickness measurements in healthy controls between 0.55T and 3.0T MRI scanners, shedding light on the viability of mid-field imaging for assessing this vital biomarker.
Approach: Employing a cross-sectional design, this research utilizes both 0.55T and 3.0T scanners to gather comparative data on cartilage thickness in healthy subjects.
Results: Anticipated findings will contribute insights into the potential of mid-field MRI for accurate cartilage assessment, informing future imaging practices in knee osteoarthritis research.
Impact: This project's focus on mid-field MRI scanners may revolutionize knee osteoarthritis research, providing a cost-effective alternative, broadening accessibility, and potentially improving early diagnosis and treatment outcomes for patients.
Background
Osteoarthritis (OA) is a debilitating joint disorder characterized by intricate biochemical and structural transformations affecting articular cartilage, bones, ligaments, and muscles. Clinical investigations employing MRI have validated the concurrent and predictive value of cartilage thickness (1) and volume alterations as reliable biomarkers for knee osteoarthritis in human subjects, especially at 3.0T. Recently, mid-field (0.55T) MRI scanners with novel technical developments have been used in clinical practice (2). The 0.55T MRI scanners are particularly useful in terms of low-footprint, sustainability, and for being economically optimal. However, cartilage thickness as a biomarker, has not been much explored at 0.55T MRI scanners. In this abstract, we employ a fully automated method for the segmentation and measurement of patella cartilage thickness in seven healthy volunteers. This study seeks to bridge this gap by investigating the measures of cartilage thickness of healthy controls at 0.55T and comparing them with 3.0T findings.Methods
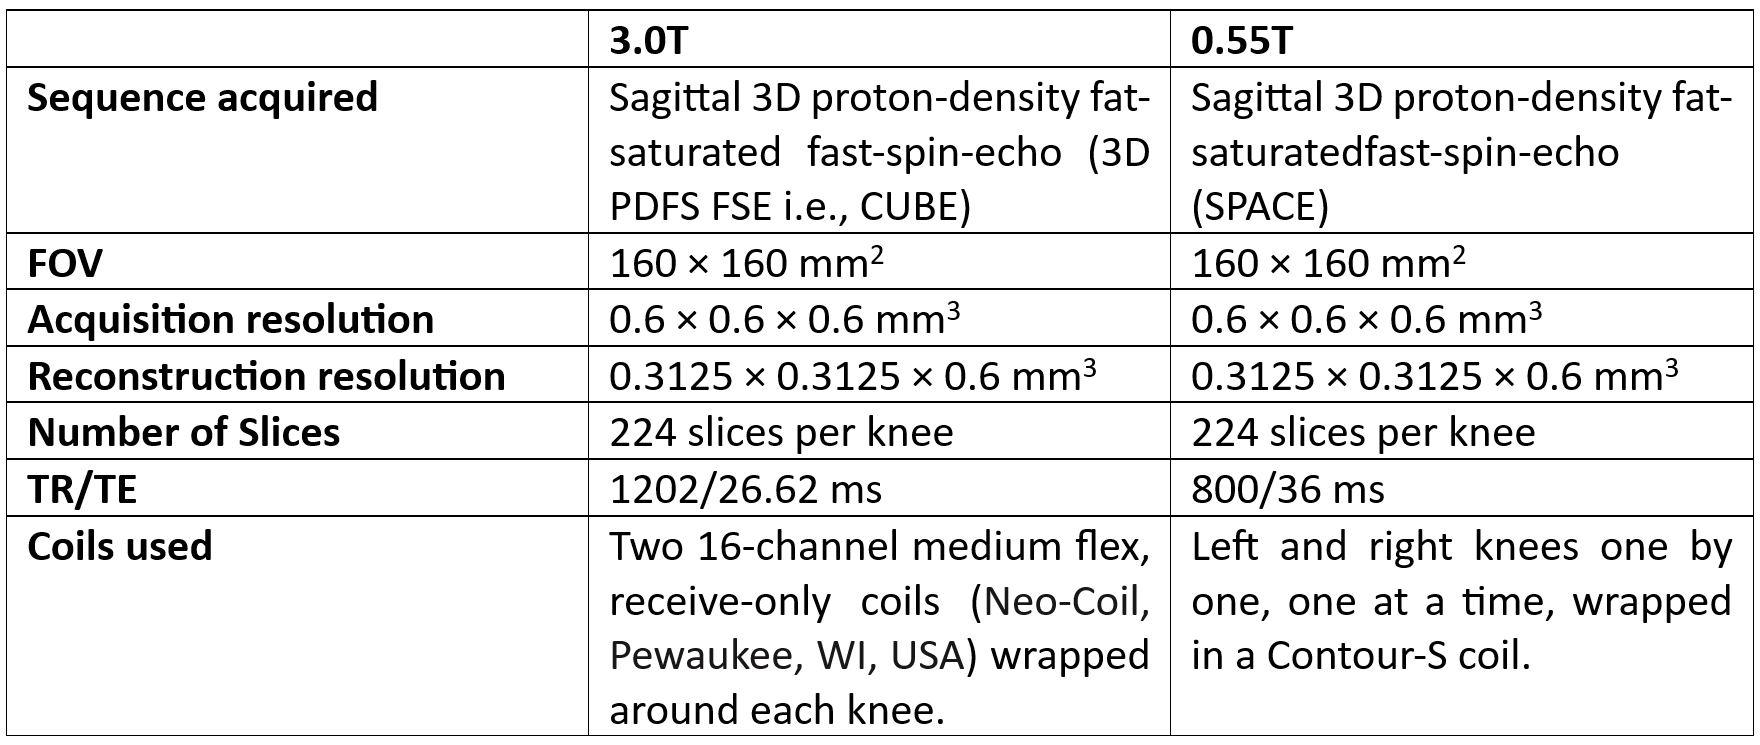
In this ongoing prospective study, approved by the local Institutional Review Board (IRB), a cohort of seven healthy control subjects (Age: 29.57 ± 5.25 years, BMI: 23.47 ± 2.74, 3 females), were recruited for simultaneous bilateral knee acquisitions on two MRI scanners. All the participants underwent two consecutive MRI scans on a 3.0T GE-Signa Premier scanner (GE Healthcare, Waukesha, WI USA) as well as on a 0.55T (Magnetom Free. Max, Siemens Healthineers, Erlangen, Germany). The subjects were given an hour of rest between undergoing both of these scans on the same day. Details of the scans are provided in the following Table 1. Both the 3.0T GE and 0.55T Siemens 3D fast spin echo (FSE) with fat saturation images underwent a deep-learning (DL) based 3D V-Net architecture (3) to segment the femoral cartilage and compute the precise cartilage thickness values (1).Results
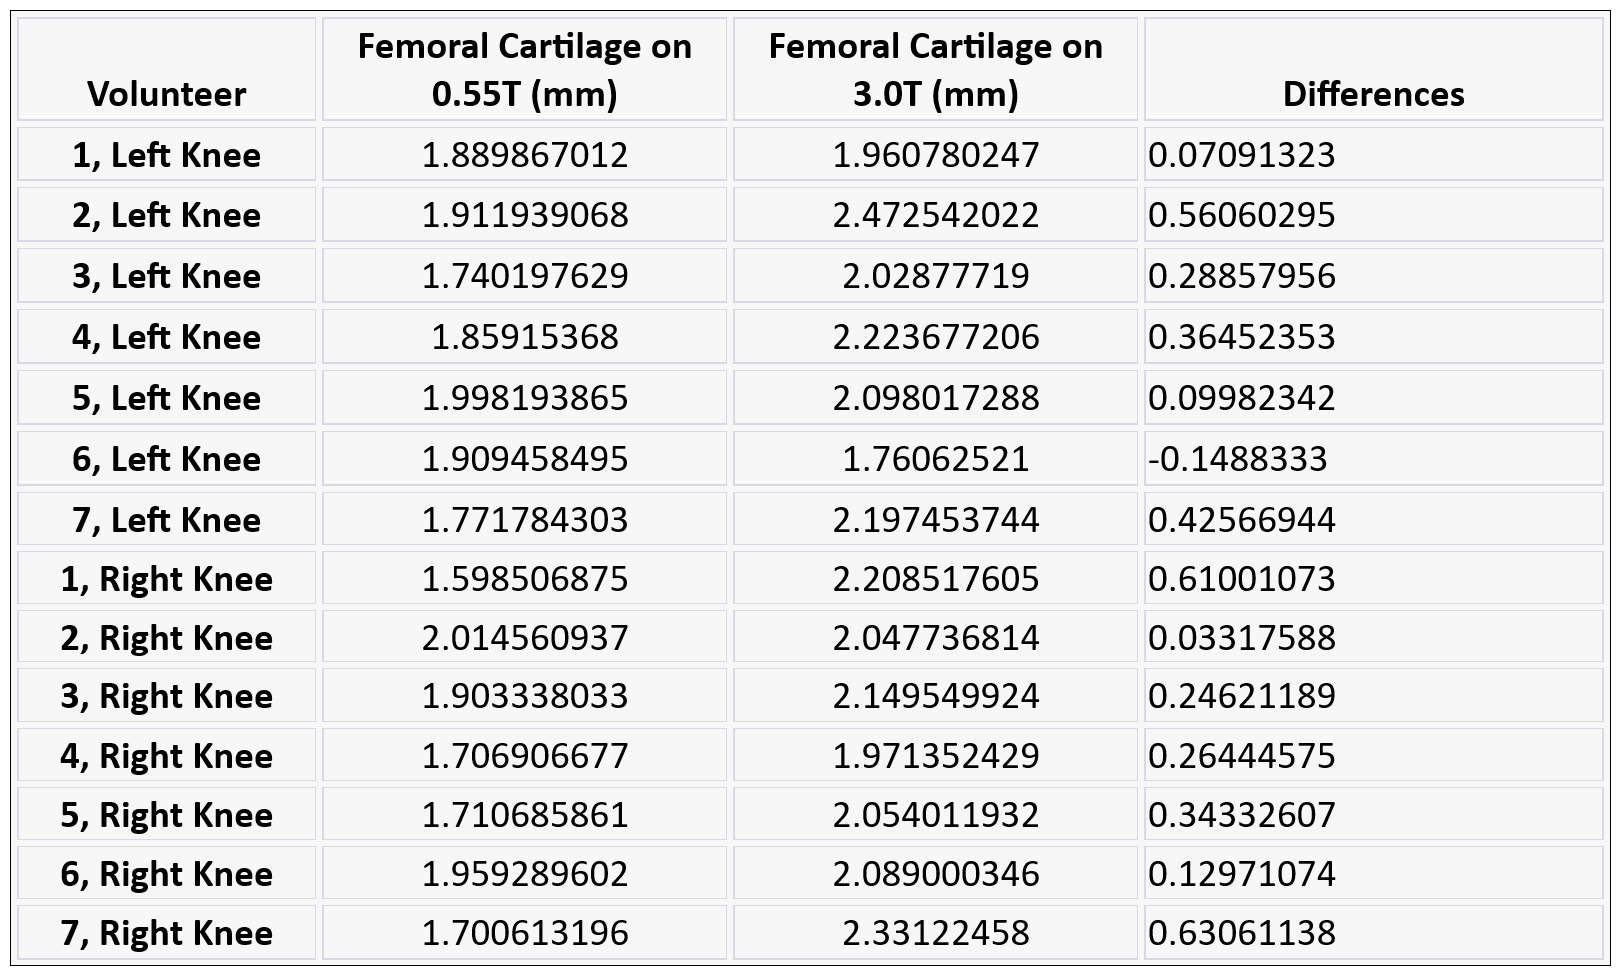
Detailed information for each of the seven healthy controls can be found in Table 2. Upon comparing cartilage thickness measurements between 3 Tesla and 0.55 Tesla MRI scanners, our analysis reveals consistent results. The automated cartilage segmentation method demonstrates strong agreement with measurements obtained from both field strengths. The additional advantages of utilizing a 0.55 Tesla scanner in comparison to a 3 Tesla scanner include lower costs, wider bore size, reduced specific absorption rate (SAR), diminished helium requirements, and the absence of a quench pipe. The 0.55T scanners have higher flexibility to be installed at extreme geographical conditions due to lower footprints. In future, with this established comparison of healthy controls, this technique can be further extended to compare the cartilage thickness values of OA patients.Conclusion
Initial results demonstrate a usable to good technical feasibility of translating existing quantitative deep-learning-based cartilage thickness computation techniques, from 3.0T to 0.55T for knee MRI. This could be utilized at the far-spread point-of-care locations with a lack of radiologists available to manually segment or calculate cartilage thickness from low-field images.Acknowledgements
Many thanks to Roya Habibi for her invaluable assistance in this abstract.References
- Iriondo C, Liu F, Calivà F, Kamat S, Majumdar S, Pedoia V: Towards understanding mechanistic subgroups of osteoarthritis: 8-year cartilage thickness trajectory analysis. J Orthop Res 2021; 39:1305–1317.
- Lopez Schmidt I, Haag N, Shahzadi I, et al.: Diagnostic Image Quality of a Low-Field (0.55T) Knee MRI Protocol Using Deep Learning Image Reconstruction Compared with a Standard (1.5T) Knee MRI Protocol. J Clin Med 2023; 12:1916.
- Astuto B, Flament I, Namiri NK, et al.: Automatic deep learning–assisted detection and grading of abnormalities in knee MRI studies. Radiol Artif Intell 2021; 3.
Figures
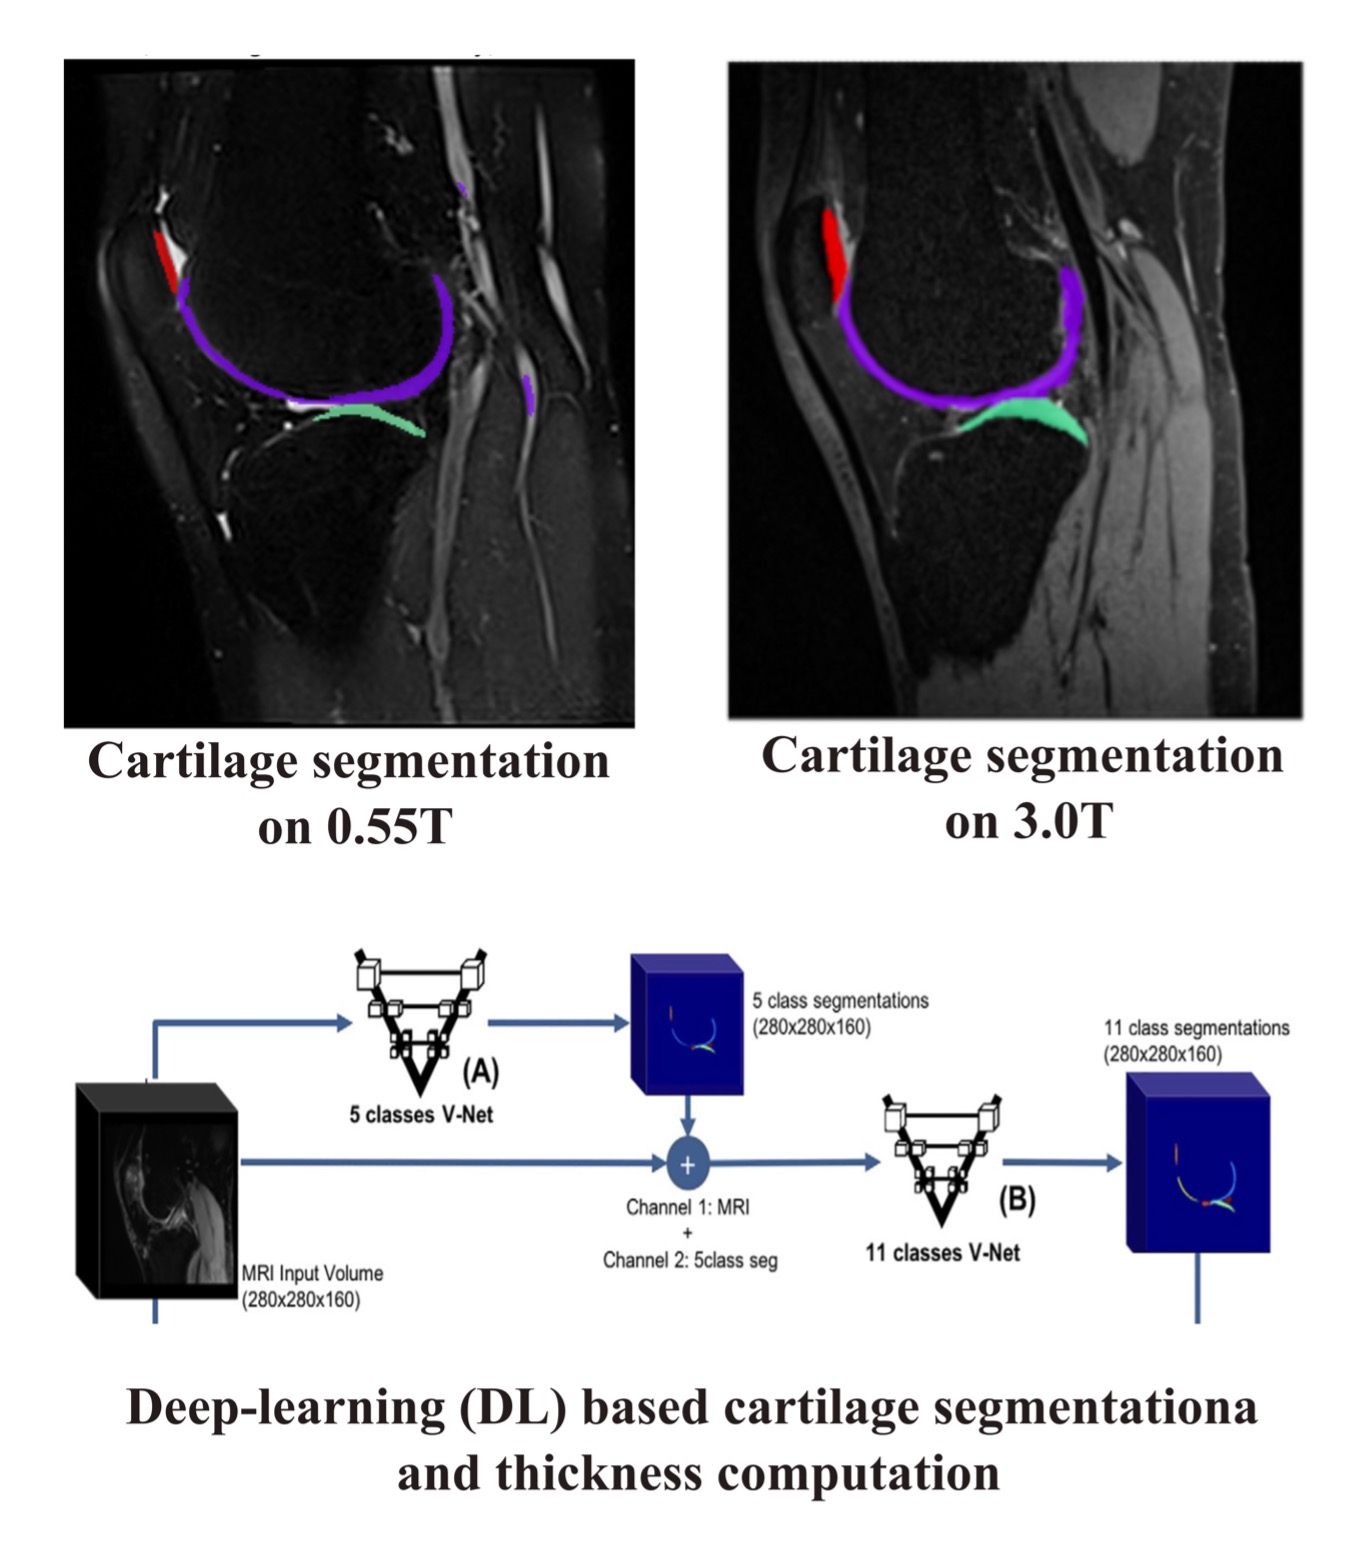
Figure 1: Deep-learning (DL) based cartilage segmentation and thickness comparison flowchart.