5138
The Hidden Challenge: Unraveling the Reliability of Pelvic Attenuation Maps in Simultaneous PET/MRI1School of Radiological Technology, Chulabhorn Royal Academy, Bangkok, Thailand, 2National Cyclotron and PET Centre, Chulabhorn Hospital, Bangkok, Thailand
Synopsis
Motivation: PET/MRI integrate functional and anatomical information, elevating diagnostic precision. However, a key challenge lies in ensuring the reliability of attenuation (µ) map generation.
Goal(s): This research assesses the accuracy of PET/MR-based µ-map from 3D-Dixon and 3D-Dixon Hires T1W in comparison to a standard µ-map from PET/CT at the voxel level.
Approach: the µ-map data from 15 patients who underwent both PET/CT and PET/MRI of the pelvic region were analyzed to quantify the disparities in the generated µ-maps.
Results: We found that 3D-Dixon Hires outperforms the 3D-Dixon in the creation of µ-maps, rendering it a superior choice for precise attenuation correction.
Impact: Spatial resolution influences the accuracy of attenuation correction in PET/MRI, particularly when employing quantitative methods for diagnosis. Notably, the utilization of higher-resolution Dixon MRI images enhances the reliability of attenuation in tissue compartmental models for the generation of this map.
INTRODUCTION
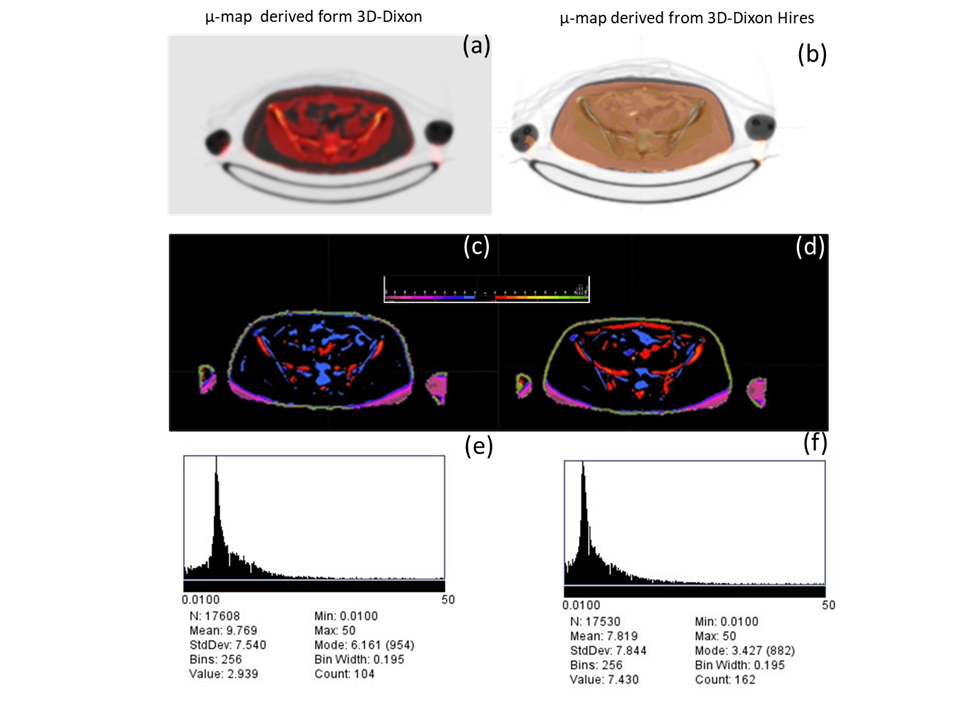
Hybrid Positron Emission Tomography/Magnetic Resonance Imaging (PET/MRI) offers simultaneous molecular functional insights and anatomical data, enhancing diagnostic accuracy. Nevertheless, the integration of attenuation correction in PET/MRI represents a formidable challenge1. This challenge necessitates the generation of an attenuation map (µ-map) utilizing specialized techniques. The limitations associated with this process result in imprecise radiotracer uptake values within tissues, underscoring the importance of verifying the accuracy of the µ-map2. Hence, this investigation seeks to compare µ-map images derived from PET/MR utilizing 3-dimensional-Dixon spoiled-GRE T1W sequence (3D-Dixon) and 3-dimensional Dixon high-resolution spoiled-GRE T1W sequence (3D-Dixon Hires) with the reference µ-map images obtained through PET/CT at the pixel level. This is to scrutinize disparities in µ-map acquisition between these two imaging modalities.METHODS
This retrospective study utilized image data from 15 patients who underwent both whole-body 18F-FDG PET/CT and whole pelvis 18F-FDG PET/MRI on the same day. For the PET/CT , 18F-FDG PET data were acquired following intravenous injection of 2.59 MBq/kg of 18F-FDG. The PET/CT scan was conducted using a 64-slice Siemens/Biograph Vision Scanner, approximately 60 minutes post-injection from the vertex to the proximal thighs for attenuation correction and structural imaging. A 3D-emission scan of the same region was obtained with continuous bed motion over a 10-minute duration. The reconstruction parameters for attenuation correction included the use of ultra-HD PET with two iterations and five subsets, an image size of 440 × 440, all-pass filters, and a zoom factor of 1. PET data were reconstructed into whole-body static images. CT-based µ-map was generated using bilinear transformation.For the PET/MRI, a 3D-Dixon sequence was acquired to produce opposed phase, in-phase, water-only, and fat-only images in coronal plane. A acceleration factor (PAT factor) of 5 was utilized, with an acquisition time of 8.4 seconds and a field of view (FOV) of 500 mm x 400 mm. The reconstructed voxel size was 2.6 x 2.6 x 3.12 mm. The µ-map for PET/MRI was generated using a 5-compartment tissue model, which included representations of air, water, lung, adaptive bone, and fat. In addition, 3D-Dixon Hires images were acquired and reconstructed into four different volumes as the previous sequence, in transverse plane. A PAT factor of 5 was applied, with an acquisition time of 9.6 seconds and a FOV measuring 500 mm x 265.5 mm. The reconstructed voxel size was 1.30 x 1.30 x 2.02 mm. The µ-map for PET/MRI was derived using the same method as the one used in 3D-DIXON.
To obtain mean absolute error (MAE), µ-maps were analyzed using MIM software for image rigid-registration between the CT- and MRI-based µ-maps of the pelvis. The quality of image registration was assessed through visual inspection. Subsequently, the registered images were used to compute voxel-based MAE and standard deviation (SD) using ImageJ software. Histogram thresholding was applied to MAE maps within the range of 0.01 to 50 (Figure 1 (e-f)) to exclude image background and artifact pixels from the calculation. Finally, the average MAE of both sequences was compared using a paired student t-test.
RESULTS
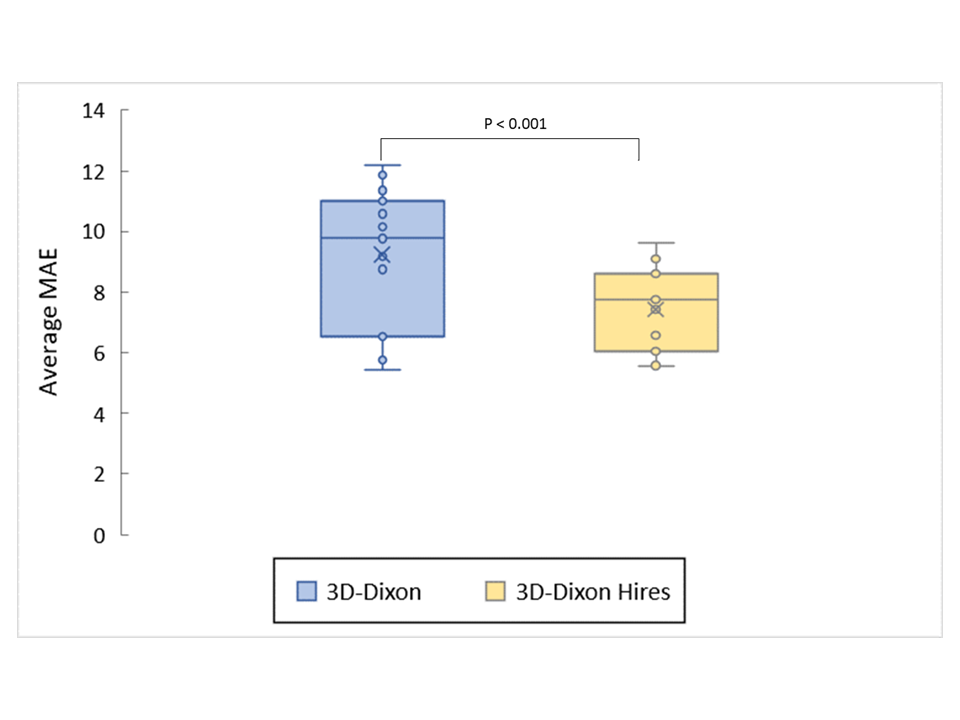
Of fifteen patients, average MAE ± SD of the μ-map derived from a standard CT and 3D-Dixon imaging was 9.232±2.287. In contrast, the μ-maps obtained from a standard CT and 3D-Dixon Hires exhibited an average MAE ± SD of 7.435±1.359. The average MAE from 3D-Dixon hires was significantly lower than that of μ-maps generated from CT and 3D-Dixon (p < 0.001), as illustrated in Figure 2.DISCUSSION
The µ-map derived from 3D-Dixon Hires was more closely aligned with the µ-map derived from CT images at the voxel level. This observation is likely attributed to the enhanced depiction of bone structures in the 3D-Dixon Hires image volume compared to the conventional 3D-Dixon approach, which aligns with the findings of Paulus et al. (2015)3. Their study reported that the use of model-based bone segmentation algorithm in Dixon imaging techniques improved the accuracy of MRI-based µ-maps. Our finding suggested that spatial resolution may result in improved reliability of MRI-based attenuation map. Further investigation is warranted, with an emphasis on expanding the sample size and PAT factor optimization to obtain more comprehensive insights.CONCLUSION
3D-Dixon Hires-based attenuation maps exhibited superior accuracy within the pelvic region at the pixel level, as compared to the standard 3D-Dixon approach. This improvement is evident from the substantially reduced mean absolute error and standard deviation values. Consequently, the 3D-Dixon Hires offers a viable approach for augmenting the precision of attenuation correction in this specific context.Acknowledgements
We would like to thank National Cyclotron and PET Centre, Chulabhorn Royal Academy, for research facility and data supports.References
REFERENCES:
1. Yankeelov TE, Peterson TE, Abramson RG, Garcia-Izquierdo D, Arlinghaus LR, Li X. ... & Gore JC. Simultaneous PET–MRI in oncology: a solution looking for a problem? Magnetic resonance imaging. 2012;30(9): 1342-1356.
2. Wagenknecht G, Kaiser HJ, Mottaghy FM, & Herzog H. MRI for attenuation correction in PET: methods and challenges. Magnetic resonance materials in physics, biology, and medicine.2013;26: 99-113
3. Paulus DH, Quick HH, Geppert C, Fenchel M, Zhan Y, Hermosillo G, et al. Whole-Body PET/MR Imaging: Quantitative Evaluation of a Novel Model-Based MR Attenuation Correction Method Including Bone. Journal of Nuclear Medicine. 2015;56(7):1061–6.
Figures