5121
Mapping cerebrovascular reactivity and vascular lag in gliomas with multi-echo BOLD fMRI and breath-holding1Basque Center of Cognition, Brain and Language, San Sebastian, Spain, 2BioCruces Research Institute, Bilbao, Spain
Synopsis
Keywords: Tumors (Pre-Treatment), Tumor, fMRI, Cerebrovascular reactivity, Multi-echo, Glioma
Motivation: Cerebrovascular reactivity (CVR) with BOLD fMRI during breath-holding offers a feasible technique for examining neurovascular alterations in tumor-affected regions. However, this examination may have reduced accuracy due to breath-hold-induced artifacts.
Goal(s): This study explores the use of multi-echo fMRI techniques to improve the accuracy and reliability of CVR mapping and vascular lag estimation in glioma patients.
Approach: We employed optimized ME-fMRI procedures in 21 patients with diverse glioma characteristics, including lagged regression analysis, nuisance modeling with ME-ICA.
Results: Our protocol robustly mapped reductions in CVR in all patients, and showed the vascular lag provides differential clinically valuable insights into tumor and peritumoral areas.
Impact: This work present a robust and feasible multi-echo fMRI protocol with breath-holds that enhances cerebrovascular reactivity (CVR) mapping by obtaining complementary vascular lag maps, which offer critical insights into vascular delay and vasodilatory dynamics in glioma patients
Introduction
Cerebrovascular reactivity (CVR) measures the brain's ability to regulate blood flow in response to changes in arterial CO2 levels [1]. A breath-holding (BH) task is a straightforward and self-induced manner to generate a vasoactive stimulus (i.e vasodilation) [2]. BH-induced CVR has provided clinically relevant information in patients with glioma to assess neurovascular uncoupling or delimit regions affected by the tumor [3,4]. However, motion and susceptibility artifacts due to BH can substantially diminish the quality of MR images, hence reducing the accuracy and reliability of CVR mapping. These challenges can be addressed by means of multi-echo (ME) fMRI pre-processing and denoising approaches [5]. Our study applies optimized ME-fMRI procedures in 21 patients with diverse glioma characteristics, including a lagged regression analysis and nuisance modeling with ME-Independent Component Analysis (ME-ICA) [5]. Our results revealed a decrease in the CVR, and an informative vascular lag as expected in most subjects. These maps provided clinically valuable information on tumor and peritumoral areas, delimiting the functional boundaries of the lesion, which could help during the neurosurgical planning to maximize the extent of resection.Methods
Patients: Twenty-one glioma patients (28-69 y.o.; 11 Female & 10 Male) with varying tumor characteristics (7 Astrocytoma Grade II-III, 5 Glioblastoma Grade IV, 4 Oligodendroglioma, 1 Pleomorphic Xanthoastrocytoma Grade II, 1 Polymorphous neuroepithelial Grade I, 3 Cavernoma) were scanned (3T Siemens PrismaFit scanner with a 64-channel head coil) during a breath holding (BH) task including 8 trials with expirations before and after the apnea [5,6]. MRI data acquisition: T1-w MPRAGE (pre- and post-Gd injection) and T2-w FLAIR images (voxel size=1 mm3). ME-fMRI data with T2*-weighted gradient-echo multi-echo sequence (TEs=10.6/28.69/46.78/84.87 ms, TR=1.5 s, 2.4 mm isotropic voxels, SMS=5, GRAPPA=2, 340 scans). Physiological data acquisition: Exhaled CO2 and O2 levels were recorded using a nasal cannula with an ADInstruments ML206 gas analyzer connected to a MP160 BIOPAC (sampling frequency = 40 Hz). PetCO2hrf signal generation: End-tidal CO2 peaks were manually identified using Peakdet [7], linearly interpolated (PetCO2 signal), convolved with the two gamma-variate canonical HRF and downsampled to TR (PetCO2hrf signal). ME-fMRI data preprocessing (AFNI): Motion realignment of the 1st echo to a single-band reference image and apply this transformation to the rest of echoes. ME-ICA denoising with TEDANA [8] and manual evaluation of BOLD-related (accepted) and noise-related (rejected) components with RICA [9]. Data analysis: CVR and vascular lag maps were obtained with a conservative lagged regression analysis [6] using phys2cvr [10], considering a lagged PetCO2 signal convolved with the canonical HRF (lag shifts=0.3s), the realignment parameters and their temporal derivatives, up to 4th-order Legendre polynomials, and the rejected ME-ICA time courses previously orthogonalized with respect to the lagged PetCO2hrf signal and the accepted ME-ICA time courses [6]. The bulk shift to compensate for the delay of the expired air between the brain and the gas analyser was estimated via cross-correlation between the PetCO2hrf signal and the average signal of non-tumor voxels.Results & Discussion
Table 1 provides a summary of the study sample and a qualitative description of the CVR and vascular delay maps. Six patients were excluded due to poor task performance, leaving fifteen subjects valid. All patients displayed significantly reduced CVR in tumor areas, with nine of them showing increased vascular lag in both glioma-affected and peritumoral areas, mainly in high-grade tumors. However, vascular delay maps in six subjects offered no or little information on tumor-affected areas.Two representative cases with a good task performance are shown in Figures 1 (Subject #64 with grade-III astrocytoma) and Figure 2 (Subject #56 with grade-IV glioblastoma). Both cases show the typical decrease in CVR in tumor-affected regions. Notably, the vascular lag maps reveal a larger delay within both tumor and peritumoral regions relative to healthy tissue. Figures 3 and 4 illustrate two cases with Oligodendroglioma. Subject #62 (Figure 3) with a good task performance shows reduced CVR map in tumor-affected areas, but the vascular delay map offered little information about pathological tissue. Subject #46 (Figure 4) did not perform the task correctly in three BH trials, resulting in poorly informative CVR and vascular lag maps.
In summary, our study highlights the potential of ME-fMRI during a feasible breath-holding task to generate clinically informative CVR and vascular delay maps, providing there is a good task performance. These maps can improve individualized diagnosis among glioma patients, which can assist neurosurgeons in identifying functional boundaries, planning neurosurgical procedures, and optimizing resection in individual patients. Additionally, these maps could potentially give useful information regarding the interpretation of activation and functional connectivity maps obtained with BOLD fMRI in the presence of a glioma.
Acknowledgements
References
[1] Chen J., & Fierstra J. (Eds.) (2022). Cerebrovascular Reactivity Methodological Advances and Clinical Applications. Humana Press.
[2] Pinto J, et al, (2020). Front Physiol, 11: 608475. https://doi.org/10.3389/fphys.2020.608475
[3] Iranmahboob, A., et al, (2015) J Neuroimaging 26(2): 232–239. https://doi.org/10.1111/jon.12278
[4] Pillai J., & Mikulis, D.J., 2015 AJNR Am J Neuroradiol. 36(1):7-13. https://doi.org/10.3174/ajnr.A3941
[5] Moia S, et al, (2021) NeuroImage, 233, 117914. https://doi.org/10.1016/j.neuroimage.2021.117914
[6] Bright, M. G. & Murphy, K. (2013). Neuroimage, 83, 559-568. https://doi.org/10.1016/j.neuroimage.2013.07.007
[7] Markello, R & DuPre, E. (2018). Peakdet [Computer software]. https://doi.org/10.5281/zenodo.7244954
[8] DuPre et al., (2021). TE-dependent analysis of multi-echo fMRI with tedana. Journal of Open Source Software, 6(66), 3669, https://doi.org/10.21105/joss.03669
[9] Uruñuela, E. (2021). Rica (Version v1.0.17) [Computer software]. https://doi.org/10.5281/zenodo.5788350
[10] Moia, S (2023). Phys2cvr (Version v.0.18.0) [Computer software]. https://doi.org/10.5281/zenodo.6461353
Figures
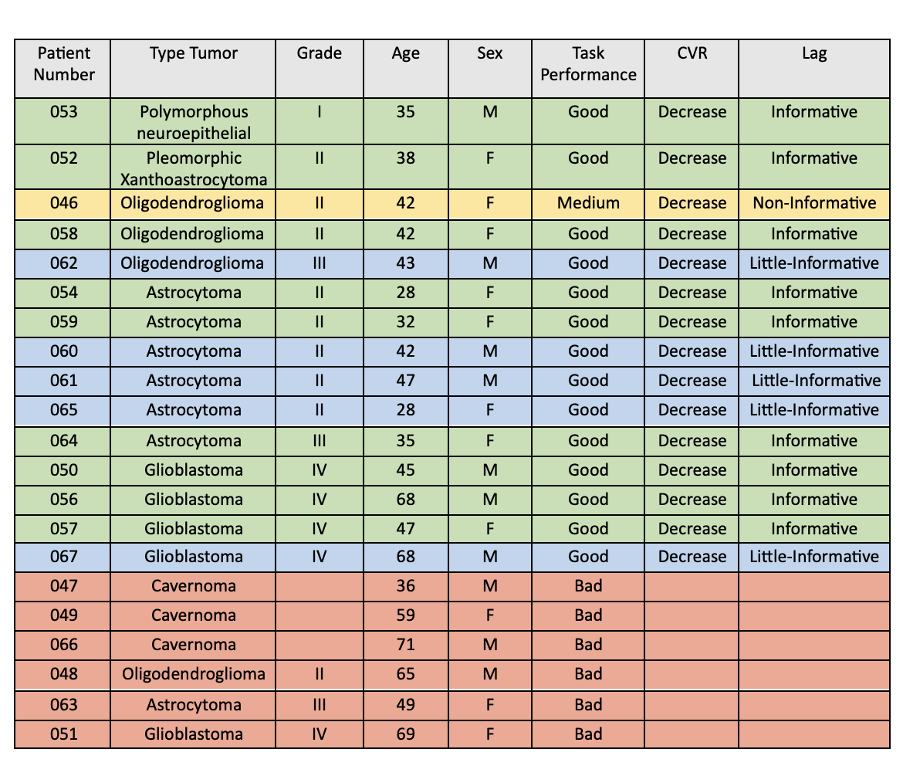
Table 1: Dataset study information categorized by patient characteristics (age and sex), glioma type and grade, subject task performance, and CVR and vascular lag map outcomes. Green: Patients showing a decrease in CVR maps and informative vascular lag maps. Blue: Patients showing a decrease in CVR maps but less informative vascular lag maps. Yellow: Subjects with medium task performance. Red: Patients with poor task performance (excluded from further analyses).
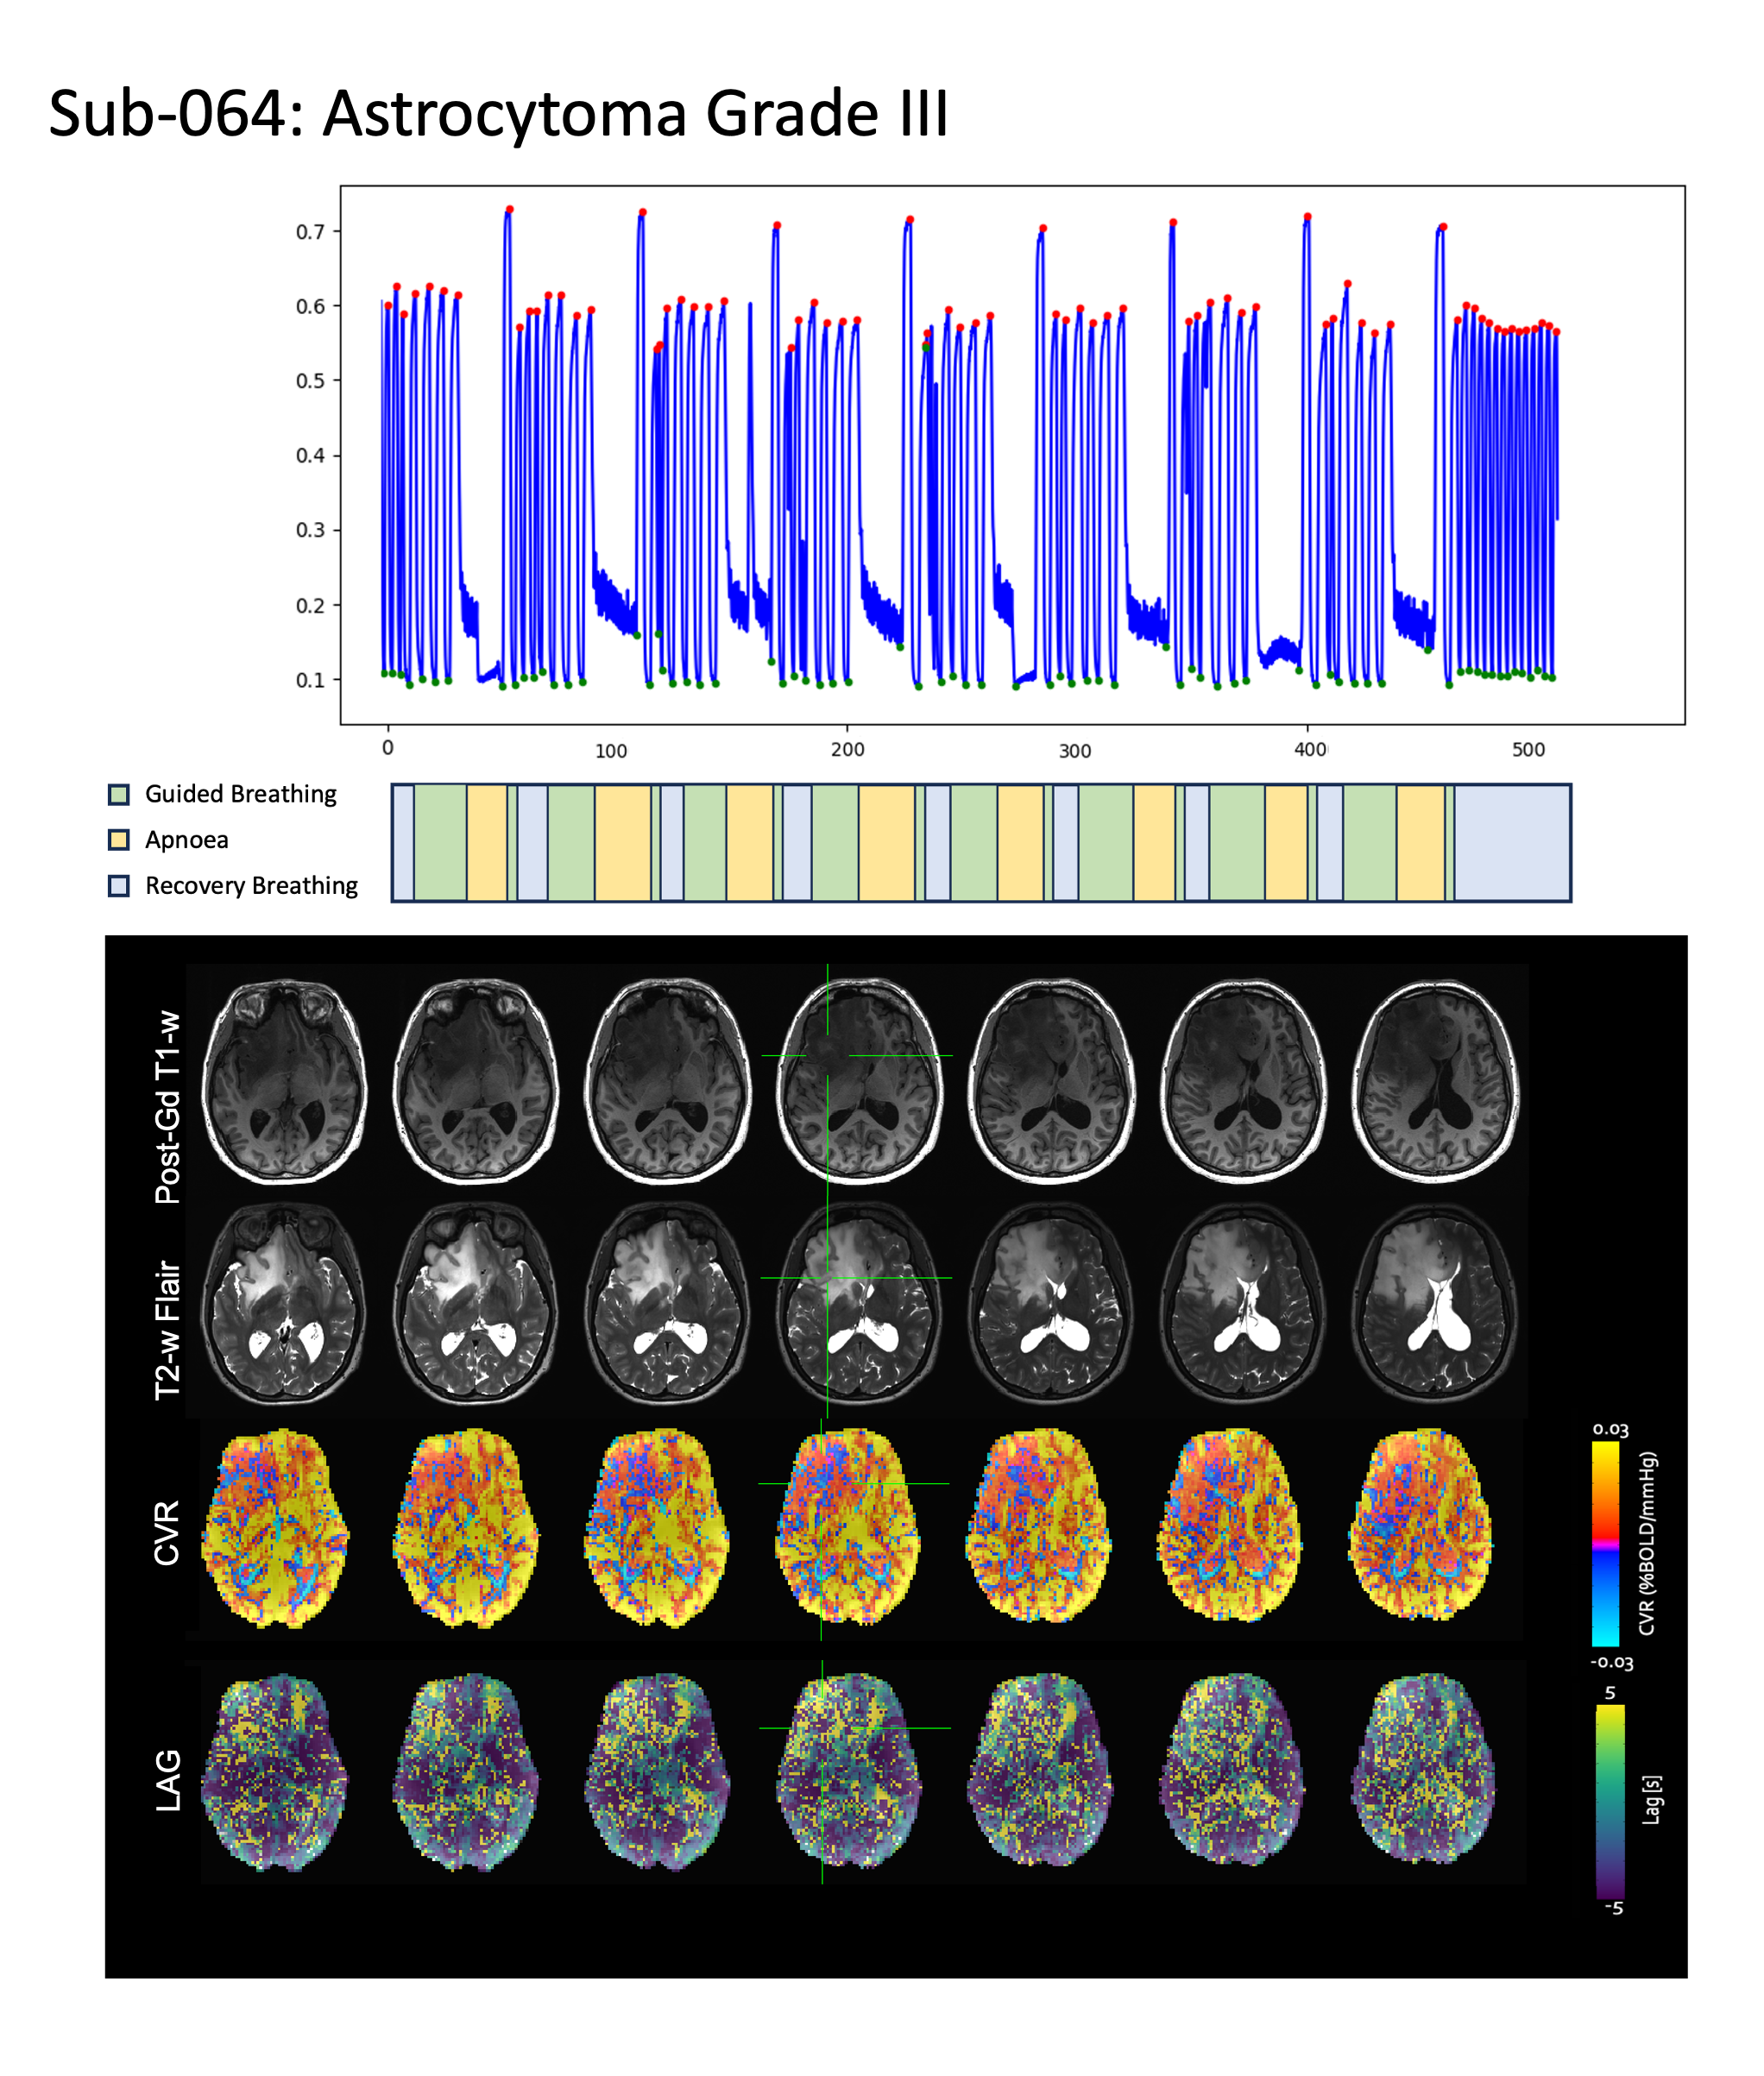
Figure 2 Astrocytoma Grade III patient (sub-064) with good task performance: The CO2 traces (top) show that subject 064 performed the eight BH trials of the task correctly (middle). The maps show a decrease in CVR in tumoral areas and increased vascular lag in tumoral and peritumoral areas.
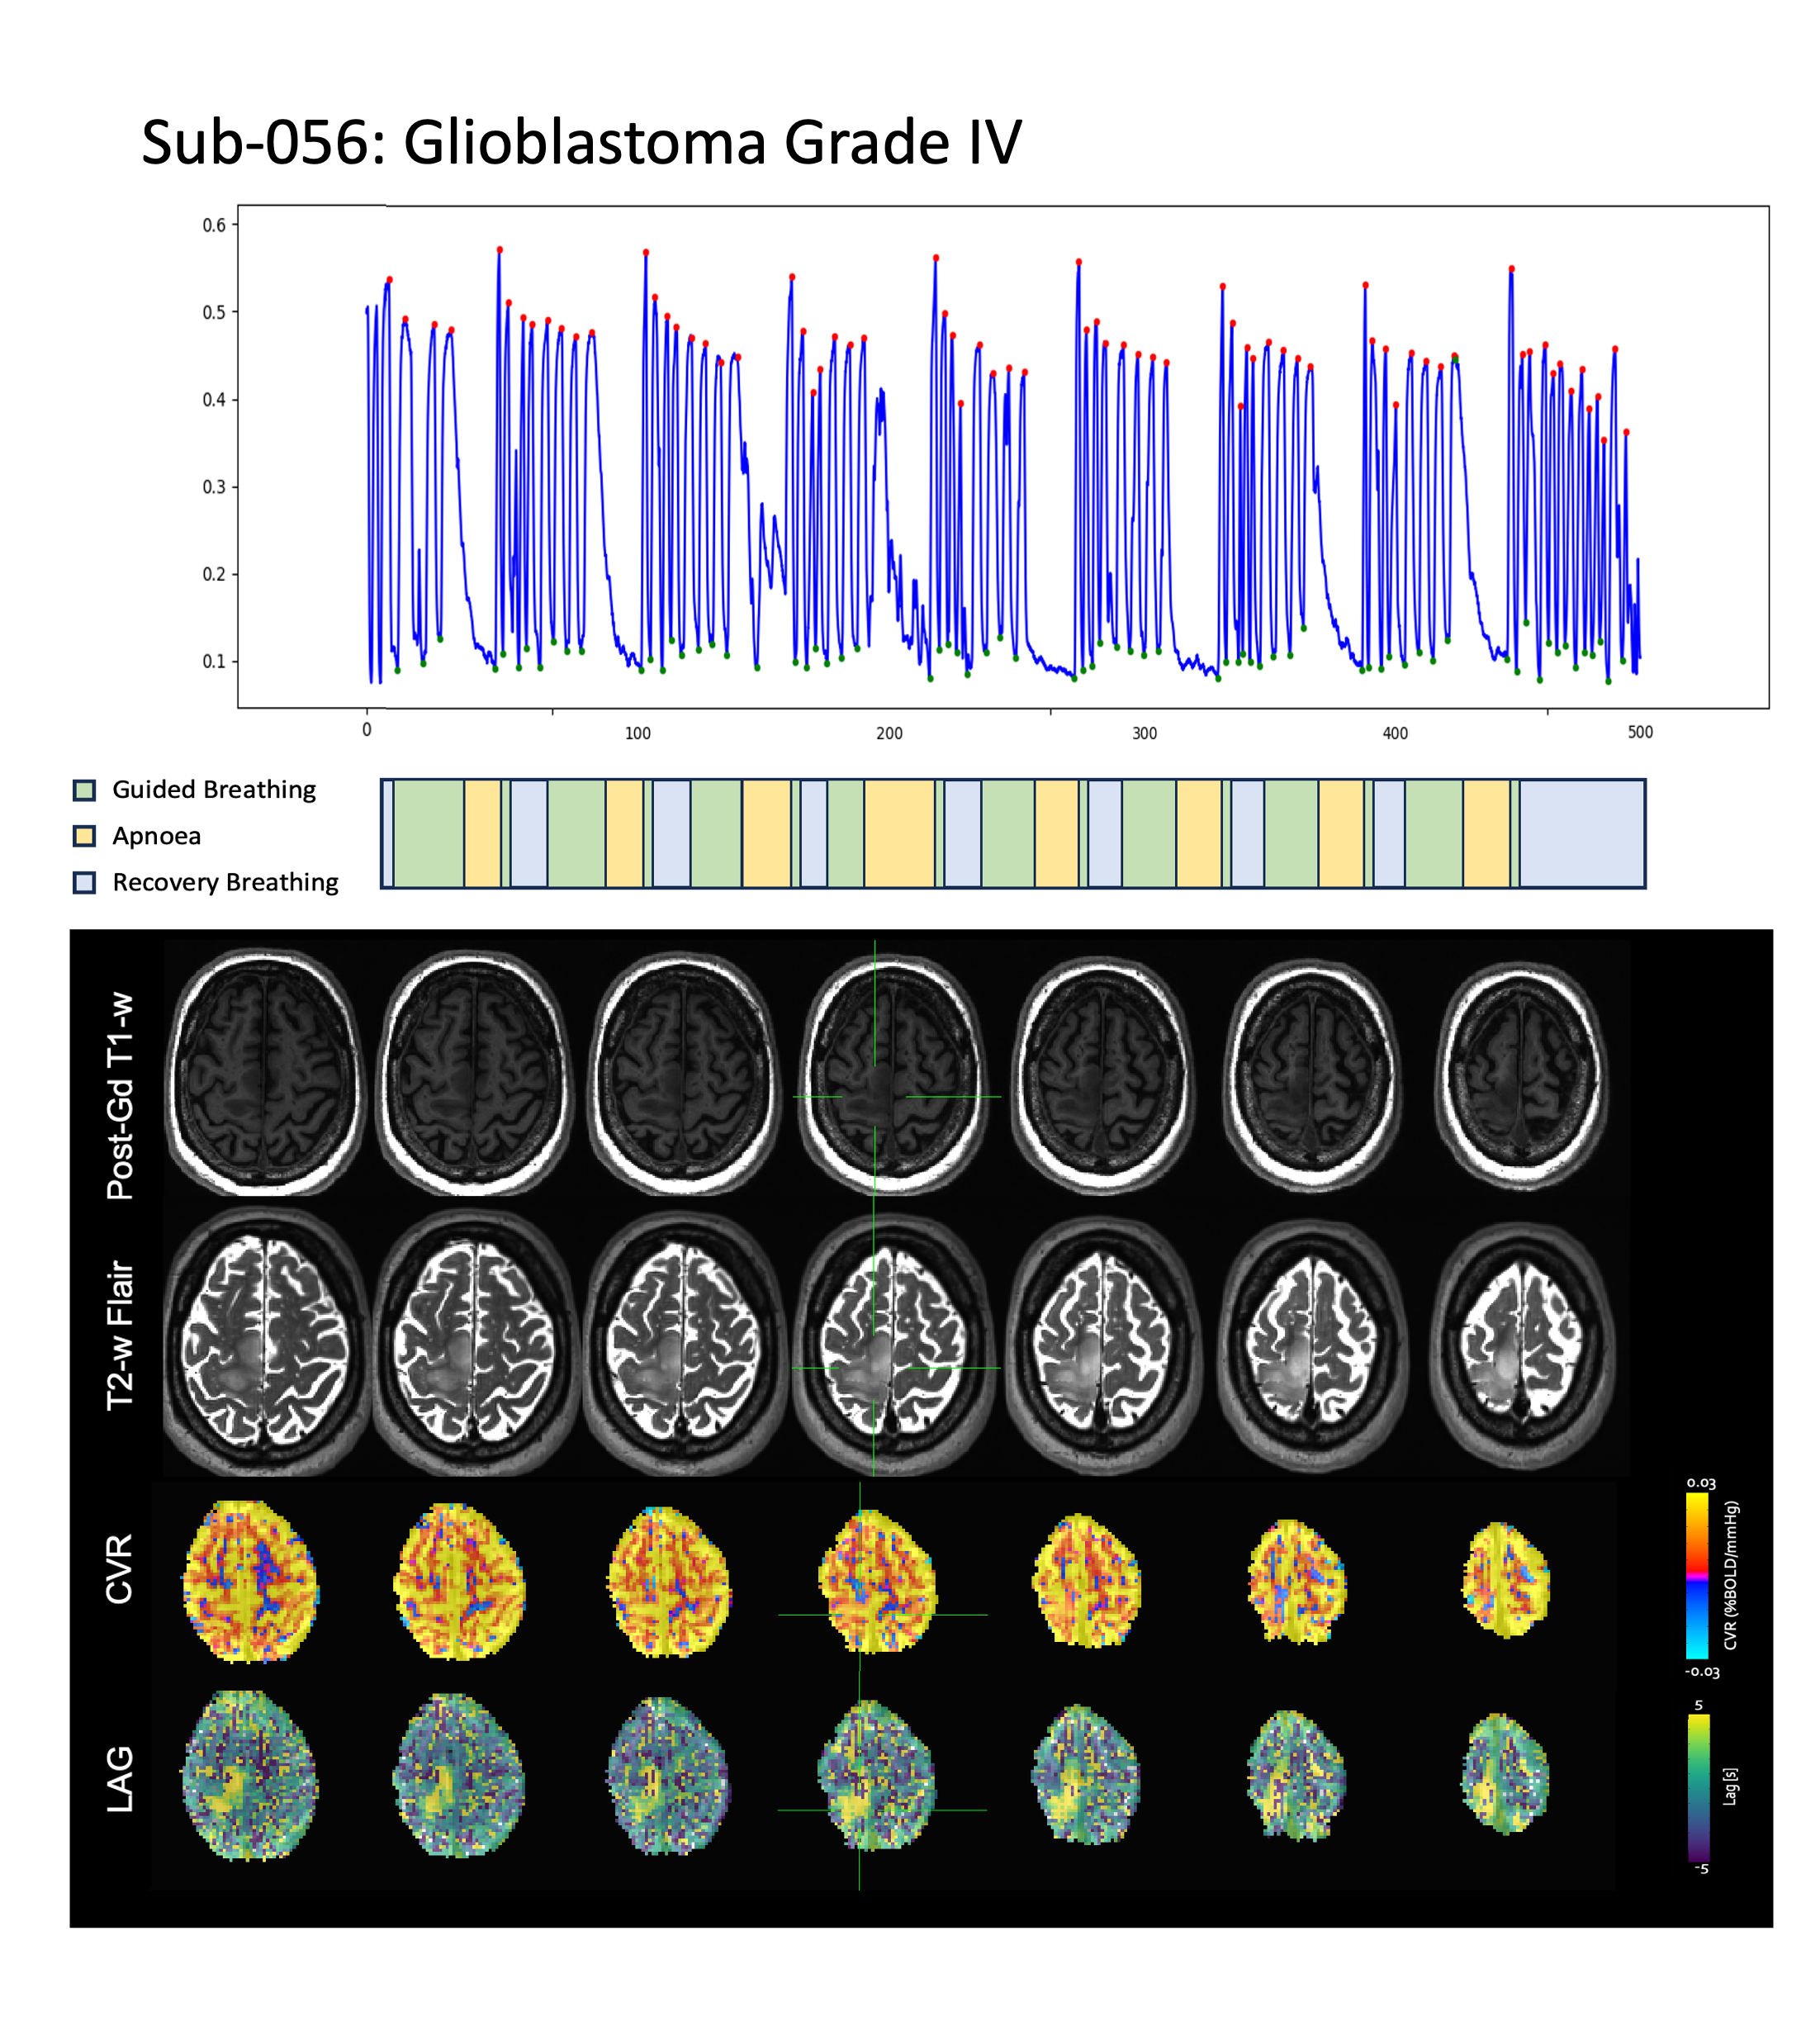
Figure 3 Glioblastoma Grade IV patient (sub-056) with good task performance: The CO2 traces (top) show that subject 056 performed the eight BH trials of the task correctly (middle). The CVR map shows a smaller reduction of CVR in the tumoral area, but a notable increase of the vascular lag in tumoral and peritumoral areas.
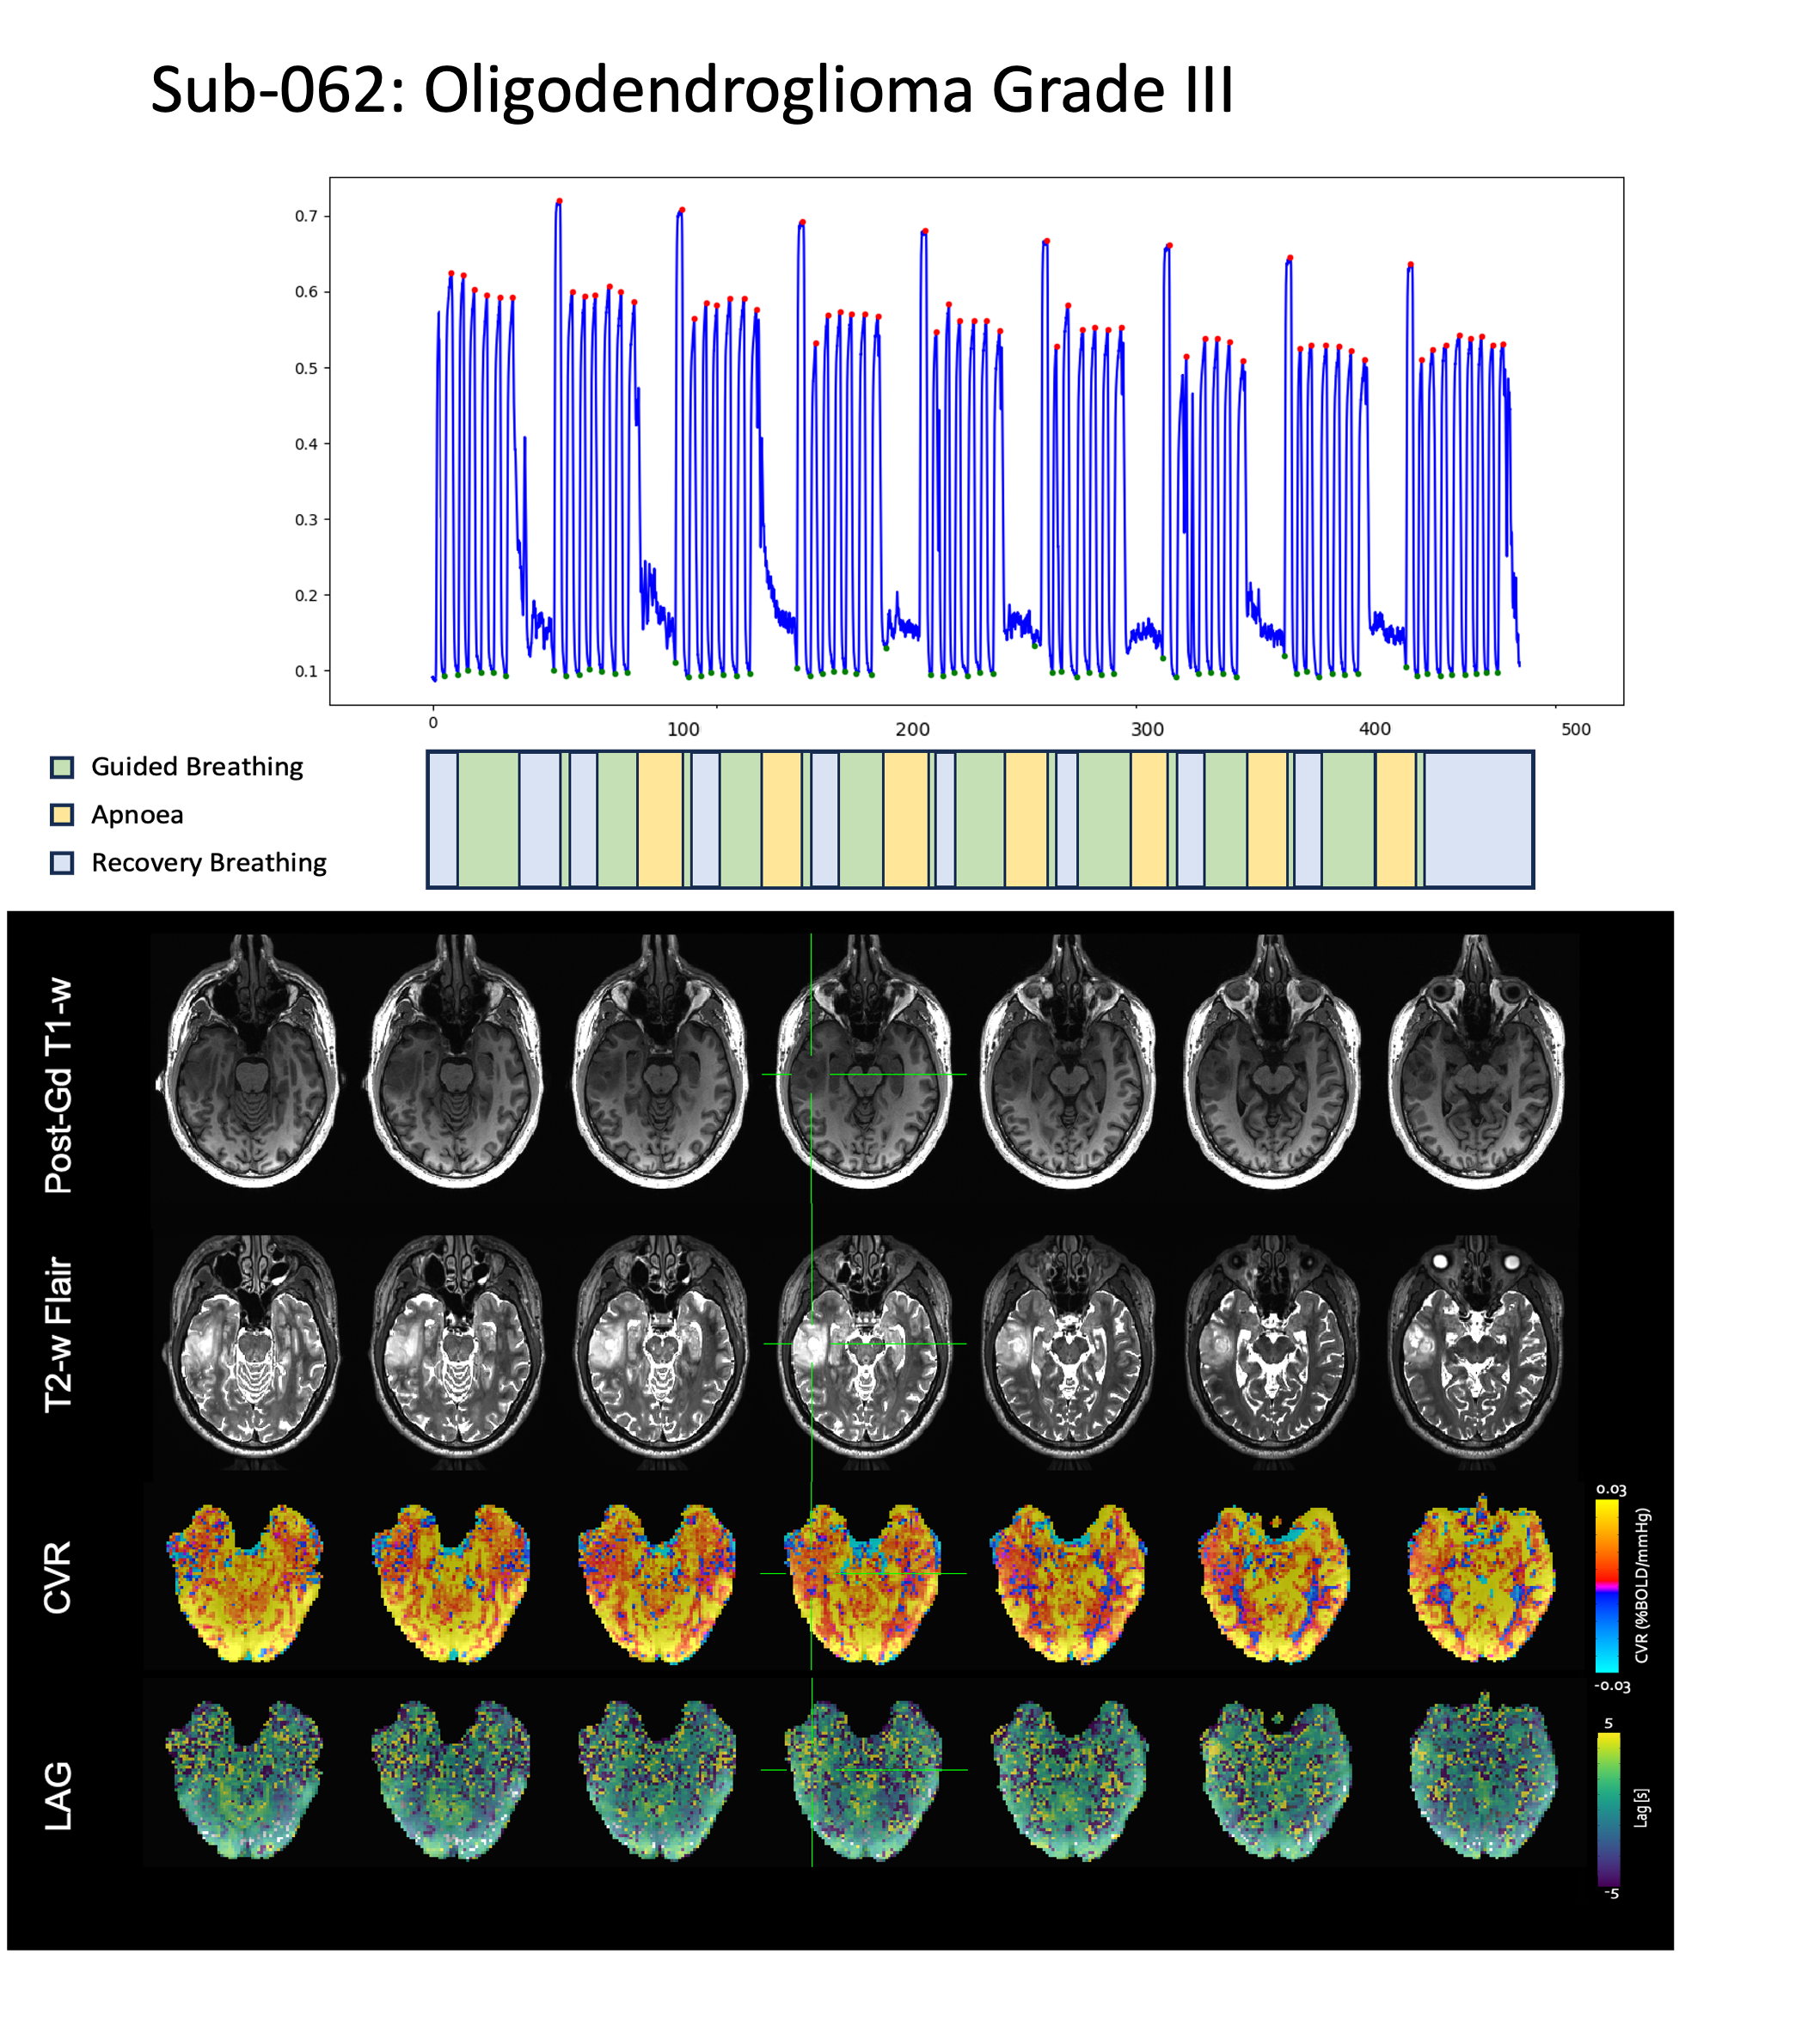
Figure 4 Oligodendroglioma Grade III patient (sub-062) with good performance task: The CO2 traces of subject 062 performed the eight BH trials of the task properly. This patient shows reduced CVR in the tumoral area, yet the vascular lag map offers no real valuable information about the tumor.
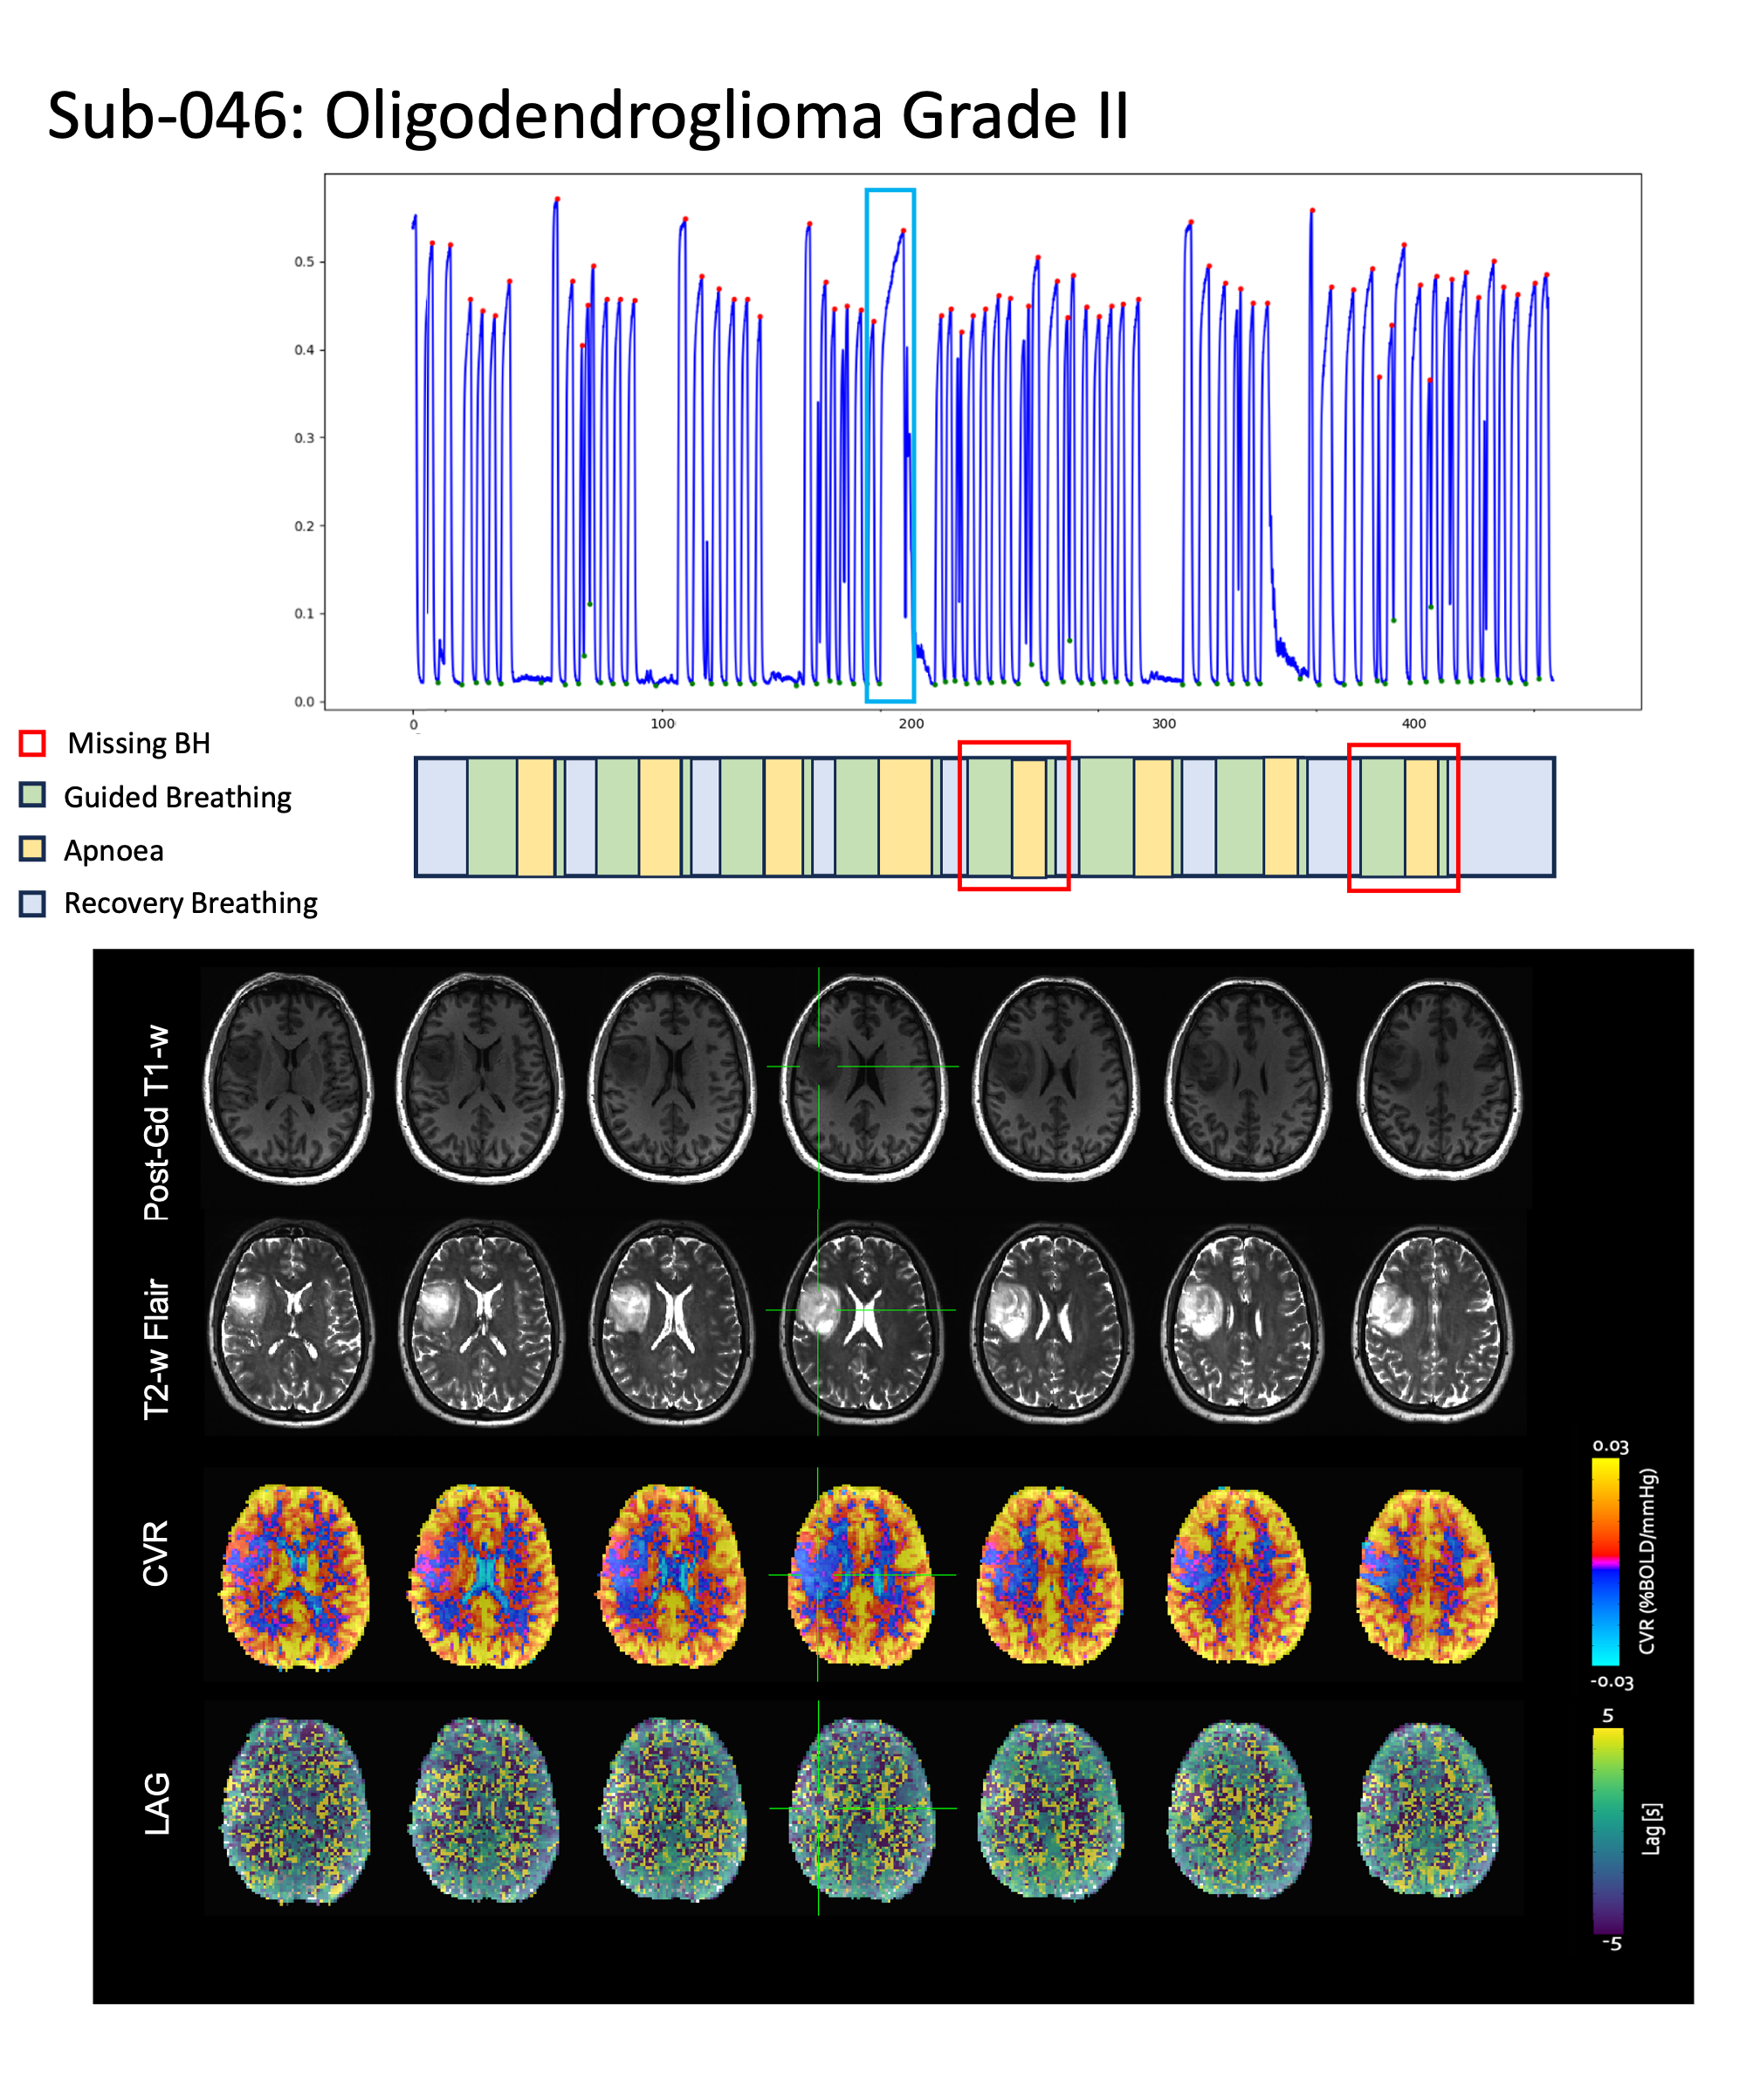
Figure 5 Oligodendroglioma Grade II patient (sub-046) with medium task performance: Subject 046 inspired, instead of expired, before the 4th apnoea, and missed the 5th and 8th apnoea (see boxes in panels). The results show reduced CVR in the tumoral area in the entire left hemisphere but without delimitation of the tumor. The vascular lag map offers no valuable information about the tumor.