5118
Imaging phenotypes-based quantification of intratumor heterogeneity using APTw for predicting progression in lower grade glioma.1Zhujiang Hospital of Southern Medical University, Guangzhou, China, 2The first people's hospital of Foshan, Foshan, China
Synopsis
Keywords: Tumors (Pre-Treatment), CEST & MT
Motivation: In the setting of lower grade glioma follow heterogeneity of prognosis, it is currently necessitating risk stratification.
Goal(s): To determine the predictive ability of amide proton transfer-weighted (APTw) imaging phenotypes in lower grade glioma.
Approach: The ability of APTw phenotypes to PFS was evaluated using biomarker threshold model, The predictive model was trained on 67%, and tested on the remainder.
Results: APTw imaging phenotypes can predict the progression free survival of lower grade gliomas.
Impact: The independent and additional prognostic value of imaging phenotypes in APTw suggests that APTw imaging phenotypes can provide a noninvasive characterization of tumor cellular, proliferation and invasiveness to augment personalized prognosis and treatment in patients with lower grade glioma.
Introduction
Lower grade gliomas of histologic grades II and III follow heterogeneity of prognosis, which necessitates risk stratification1-3. Amide proton transfer-weighted (APTw) imaging can provide unique tumor physiology information of concentration of mobile protein or peptides4. This study aims to explore and validate the value of APTw imaging as an imaging biomarker in predicting progression in patients with lower grade glioma.Methods and Materials
A retrospective analysis of 179 patients with lower grade glioma who underwent preoperative APTw imaging assessment between 2008 and 2021 was performed. The observation period for progression free survival (PFS) started on the date of surgery until the date of tumor progression, the last follow-up (censoring) or the end of the study (January 2022, censoring).The maximum and mean value of the 2D or 3D APTw normalized to the contralateral normal appearing white matter were extracted in the development set (n=120). The ability of rAPTmax and rAPTmean to PFS was evaluated using biomarker threshold model. Among the possible prognostic factors, the following were investigated: (1) patient-related factors (age, sex, history duration and reason for diagnosis); (2) factors related to the tumor by evaluating the preoperative conventional MRI, including affected side, tumor size, multifocal, corpus callosum involvement, boundary and enhancement pattern; (3) treatment related factors: including extent of the surgery, postoperative management whether adjuvant therapy (radiotherapy or chemotherapy); (4) molecular and histological characteristics, including IDH mutation status and WHO grade.
Four single modal models based on conventional MR, APTw, pathological and therapeutic and clinical features were established by multivariate Cox proportional risk regression analysis. Two combined models, selecting parameters among clinical-radiologic-therapeutic-pathologic characteristics using least absolute shrinkage and selection operator (LASSO) and multivariate regression analysis, respectively, were construct for comparison. The predictive power, calibration, and clinical usefulness of the model were validated in an independent internal cohort.
Results
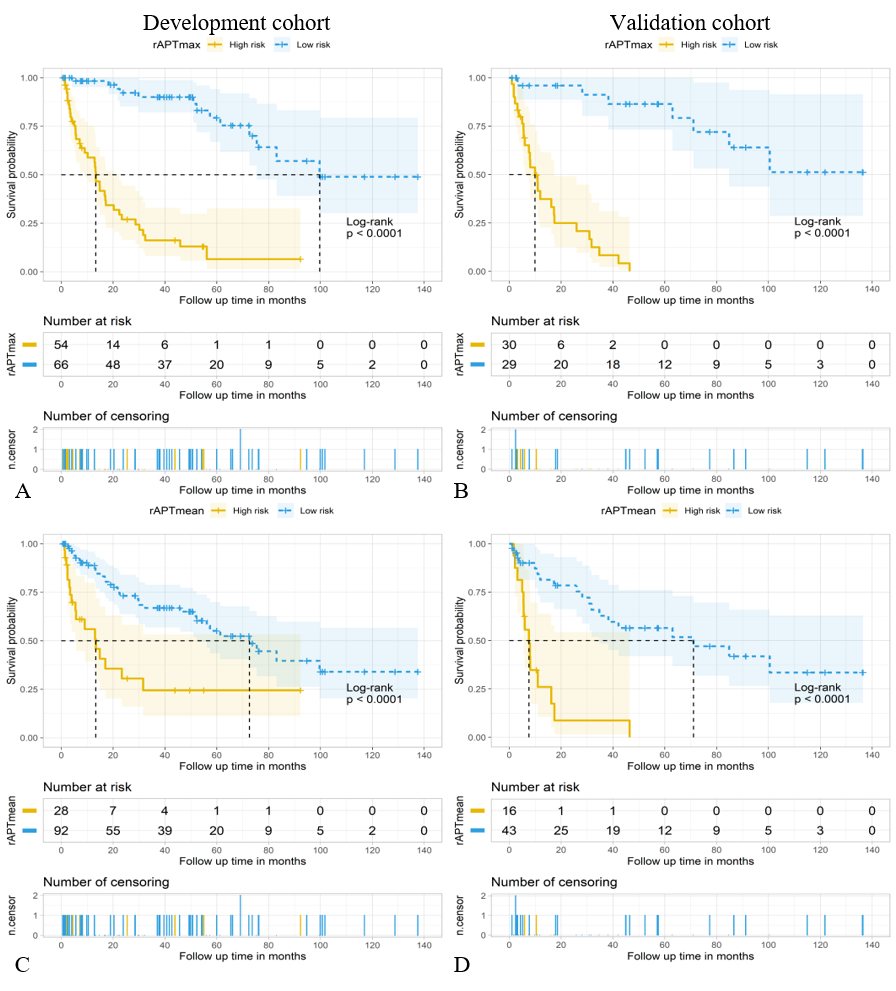
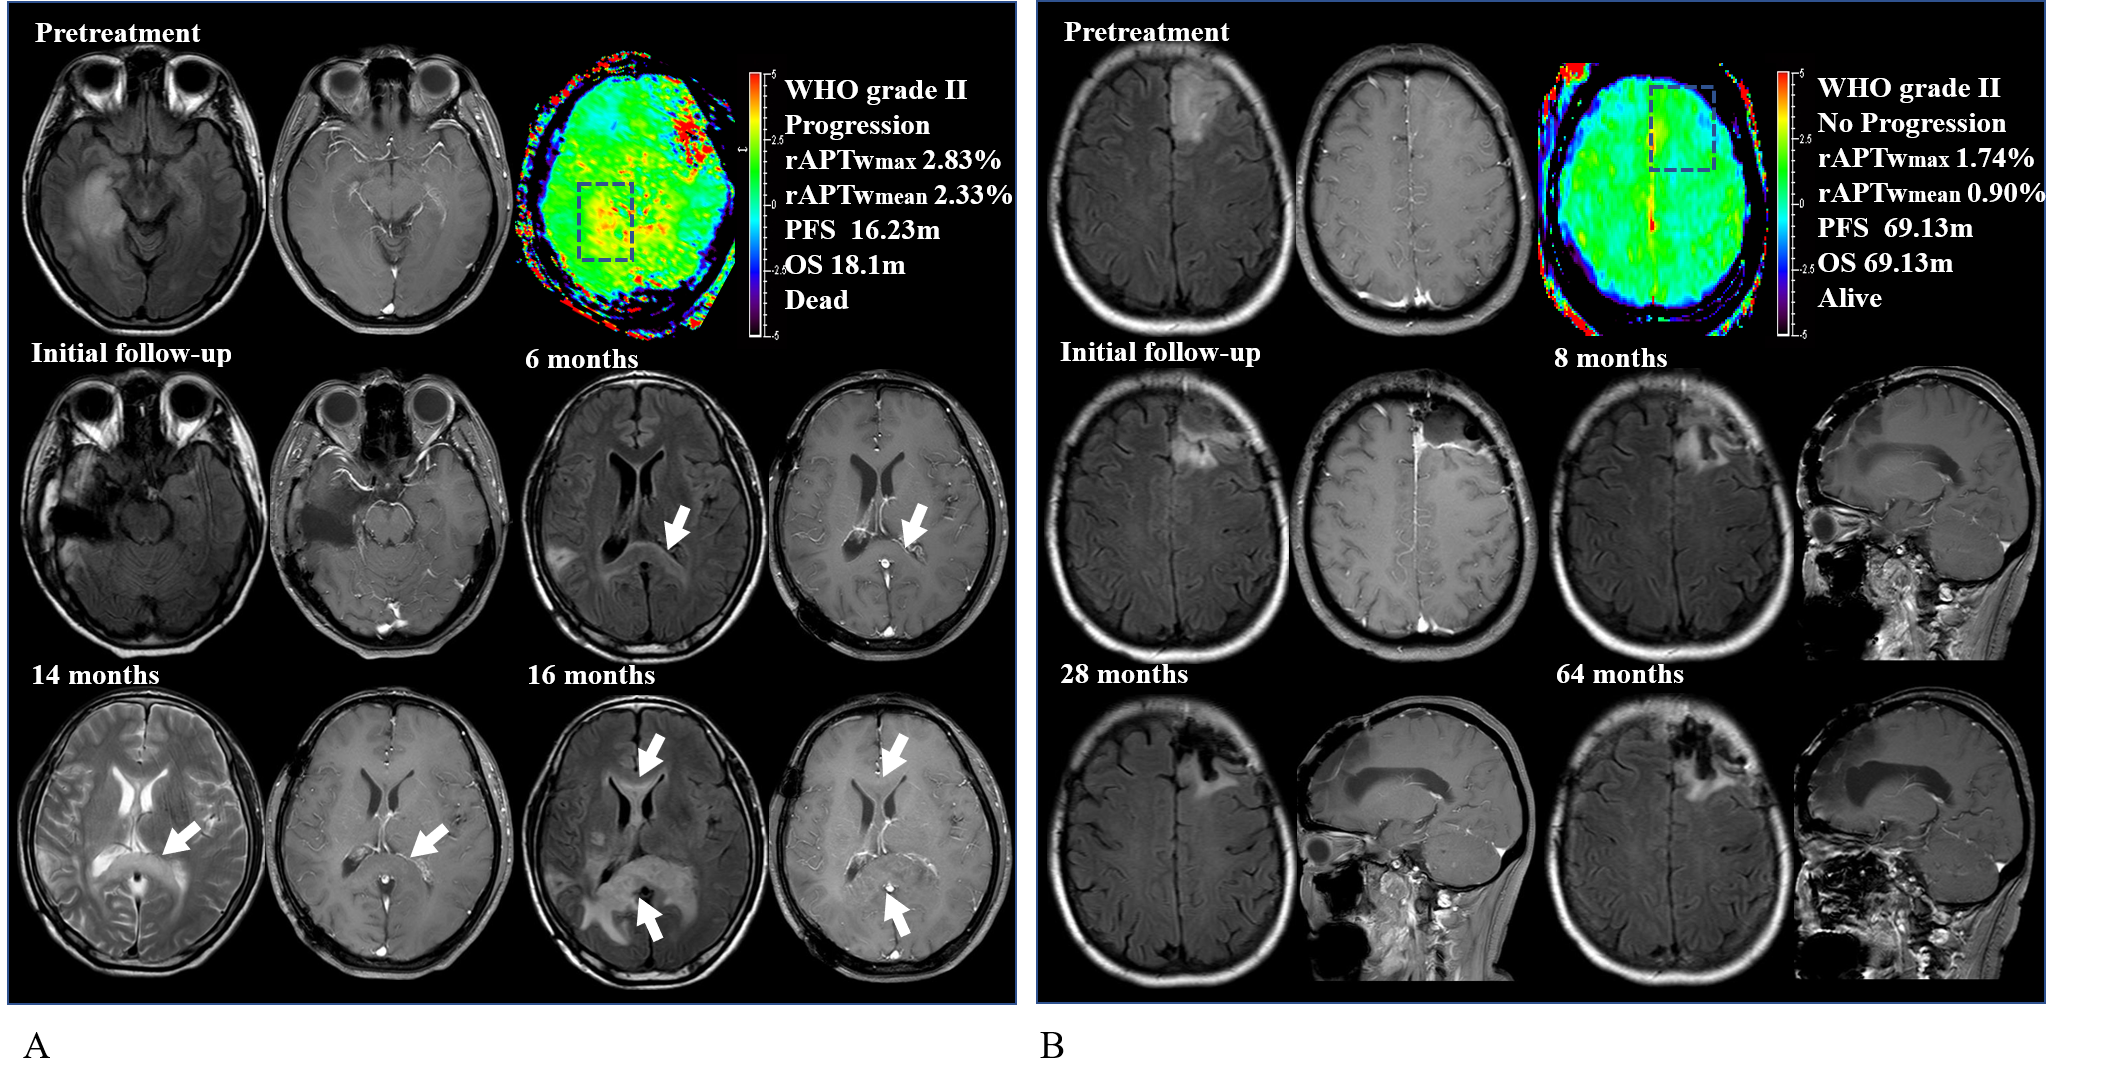
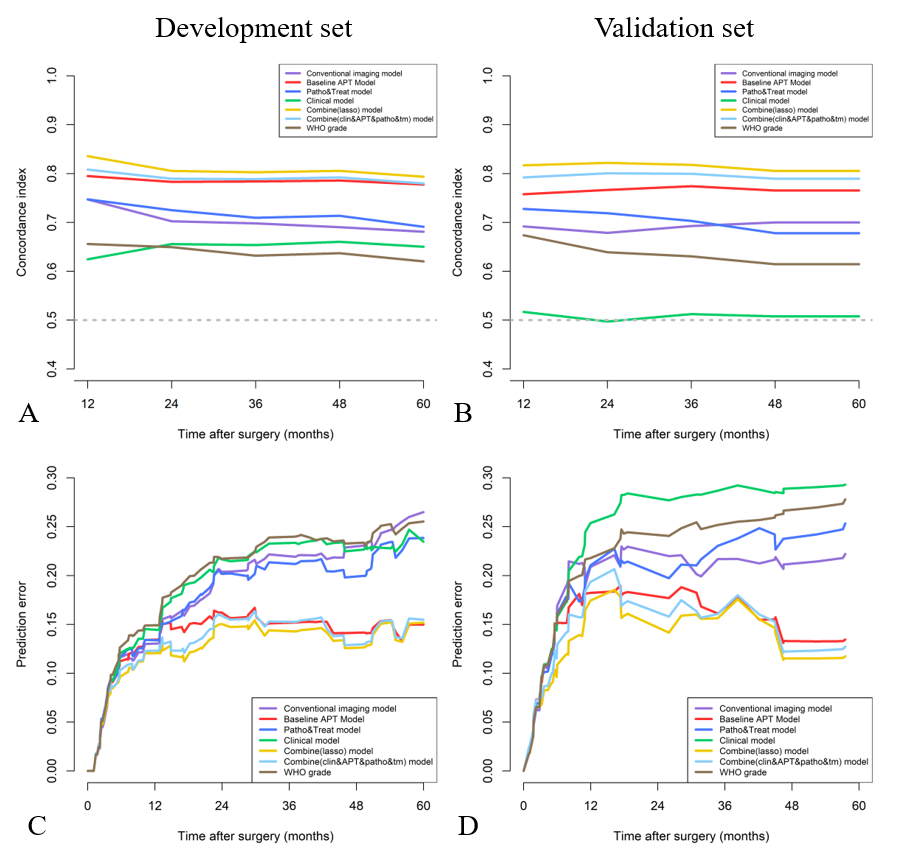
A total of 179 patients were evaluated, including 120 patients (median age, 42years, interquartile range [IQR], 33–51 years; 66 men) in the development set and 59 (median age, 38 years, IQR,32–47years; 38 men) in the validation set. During follow-up, patients met the endpoint in 51 of 120 (42.5%) and 33 of 59 (55.9%) in the development and validation set, respectively. Follow-up duration, median PFS and clinical-radiologic-therapeutic-pathologic characteristics were comparable between two sets(P>0.05). The biomarker threshold model revealed an optimal cutoff of 2.31% for rAPTmax and 1.89% for rAPTmean in predicting PFS, and two significant imaging phenotypes stratifying the risk for PFS in lower grade of gliomas were identified in the development set and reproduced in the validation set (P < 0.01)(Fig.1). Representative cases for APTw phenotypes in prognostic risk stratifying are shown in Fig.2.In both study sets, APTw phenotypes-based model demonstrated better predictive performance (C-index:0.78 and 0.77), lower predictive error (integrated Brier score:0.16 and 0.15) and greater net benefit than rival single modal models. The combined model(LASSO) based on rAPTwmax and IDH mutation status showed best prediction performance ( C-index≥0.80, IBS≤0.15), better calibration and greater clinical benefit (Fig.3)
Conclusions
APTw imaging phenotypes was able to predict the progression free survival of lower grade gliomas, and superior to clinical prognostic factors and molecular markers.Acknowledgements
The authors thank the radiologist and nurse colleagues who helped during the research study. A special thank you is also expressed to the patients for participating in the study.References
1. Schiff D, Van den Bent M, Vogelbaum MA, et al. Recent developments and future directions in adult lower-grade gliomas: Society for Neuro-Oncology (SNO) and European Association of Neuro-Oncology (EANO) consensus. Neuro Oncol 2019;21(7):837-853.
2. Ostrom QT, Cioffi G, Waite K, et al. CBTRUS Statistical Report: Primary Brain and Other Central Nervous System Tumors Diagnosed in the United States in 2014–2018. Neuro-Oncology 2021;23(Supplement_3):iii1-iii105.
3. Brat DJ, Verhaak RG, Aldape KD, et al. Comprehensive, Integrative Genomic Analysis of Diffuse Lower-Grade Gliomas. N Engl J Med 2015;372(26):2481-2498.
4. Joo B, Han K, Ahn SS, et al. Amide proton transfer imaging might predict survival and IDH mutation status in high-grade glioma. European Radiology 2019;29(12):6643-6652.
Figures