5116
Differential Diagnosis between Tumor Recurrence and Treatment Response using Advanced Tracer Kinetic Model in Glioblastoma1Department of Radiology, The Affiliated Drum Tower Hospital of Nanjing University Medical School, Nanjing, China, 2Jiangsu Key Laboratory of Medical Optics, Suzhou Institute of Biomedical Engineering and Technology, Chinese Academy of Sciences, Suzhou, China., Suzhou, China
Synopsis
Keywords: Tumors (Post-Treatment), Tumor, Glioblastoma, Tumor recurrent, Treatment-related response, Distributed parameter model, Dynamic contrast-enhanced
Motivation: It is challenging to differentiate recurrent tumor from treatment response in glioblastoma.
Goal(s): This study explored the issue using an advanced tracer kinetic model.
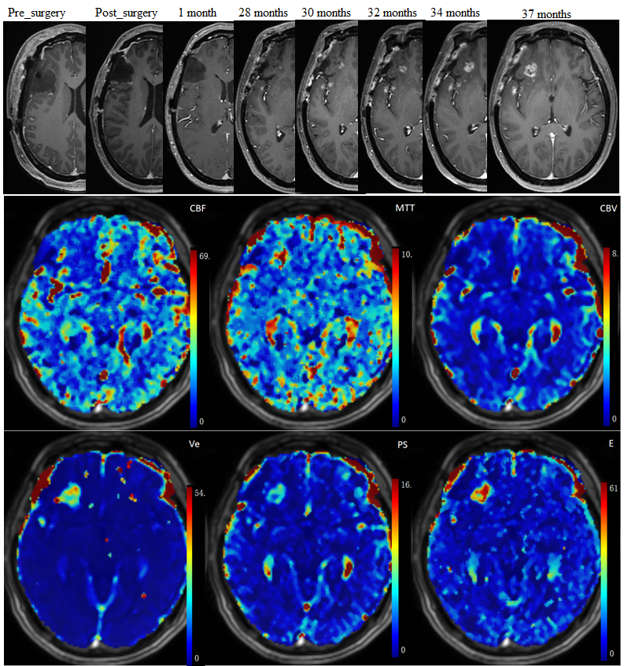
Approach: Glioblastoma patients were examined using dynamic contrast-enhanced MRI and stratified into recurrent and treatment-related group based on histopathological results. Imaging data were analyzed using distributed parameter model.
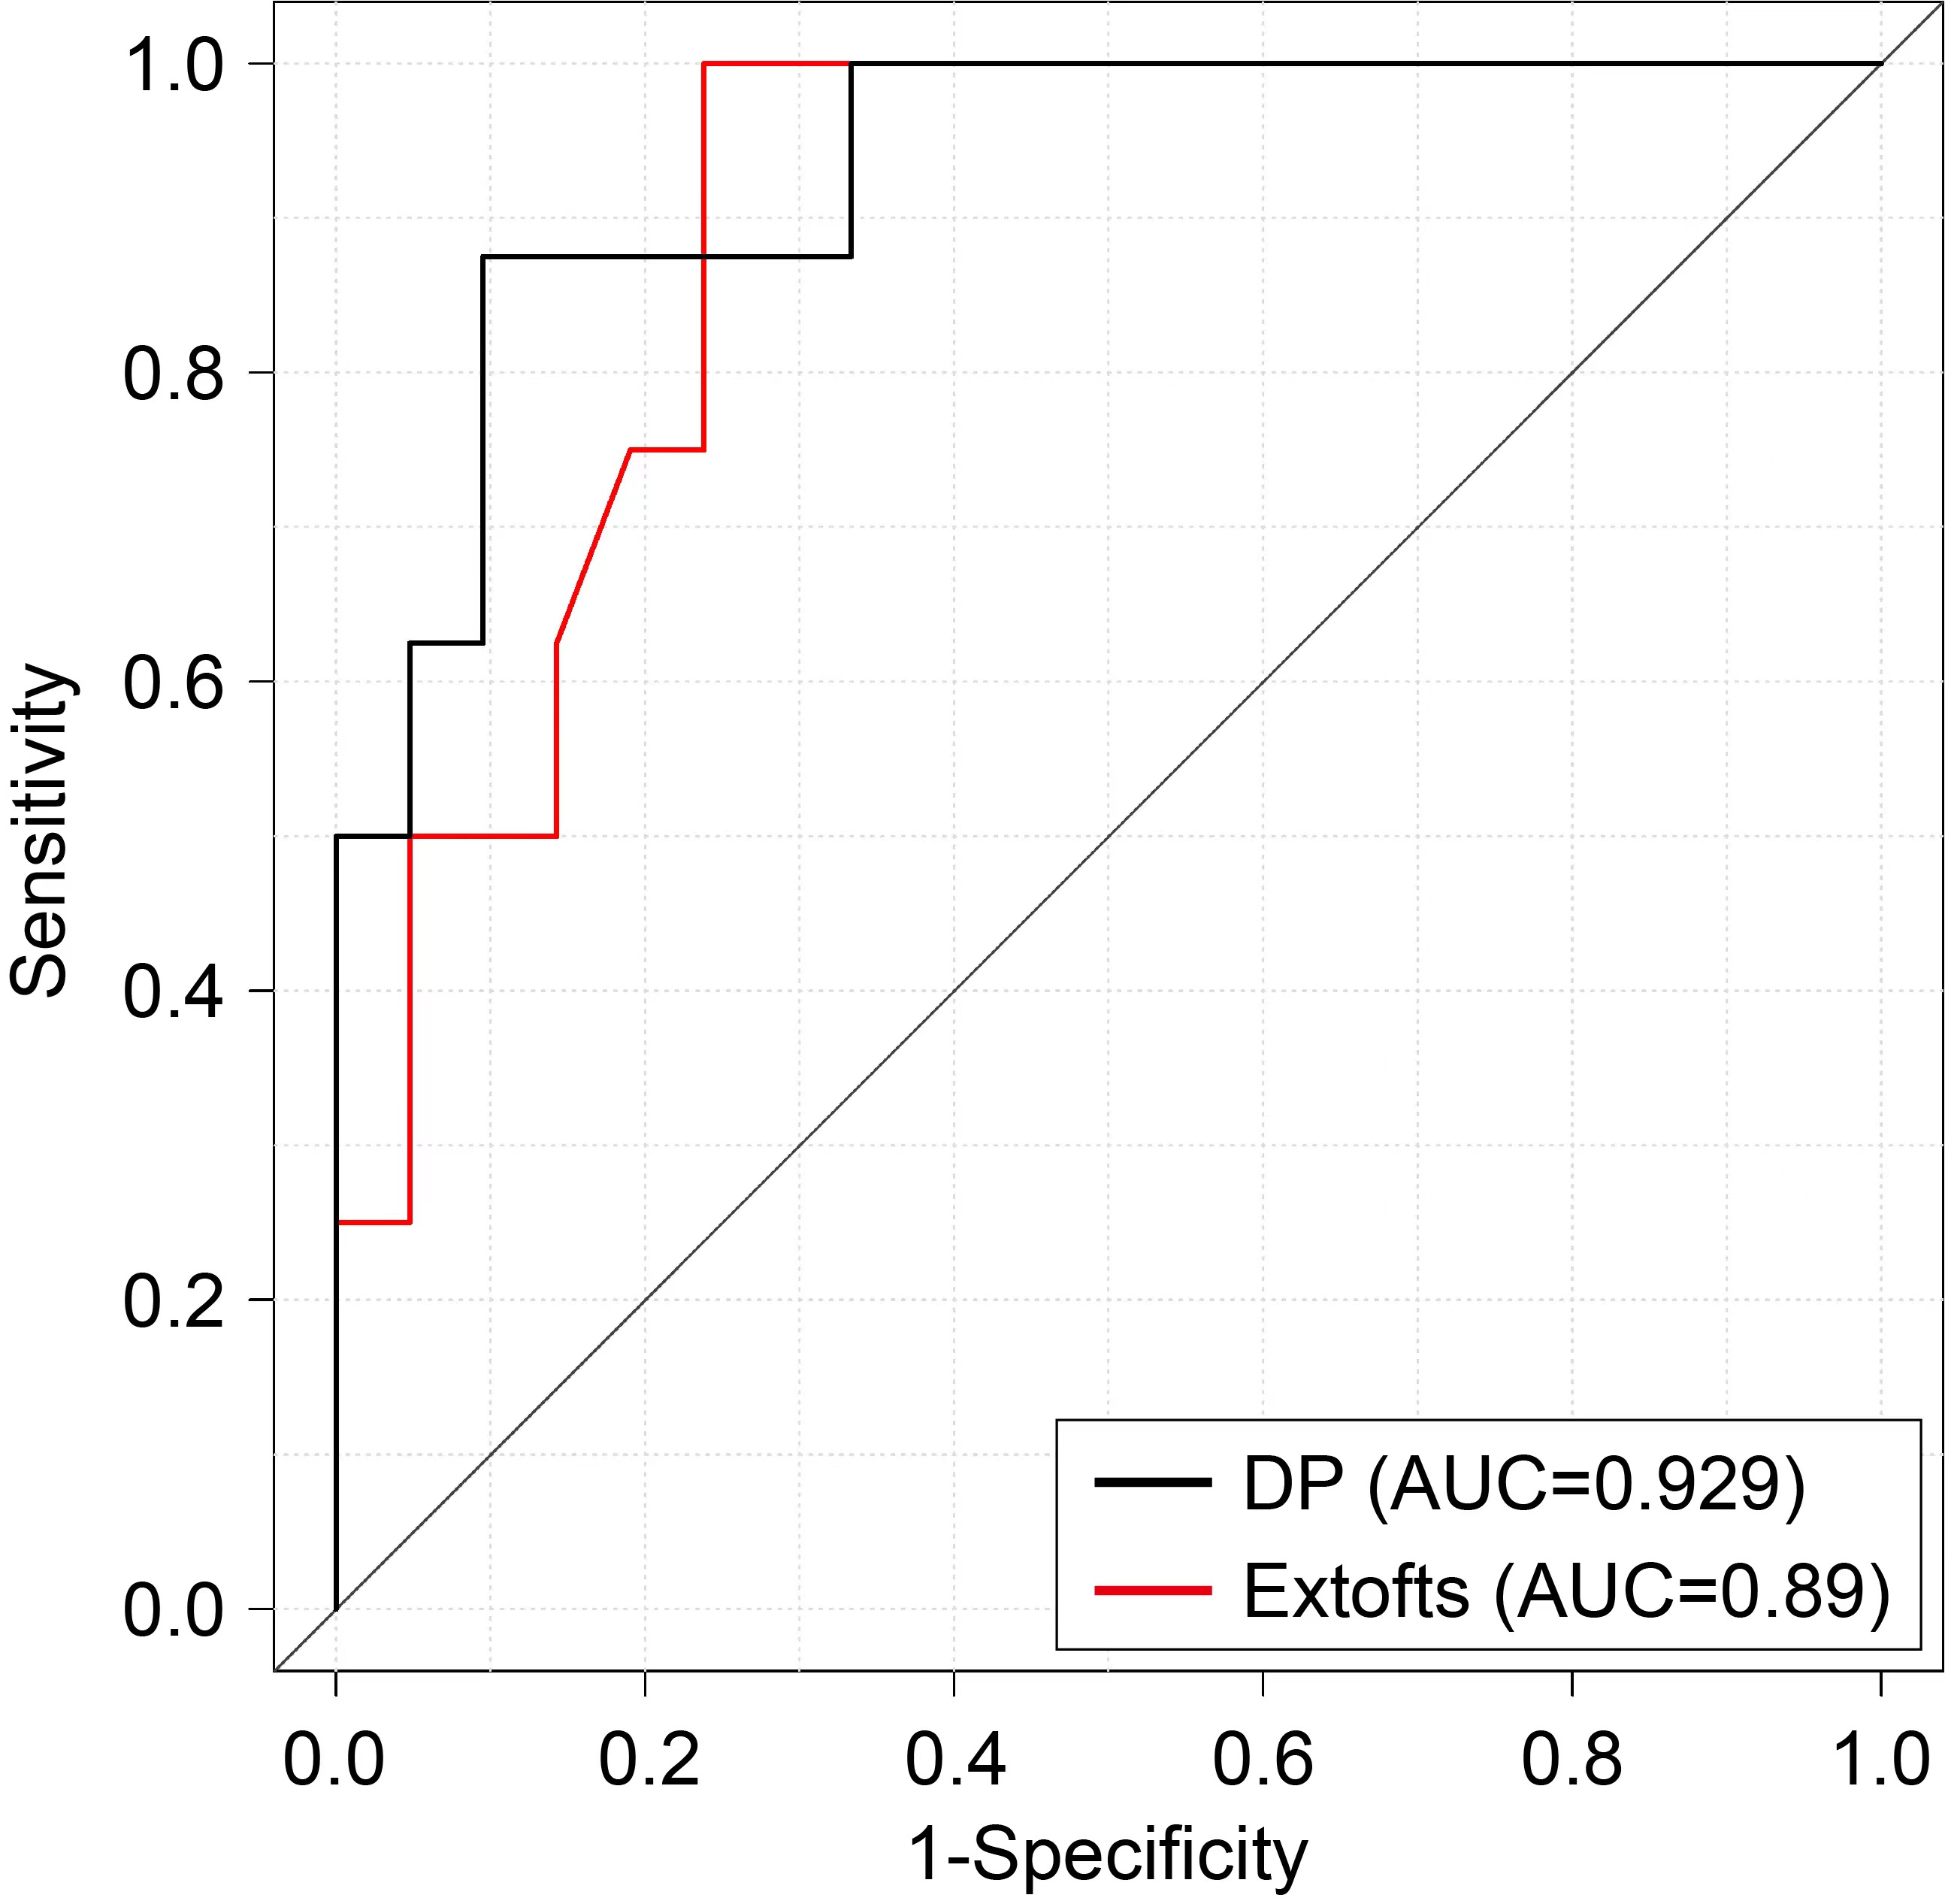
Results: Blood flow in lesion was significantly higher and permeability in peritumoral edema was significantly smaller in recurrent than in treatment-related group (p=0.002, 0.023). Combining two parameters together, diagnostic performance was attained at AUC (area under ROC curve) 0.93. AUC of extended-Tofts model was 0.89.
Impact: With separate account of blood flow and vessel-wall permeability, advanced tracer kinetic model allowed more precise modeling the feature of tissue microenvironment, which could shed light on the difference between recurrent tumor and treatment-related response in glioblastoma.
Introduction
Glioblastoma is the most common primary malignant tumor of central nervous system1, which is characterized by extensive invasion, strong invasion and angiogenesis, leading to difficulty in complete removal of tumor by surgery and high chance of glioblastomas relapse after surgery. Radiotherapy has been the standard of care after tumor resection, which is often administered together with chemotherapy2. Using response assessment in neuro- oncology (RANO) criteria, MRI is the standard diagnostic measure for the evaluation of disease status or treatment response3,4. However, accurate detection of recurrent glioblastoma using conventional MRI would be hampered by response due to treatment which shares similar signs in conventional MR images.As an advanced MRI technique, dynamic contrast enhanced (DCE)-MRI has received attention for its ability to reveal tissue microenvironment via modeling the kinetics of tracer molecular5,6. Previous studies using extended Tofts model7 have shown that the derived kinetic parameters might be useful for differentiating tumor recurrence from predominant treatment effects5,6. There has been witnessed significant progress on the research of tracer kinetic modeling8. The purpose of this study is to explore the performance of an advanced tracer kinetic model, namely the distributed parameter model (DP), in differential diagnosis between glioblastoma recurrence and treatment response.
Materials and Methods
Patient data between 2021 and 2023 meeting the following criteria were reviewed: (1) pathologically confirmed glioblastoma; (2) underwent DCE-MRI examination during the follow-up period after surgery in a 3.0T MR scanner (uMR770, United Imaging Healthcare); (3) receiving concurrent chemoradiation therapy (CCRT) with temozolomide after surgery. DCE-MRI based on transversal T1-weighted spoiled gradient-echo sequence was performed before, during and after the injection of contrast agent (gadodiamide, 0.2mL/kg, 3.5mL/s), with 90 post-contrast time-points at temporal resolution 4s.Distributed Parameter (DP) model was formulated as follows
$$C_{tiss}\left(t\right)=AIF\otimes F_{p}\left\{u\left(t\right)-u\left(t-\frac{V_{p}}{F_{p}}\right)+u\left(t-\frac{V_{p}}{F_{p}}\left\{1-\exp\left(-\frac{PS}{F_{p}}\right)\left[1+\int_{0}^{t-\frac{V_{p}}{F_{p}}} \exp\left(-\frac{PS}{V_{e}}\tau\right)\sqrt{\frac{PS}{V_{e}}\frac{PS}{F_{p}}\frac{1}{\tau}}I_{1}\left(2\sqrt{\frac{PS}{V_{e}}\frac{PS}{F_{p}}\tau}\right)d\tau\right]\right\}\right)\right\}$$
where AIF denotes artery input function, Ctiss(t) is the tissue tracer concentration with time,. u(t) denotes the Heaviside unit-step function and I1 is the modified Bessel function. The derived kinetic parameters include: blood flow (Fp), vessel wall permeability (PS), fractional volume of intravascular space (vp), fractional volume of interstitial space (ve). Extracted fraction of first pass was calculated as $$E=1-\exp\left(1-\frac{PS}{F_{p}}\right)$$.
Region-of-interests were delineated manually including the whole tumor, peritumoral edema and normal-appearing white matter (nWM). Relative kinetic parameters were calculated division of parameter values over nWM. Lesion was classified as tumor recurrent or treatment response according to follow-up imaging findings and histopathological results. Mann-Whitney U test was used to compare the difference between tumor recurrent and treatment response group. The receiver operating curve (ROC) curve analysis was performed and area under ROC curve (AUC) was computed to assess the diagnostic performance of kinetic parameters in distinguishing two groups. P<0.05 indicated statistically significance.
Results
Twenty-nine patients were included, with twenty-one recurrent and eight treatment-related. As shown in Figure 1, significant parameters were observed in CBF_tumor (recurrent 40.655±9.625 mL/min/100mL vs treatment 27.930±8.448 mL/min/100mL, P=0.002), rPS_edema (recurrent 0.150 [0.125,0.431] vs treatment 1.020 [0.301,3.474], P=0.023), and rE_edema (recurrent 0.232 [0.126,0.712] vs treatment 0.855 [0.351,2.445], P=0.023). Combining these parameters using Logistic regression resulted in AUC 0.93 in distinguishing recurrent tumor and treatment response. Comparatively, parameters of extended_Tofts showed statistical significance were rKep_tumor, rKtrans_edema and rKep_edema (P=0.0.040, 0.006, 0.038) and AUC of ETM was 0.89 (Figure 2).Discussion
This study found that DP model could be advantageous over extended_Tofts model in differentiating glioblastoma recurrence from treatment response. This might be due to separate accounting of blood flow and vessel wall permeability in DP, whereas extended_Tofts model described these two factors using a single kinetic parameter Ktrans. Blood flow in lesion was found to be most discriminative.Rissanen et al9 showed that VEGF overexpression promoted growth of arteries and veins and induced capillary arterialization leading to supraphysiological blood flow in target muscles, which might explain the finding of blood flow in differentiating tumor recurrent and treatment response in the present study. Nevertheless, investigation of blood flow in assessing treatment response of glioblastoma was limited10. Xu et al reported that blood flow derived using ASL and DSC attained similar performance in differential diagnosis of glioma recurrence and treatment-related effects11. Larsen et al derived blood flow using model-free deconvolution with Tikhonov regularization of DCE images and found that neither CBF nor permeability provided a good discrimination of regressing and progressing lesions12. The variation in measurement methods and findings indicated that more studies were necessary.
Conclusion
Advanced DCE imaging allowed joint calculation of Blood flow and permeability and showed that blood flow was a potential marker in differentiating glioblastoma recurrence and treatment-related response.Acknowledgements
No acknowledgement found.References
1. Ostrom QT, Gittleman H, Truitt G, Boscia A, Kruchko C, Barnholtz-Sloan JS. CBTRUS Statistical Report: Primary Brain and Other Central Nervous System Tumors Diagnosed in the United States in 2011-2015. Neuro Oncol. 2018 Oct 1;20(suppl_4): iv1-iv86.
2. Birzu C, French P, Caccese M, et al. Recurrent glioblastoma: From molecular landscape to new treatment perspectives. Cancers (Basel). 2020;13(1):47.
3. Wen, P. Y. et al. Updated response assessment criteria for high- grade gliomas: response assessment in neuro- oncology working group. J. Clin. Oncol. 28, 1963–1972 (2010).
4. Ellingson BM, Wen PY, Cloughesy TF. Modified criteria for radiographic response assessment in glioblastoma clinical trials. Neurotherapeutics 2017;14(2):307–20
5. Thomas AA, Arevalo-Perez J, Kaley T, et al. Dynamic contrast enhanced T1 MRI perfusion differentiates pseudoprogression from recurrent glioblastoma. J Neurooncol. 2015; 125:183–190.
6. Yun TJ, Park CK, Kim TM, et al. Glioblastoma treated with concurrent radiation therapy and temozolomide chemotherapy: differentiation of true progression from pseudoprogression with quantitative dynamic contrast-enhanced MR imaging. Radiology. 2015; 274:830–840.
7. Tofts, P.S. et al. Estimating kinetic parameters from dynamic contrast-enhanced T(1)-weighted MRI of a diffusable tracer: Standardized quantities and symbols. J. Magn. Reson. Imaging 1999, 10, 223–232
8. Koh TS, Bisdas S, Koh DM, Thng CH. Fundamentals of tracer kinetics for dynamic contrast-enhanced MRI. Journal of magnetic resonance imaging. JMRI 2011;34(6):1262-1276.
9. TT Rissanen, P Korpisalo, JE Markkanen, et al. (2005). Blood Flow Remodels Growing Vasculature During Vascular Endothelial Growth Factor Gene Therapy and Determines Between Capillary Arterialization and Sprouting Angiogenesis. Circulation, 112(25), 3937–3946
10. M Waqar, D Lewis, E Agushi, et al. Cerebral and tumoral blood flow in adult gliomas: a systematic review of results from magnetic resonance imaging. Br J Radiol 2021, 94 (1125):20201450
11. Xu Q, Liu Q, Ge H, et al. (2017). Tumor recurrence versus treatment effects in glioma. Medicine, 96(50), e9332
12. VA. Larsen, HJ Simonsen, I Law, et al. Evaluation of dynamic contrast-enhanced T1-weighted perfusion MRI in the differentiation of tumor recurrence from radiation necrosis. Neuroradiology (2013) 55:361–369
Figures
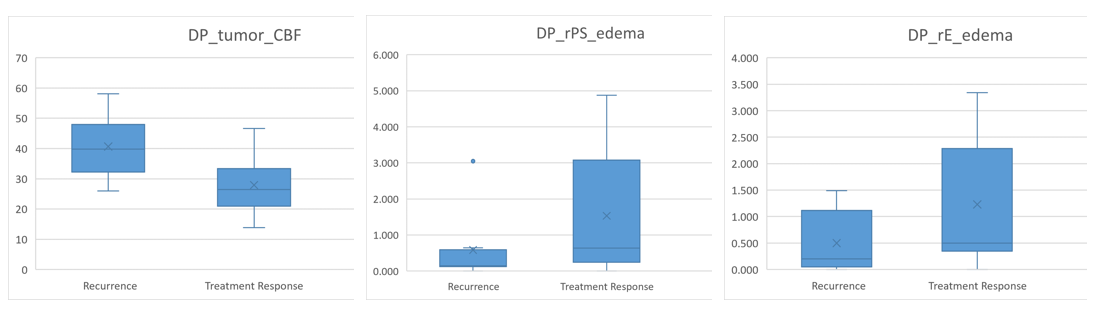
Figure 1 Boxplots of parameters deriving from distributed parameter (DP) model