5114
Echo-time dependence of microscopic fractional anisotropy using single-shot spiral encoding and free water elimination1Medical Biophysics, Schulich School of Medicine and Dentistry, Western University, London, ON, Canada, 2Centre for Functional and Metabolic Mapping, Robarts Research Institute, Western University, London, ON, Canada, 3The Brain and Mind Institute, Western University, London, ON, Canada, 4School of Biomedical Engineering, Western University, London, ON, Canada, 5Imaging Research Laboratories, Robarts Research Institute, Western University, London, ON, Canada
Synopsis
Keywords: Microstructure, Diffusion/other diffusion imaging techniques
Motivation: Understand echo time (TE) dependence of microscopic fractional anisotropy (µFA) in white matter (WM), cortical grey matter (GM), and deep GM.
Goal(s): Measure µFA at varying TEs and observe the trends in WM, cortical GM, and deep GM.
Approach: Healthy volunteers were scanned with dMRI at 3T using a spiral imaging sequence with linear tensor encoding and spherical tensor encoding. µFA was calculated with and without free water elimination (FWE).
Results: Linear regression fitting showed a downward trend in µFA in cortical GM and deep GM with increasing TE, both with and without FWE.
Impact: We observed reducing µFA with increasing TE in grey matter for the first time, which was enabled by a spiral readout that greatly reduced the minimum TE (~20 ms). This TE-dependence can potentially be exploited for improved microstructural modelling.
Introduction
Diffusion magnetic resonance imaging (dMRI) sensitizes MRI contrast to the diffusion of water molecules. The diffusive motion of water is inhibited by cellular microstructure and, accordingly, dMRI is a promising method for characterizing axon density. Fractional anisotropy (FA) is a dMRI parameter that describes the directionality of water movement; however, FA is reduced when axons with different directions are present in the same voxel, making it also sensitive to fibre orientation dispersion. Microscopic fractional anisotropy (µFA) is a recently developed diffusion MRI (dMRI) parameter that overcomes the confounding of fibre orientation sensitivity while still being sensitive to axon density 1,2, potentially making it more specific to axon integrity. Notably, TE-dependence of standard diffusion parameters, which is due to differing T2 between different microstructural compartments, can be exploited in microstructural modelling3. However, the TE-dependence for more advanced parameters such as µFA is unknown, and it is difficult to explore TE-dependence due to the long echo times required for b-tensor encoding. Accordingly, we combined µFA with a single-shot spiral MRI acquisition, which allows for large reductions in TE without compromising resolution. Another potential issue is that cerebrospinal fluid (CSF) in the brain can cause partial volume effects confounding our measurements, which is of particular concern in the cortex. Thus, we also employ free water elimination (FWE) to mitigate the confounding effects of CSF4.Methods
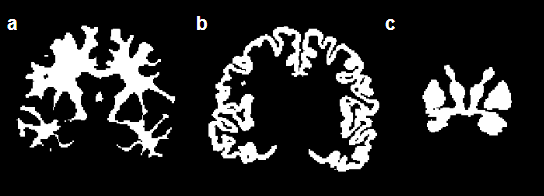
dMRI was implemented at 3T (Siemens Prisma) with a single-shot spiral sequence with linear tensor encoding (LTE; standard diffusion encoding) and spherical tensor encoding (STE; b-tensor encoding required for µFA) at variable b-values (Figure 1). Five healthy subjects with informed consent were scanned with 1.5 mm isotropic resolution at TE = 76ms, 86ms, 96ms, and 106ms, using rate 2 simultaneous multislice (SMS) excitation, with 11 minutes of scan time per scan, for whole-brain coverage. T1 weighted images were acquired for registration and brain segmentation. Field monitoring (Skope Clip-On Camera) was performed on an identical acquisition and used to correct for field perturbations from sources such as eddy currents, a B0 map was used in an expanded encoding model, and the MatMRI toolbox was used for image reconstruction5. Brain images were registered using FSL6, and segmented using Freesurfer7 (Figure 2). Images were segmented into global white matter (WM), cortical grey matter (GM), and deep GM. µFA with and without free water elimination was computed using MatMRI4,5. Linear regression was calculated for µFA versus TE in the three regions of interest (ROI).Results
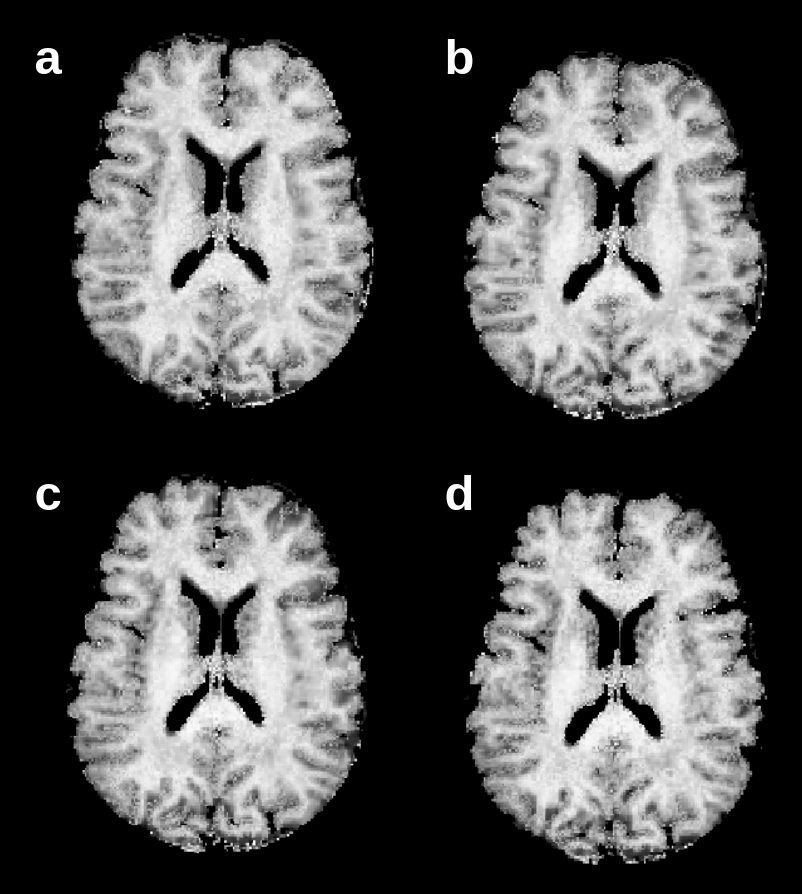
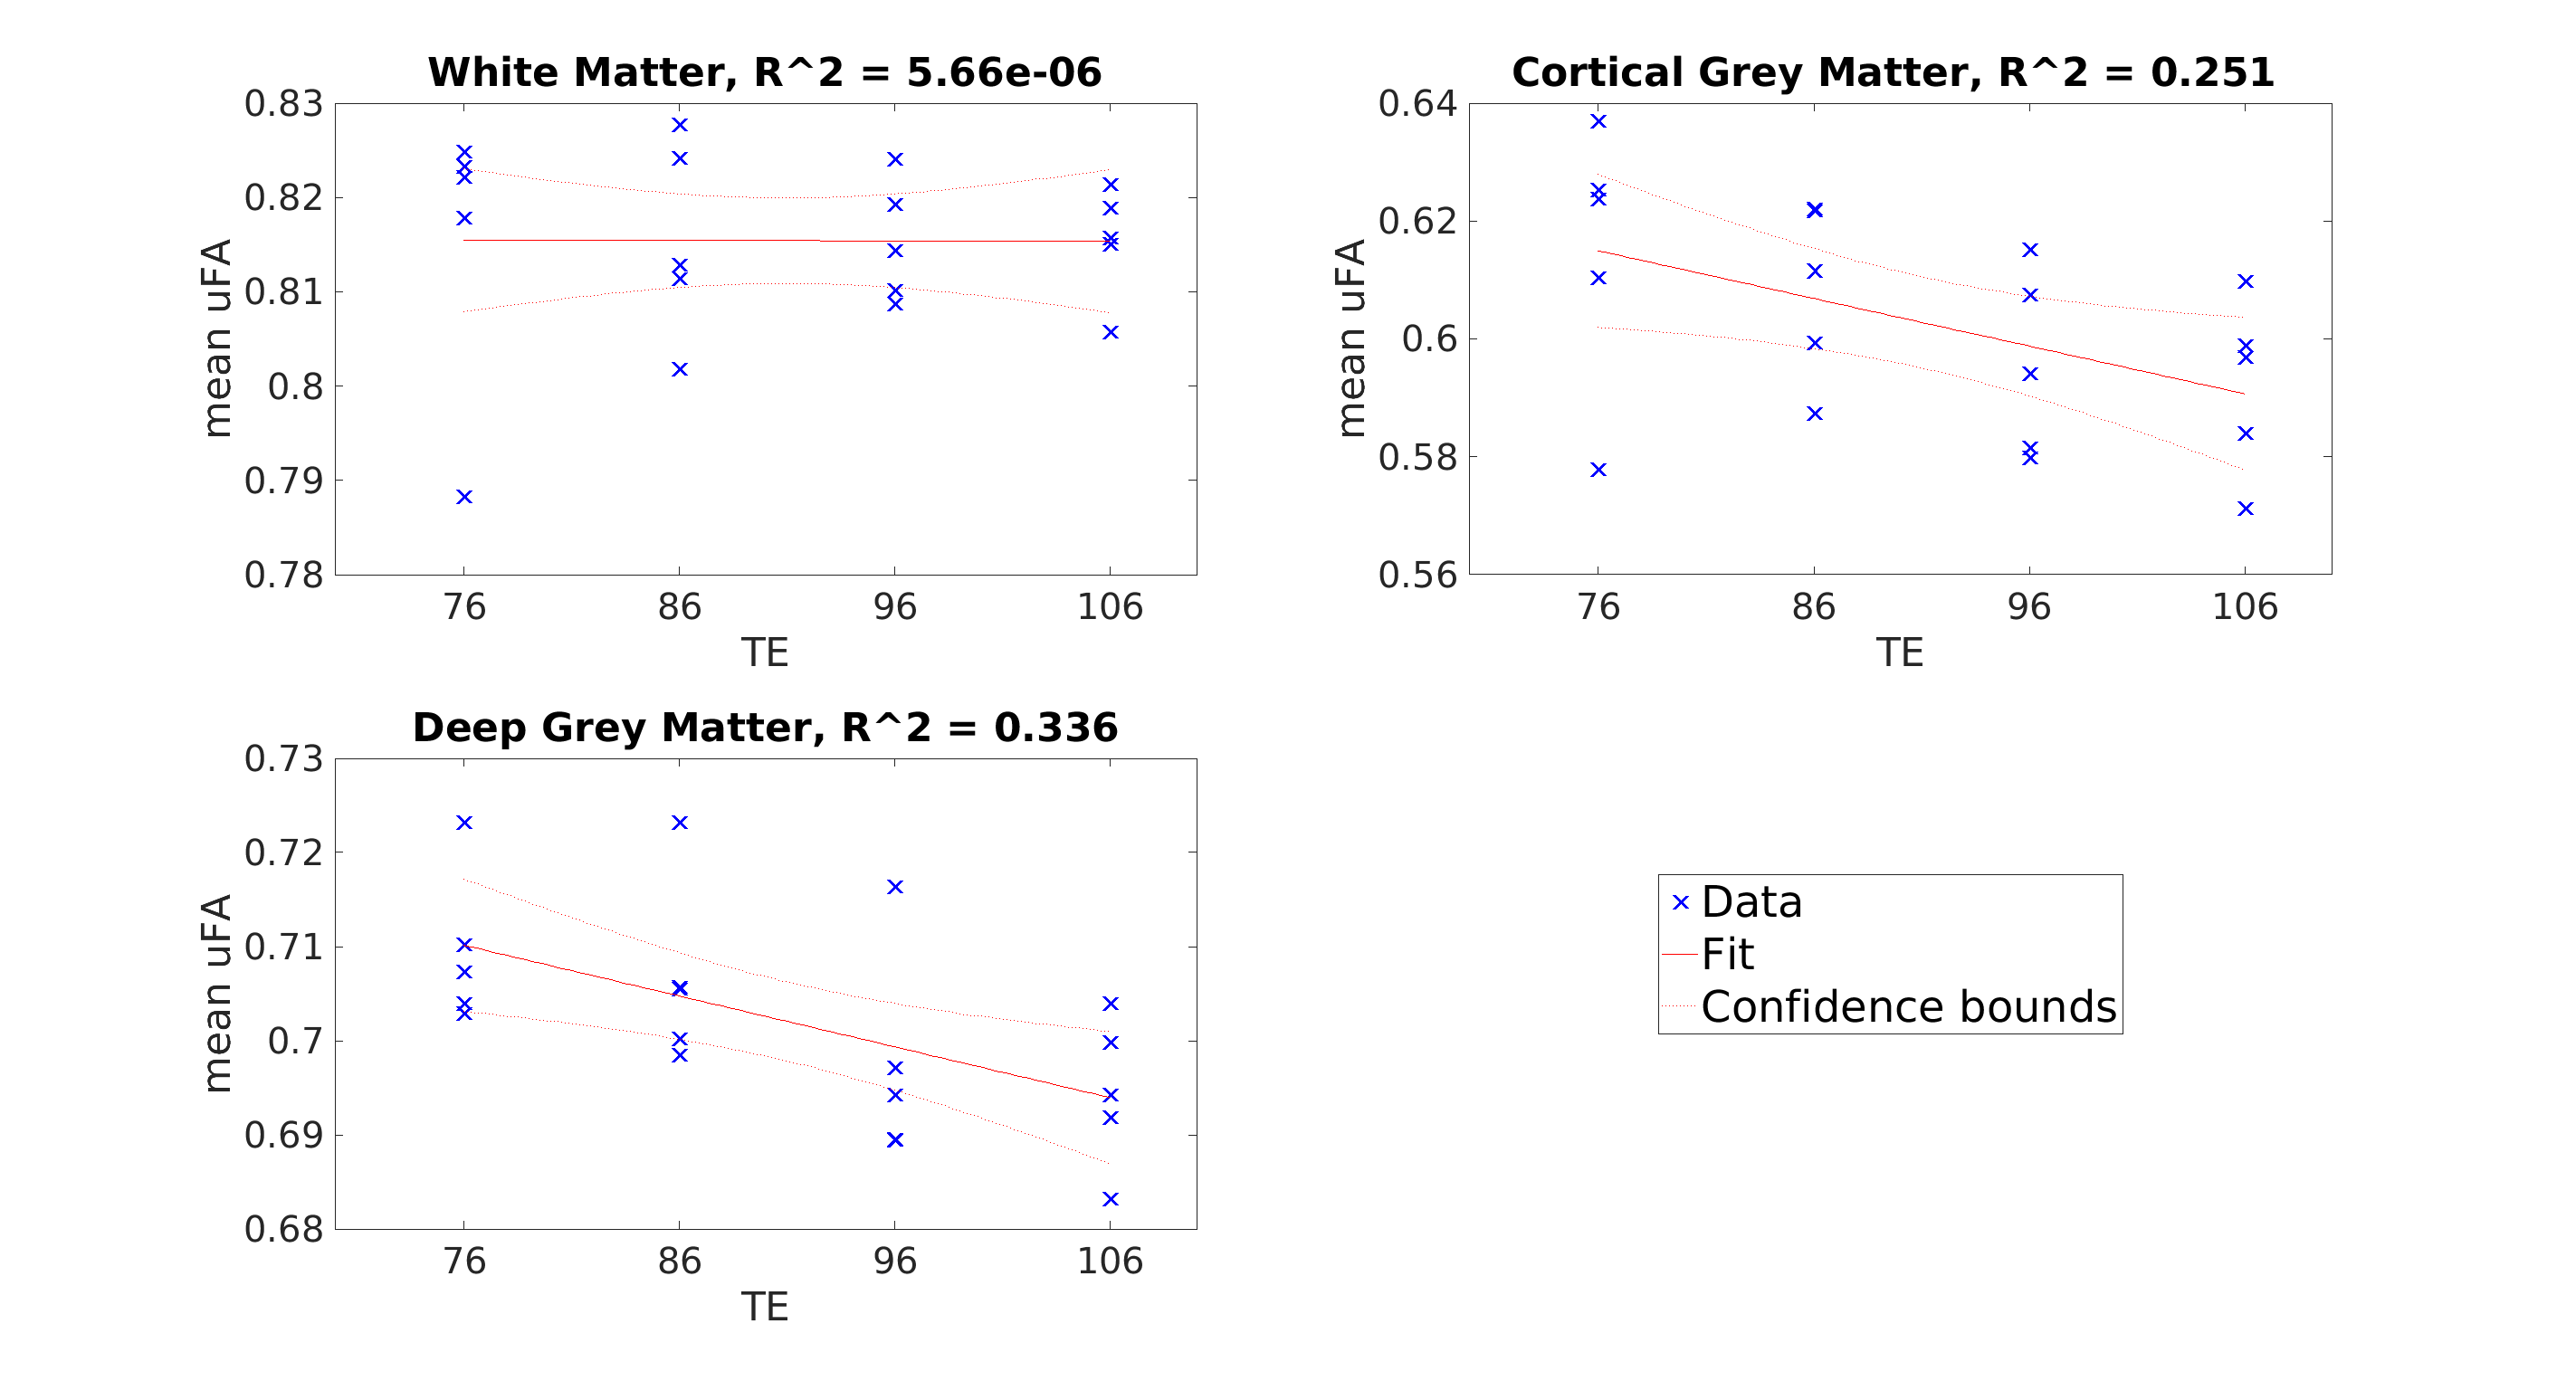
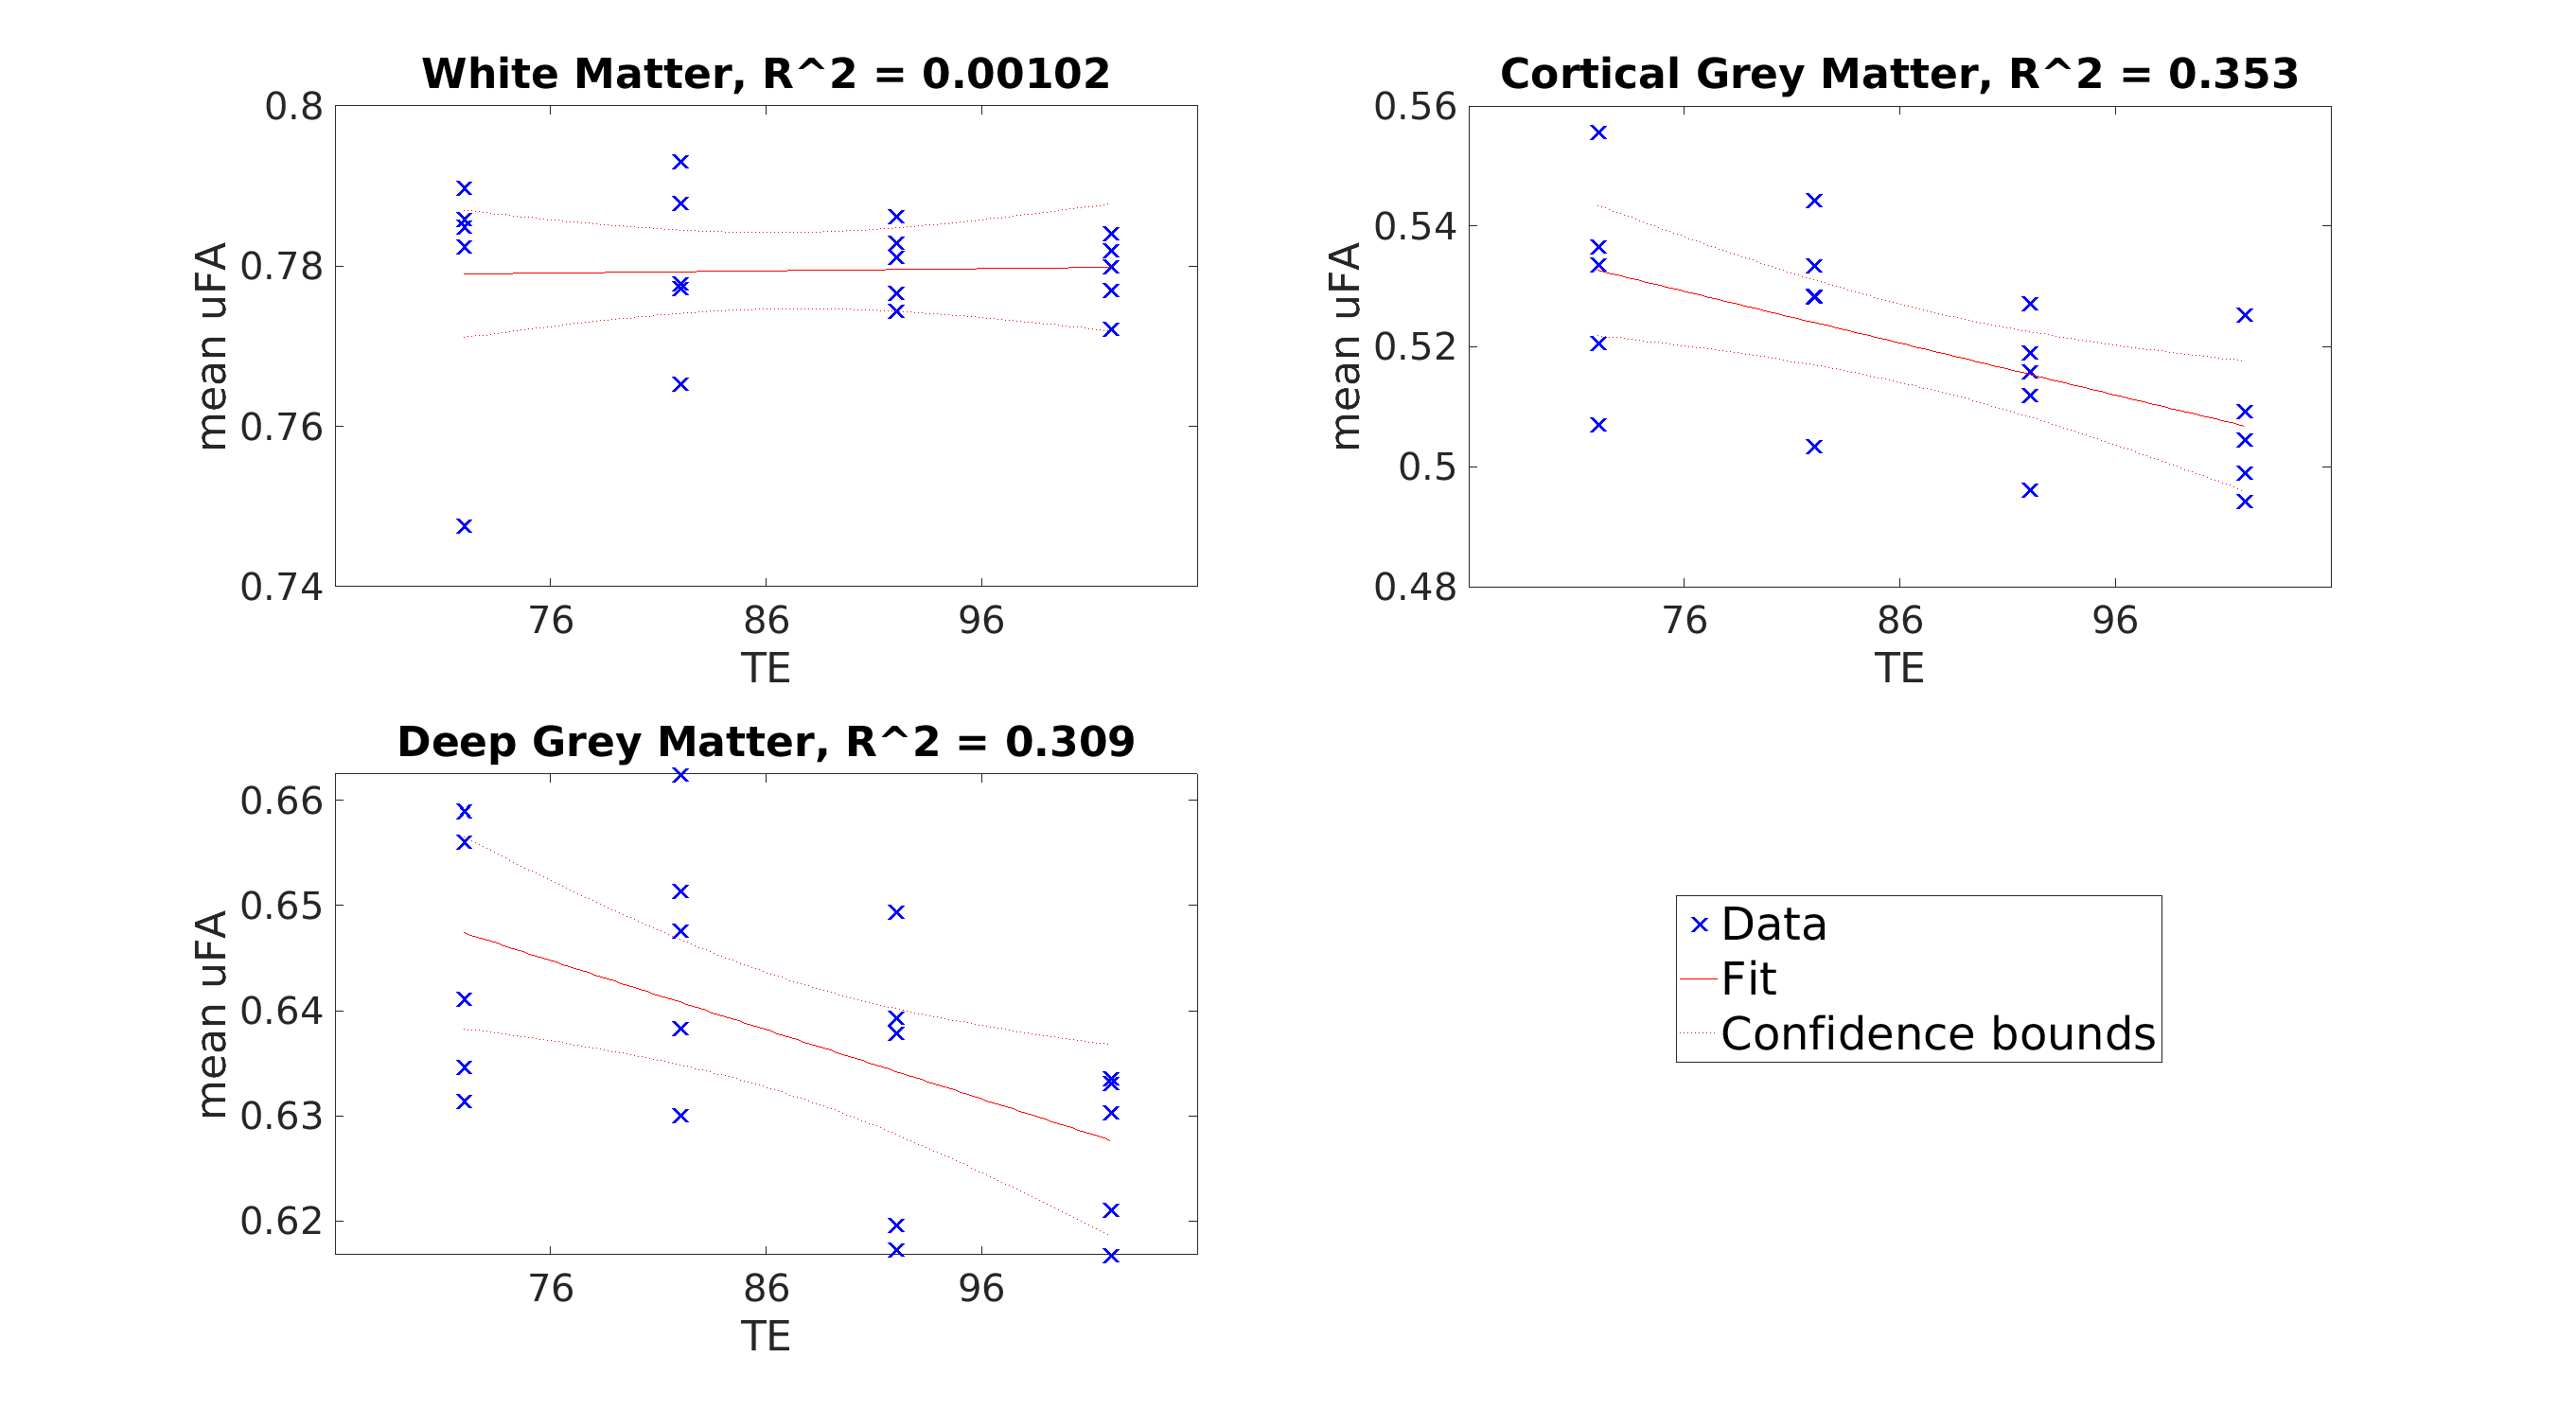
µFA was the highest in WM, followed by deep GM, and cortical GM. From a TE of 76ms to 106ms, mean µFA averaged 0.815 for both TEs in WM, decreased from 0.615 to 0.592 in cortical GM, and decreased from 0.710 to 0.695 in deep GM (Figure 4). While not qualitatively easy to visualize (Figure 3), a linear regression fitting showed a downward trend in µFA in cortical GM, and deep GM as TE increased (Figure 4). Similar trends were observed when free water elimination was not used (Figure 5)Discussion
The decreasing µFA with increasing TE suggests that microstructure with high µFA is associated with shorter T2. This result is consistent with other work showing shorter T2 in axons with smaller diameters, which can be explained by stronger surface-relaxation effects3. That is, losing signal from the smallest axons as TE is increased is consistent with the reductions in µFA that were observed. Having a stronger TE-dependence in GM compared to WM is consistent with observations that thinner axons are generally found in the GM where conduction distances are shorter and more branching occurs8. A potential limitation is the decreasing signal-to-noise ratio (SNR) as TE is increased. However, the SNR is higher in the cortical GM compared to WM in the raw DWI images, which suggests the decreases in GM are not artefacts of decreasing SNR since the same trend was not observed in WM. The same trends with TE were observed regardless of whether FWE was used, and the generally lower µFA when FWE is not used was expected due to partial volume contamination from CSF, particularly in the cortical GM.Conclusion
In this work, we observed a change in µFA at different TEs in GM but not in WM. This TE-dependence can potentially be exploited for microstructural modelling. Future work will look at assessing more subjects and capitalize on the relatively high resolution of 1.5 mm by investigating regional variability to better understand the µFA dependence on TE.Acknowledgements
This work was supported by the Canada First Research Excellence Fund to BrainsCAN, Project Grants from the Canadian Institutes of Health Research (CIHR), and the Natural Sciences and Engineering Research Council (NSERC) Graduate Scholarships.References
1. Arezza, N. J. J., Tse, D. H. Y. & Baron, C. A. Rapid microscopic fractional anisotropy imaging via an optimized linear regression formulation. Magn. Reson. Imaging 80, 132–143 (2021).
2. Lasič, S., Szczepankiewicz, F., Eriksson, S., Nilsson, M. & Topgaard, D. Microanisotropy imaging: quantification of microscopic diffusion anisotropy and orientational order parameter by diffusion MRI with magic-angle spinning of the q-vector. Frontiers in Physics 2, (2014).
3. Barakovic, M. et al. Resolving bundle-specific intra-axonal T2 values within a voxel using diffusion-relaxation tract-based estimation. Neuroimage 227, 117617 (2021).
4. Arezza, N. J. J., Santini, T., Omer, M. & Baron, C. A. Estimation of free water-corrected microscopic fractional anisotropy. Front. Neurosci. 17, 1074730 (2023).
5. Varela-Mattatall, G. et al. Single-shot spiral diffusion-weighted imaging at 7T using expanded encoding with compressed sensing. Magn. Reson. Med. 90, 615–623 (2023).
6. Jenkinson, M., Bannister, P., Brady, M. & Smith, S. Improved optimization for the robust and accurate linear registration and motion correction of brain images. Neuroimage 17, 825–841 (2002).
7. Billot, B. et al. Robust machine learning segmentation for large-scale analysis of heterogeneous clinical brain MRI datasets. Proc. Natl. Acad. Sci. U. S. A. 120, e2216399120 (2023).
8. Zikopoulos, B., García-Cabezas, M. Á. & Barbas, H. Parallel trends in cortical gray and white matter architecture and connections in primates allow fine study of pathways in humans and reveal network disruptions in autism. PLoS Biol. 16, e2004559 (2018).
Figures