5113
Exploring Brain Microstructure with Ultra-high b-values Diffusion MRI: A NODDI Model Comparison1Center for Brain Imaging Science and Technology, Zhejiang University, Hangzhou, China, 2College of Biomedical Engineering and Instrument Science, Zhejiang University, Hangzhou, China, 3Department of Imaging Sciences, University of Rochester, Rochester, NY, United States, 4Department of Computer Science & Centre for Medical Image Computing, University College London, London, United Kingdom, 5School of Physics, Zhejiang University, Hangzhou, China, 6State Key Laboratory of Brain-Machine Intelligence, Zhejiang University, Hangzhou, China
Synopsis
Keywords: Microstructure, Data Analysis, Ultra-high b-values, NODDI
Motivation: The benefits of using ultra-high b-values diffusion MRI (b>6000s/mm2) on characterizing and resolving brain microstructure are still unclear.
Goal(s): To determine if the NODDI metrics computed from ultra-high b-values can help characterizing and providing more biological information related to brain microstructure.
Approach: NODDI metrics are compared between different b-schemes, and between the corpus callosum and hippocampal subfields.
Results: NODDI metrics computed with ultra-high b-value data can help characterize different subfields. Higher NDI and ODI differences in the corpus callosum and hippocampal subfields are observed with larger b-values.
Impact: We show that NODDI models can work with ultra-high b-values and help characterizing and providing more biological information related to brain microstructure.
INTRODUCTION
Numerous studies have highlighted the importance of ultra-high b-values (b>6000s/mm2) in diffusion MRI1. In addition, it is known that ultra-high b-values can help resolving complex fiber orientations2. However, the benefit of using ultra-high b-values for differentiating brain microstructure remained unclear, and how much ultra-high b-values can help resolving more microstructure is still an open question.Neurite orientation dispersion and density imaging (NODDI)3 is one of the most commonly used models for estimating brain microstructure. With this model, neurite density index (NDI) and orientation dispersion index (ODI) can be estimated, which reflect brain microstructure characteristics.
In this study, we aim to determine if the NODDI metrics computed from ultra-high b-value data, can enhance the differentiation among different microstructure and resolving more information about brain microstructure.
METHODS
The ultra-high b-values data from the preprocessed MGH Connectome Diffusion Microstructure Dataset (CDMD)4, acquiring on 26 healthy subjects with the highest b-value of 17800 s/mm2 is used in this study. Two different subsampled datasets, each with different maximum b-values (b = 6750, 9850 s/mm2), as listed in Table 1 are created, to determine the change of NODDI metrics and if more information about brain microstructure can be resolved with increasing ultra-high b-values. Subsequently, the two sub-sampled datasets are fitted with the NODDI toolbox implemented in MATLAB 2018 (MathWorks, Natick, MA, USA) using default setting for in vivo tissue.To observe the effect of ultra-high b-values on characterizing the brain microstructure, one conventional b-values (b < 3500 s/mm2) is added to make a comparison with ultra-high b-values, with two regions of interests are selected, namely the corpus callosum and hippocampus. The corpus callosum subregions are extracted using the JHU ICBM-DTI-81 white matter labels atlas5, and the hippocampal subfields are extracted with the Jülich histological atlas6 (Fig. 1). NODDI metrics between different b-schemes and between different subregions/subfields are compared using paired-t-Test with Bonferroni correction.
RESULTS
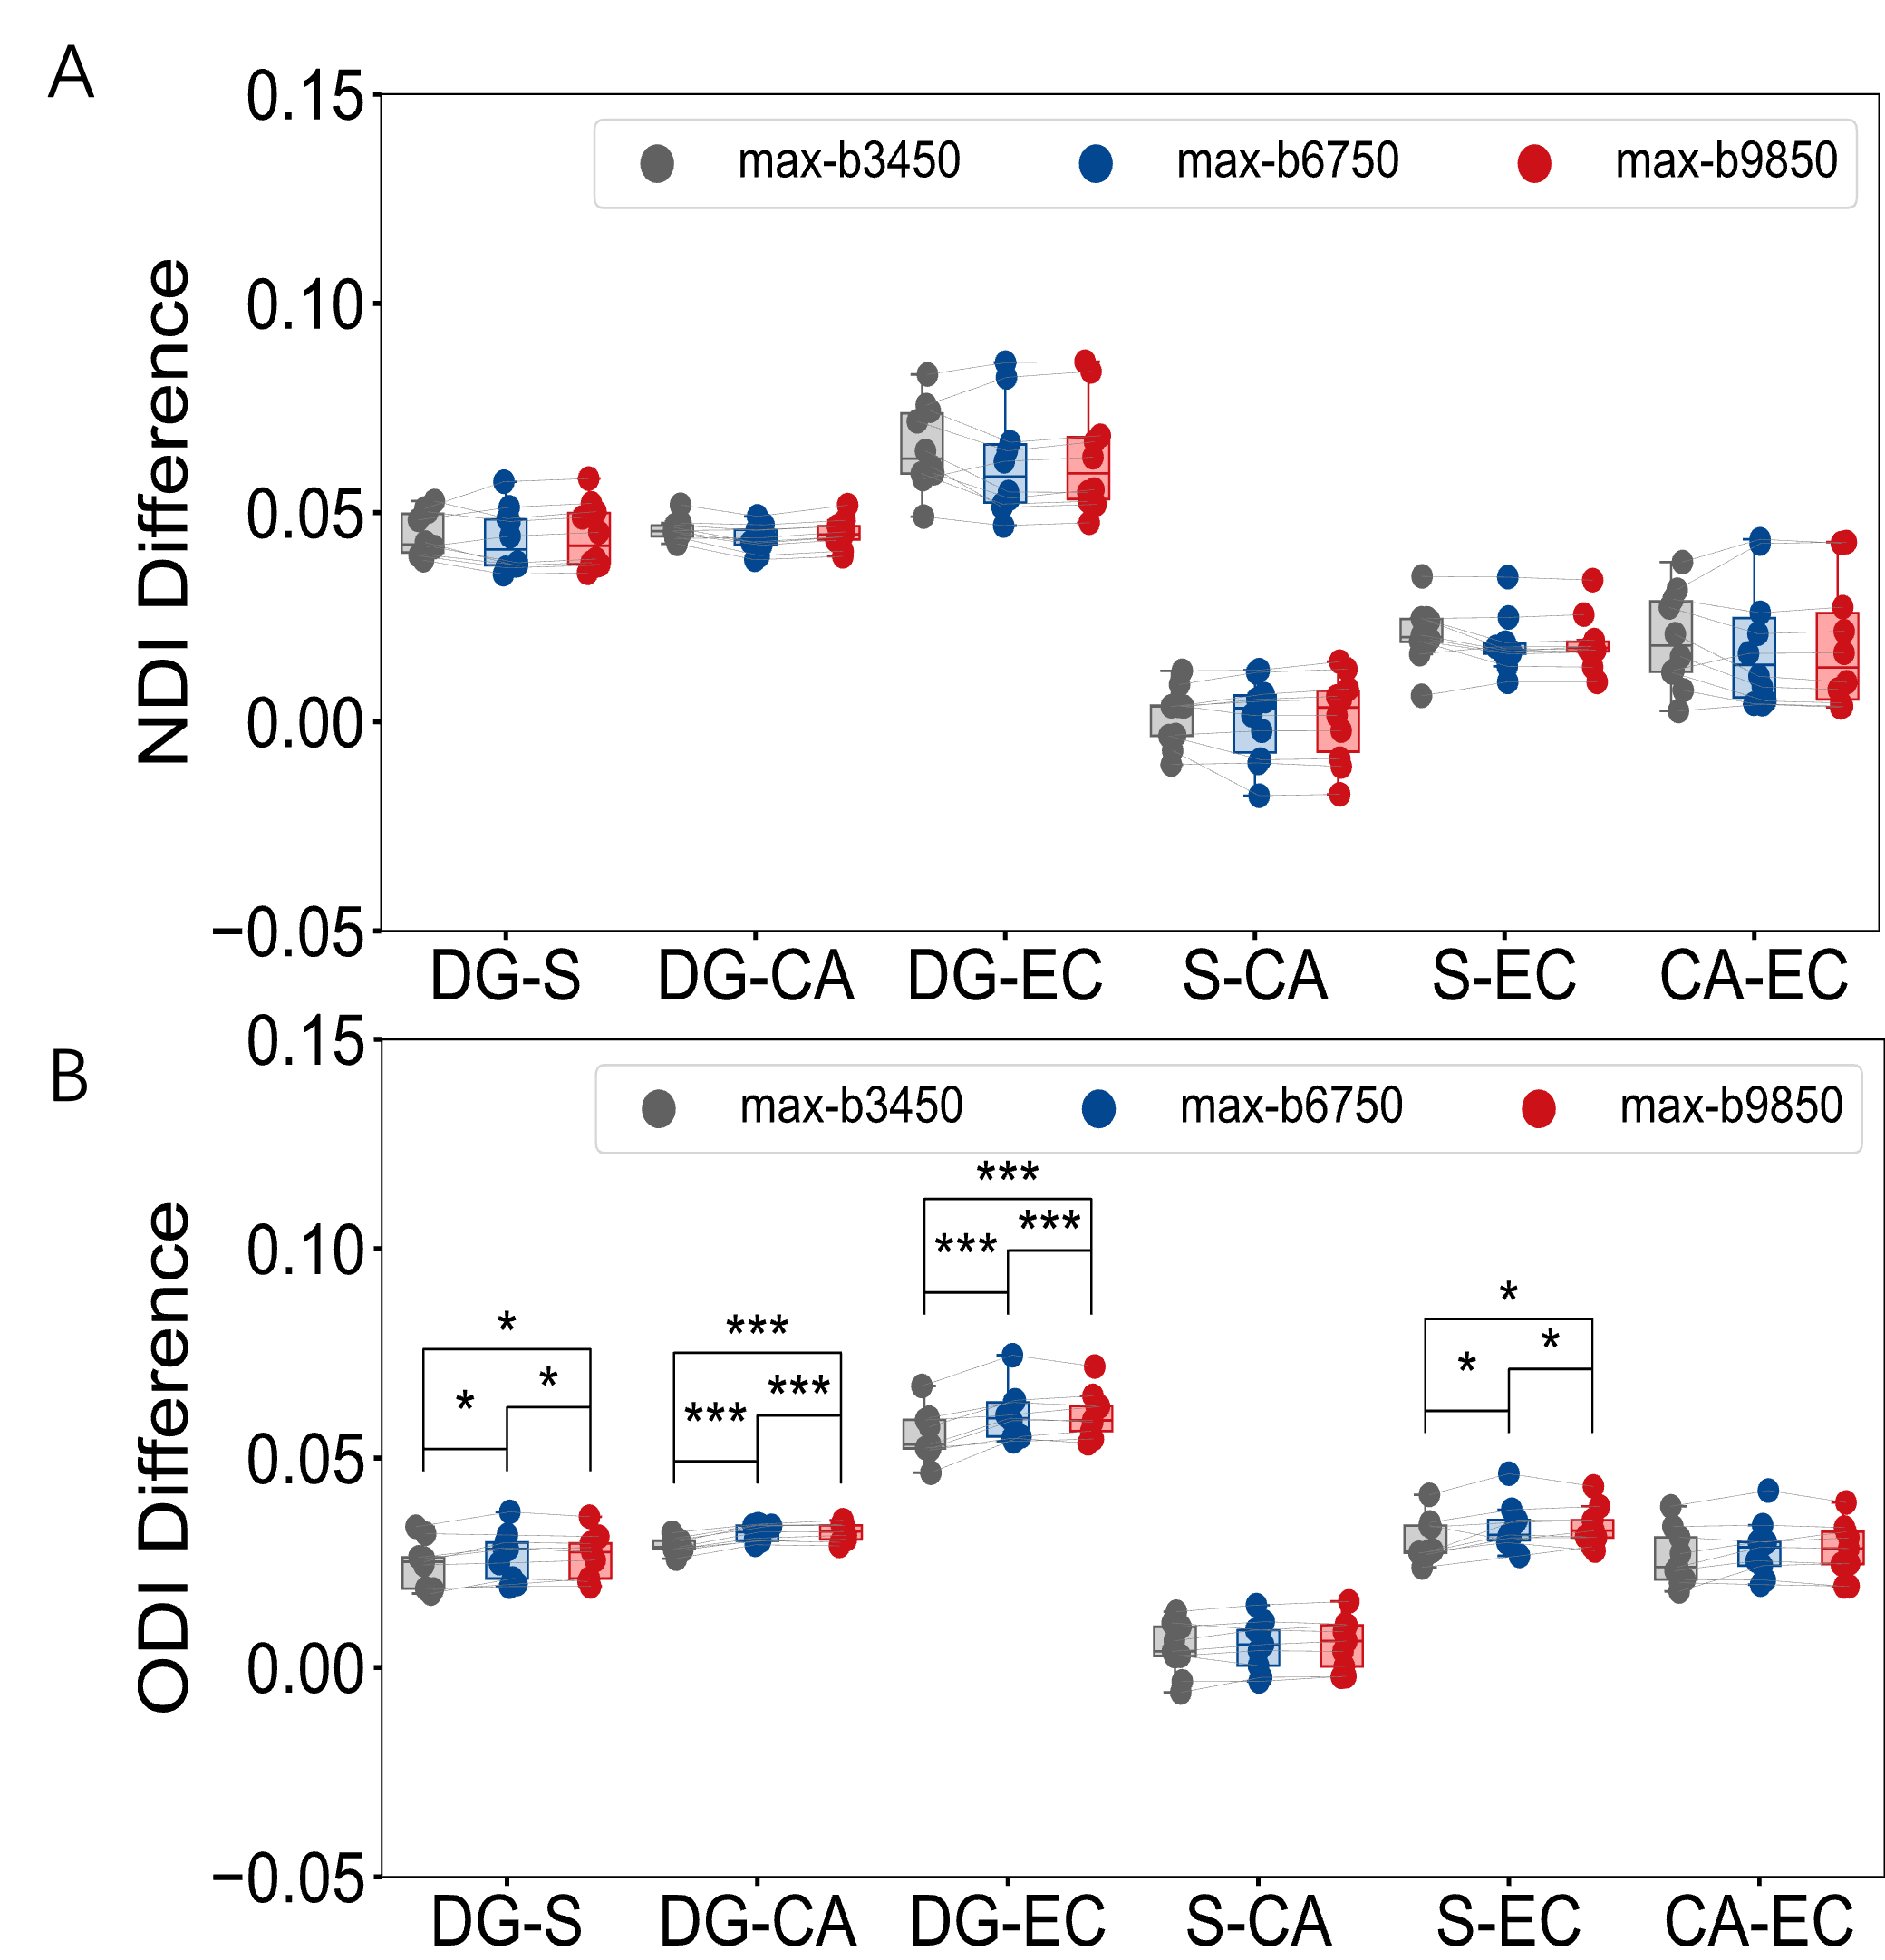
Using the ultra-high b-values, the segregation of SCC from BCC and GCC is clearly illustrated through both NODDI metrics (Fig. 2A and B), while BCC can only be differentiated from GCC with ODI (Fig. 2B). In addition, different hippocampal subfields can also be characterized with both NODDI metrics (Fig. 2C and D).The impact of ultra-high b-values on microstructure differentiation is further investigated through NDI and ODI differences among the corpus callosum subregions (Fig. 3) and hippocampal subfields (Fig. 4). Ultra-high b-values improve the differentiation of BCC from GCC and SCC through NDI difference (Fig. 3A), as compared to conventional b-values of 3450 s/mm2. Similarly, the differentiation between hippocampal subfields is also enhanced through ODI difference (Fig. 4B).
In addition, significant NDI and ODI differences between b = 6750 and b = 9850 s/mm2 are also demonstrated in the corpus callosum and hippocampus (Fig. 3A and 4B), indicating that microstructure can be further resolved by increasing the ultra-high b-value.
DISCUSSION
The trend of NDI and ODI in the corpus callosum subregions (Fig. 2A and B), is highly consistent with previous findings from7–9, and the differentiation between corpus callosum subregions (Fig. 3A) and hippocampal subfields (Fig. 4B) using NODDI metrics computed from ultra-high b-values is enhanced when comparing with the conventional b-values10. This finding indicates that a better brain characterization can be obtained with ultra-high b-values.In addition, significant NDI and ODI differences in the corpus callosum and hippocampus are demonstrated when ultra-high b-values are increased from b = 6750 to b = 9850 s/mm2. Therefore, this result illustrates that more microstructure can be resolved with higher b-values, in which may be reflected to known cytoarchitecture, and may be the behind reason of better brain characterization.
CONCLUSION
We show that the NODDI model with ultra-high b-values can help with brain microstructure characterization and more biological information related to brain microstructure can be resolved.Acknowledgements
This work was supported by the National Key R&D Program of China (2020AAA0109502), National Natural Science Foundation of China (82372036), the Fundamental Research Funds for the Central Universities (226-2023-00095) and Key Research Project of Zhejiang Lab (No. 2022ND0AC01).References
1. Wongkornchaovalit P, Feng M, He H, Zhong J. Diffusion MRI With High to Ultrahigh b-Values: How It Will Benefit the Discovery of Brain Microstructure and Pathological Changes. Investig Magn Reson Imaging. 2022;26:200.
2. Fan Q, Eichner C, Afzali M, Mueller L, Tax CMW, Davids M, et al. Mapping the human connectome using diffusion MRI at 300 mT/m gradient strength: Methodological advances and scientific impact. Neuroimage. 2022;254:118958.
3. Zhang H, Schneider T, Wheeler-Kingshott CA, Alexander DC. NODDI: practical in vivo neurite orientation dispersion and density imaging of the human brain. Neuroimage. 2012;61:1000–16.
4. Tian Q, Fan Q, Witzel T, Polackal MN, Ohringer NA, Ngamsombat C, et al. Comprehensive diffusion MRI dataset for in vivo human brain microstructure mapping using 300 mT/m gradients. Sci Data. 2022;9:7.
5. Mori S, editor. MRI atlas of human white matter. 1. ed. Amsterdam Oxford: Elsevier; 2005. 237 p.
6. Amunts K, Mohlberg H, Bludau S, Zilles K. Julich-Brain: A 3D probabilistic atlas of the human brain’s cytoarchitecture. Science. 2020;369:988–92.
7. Aboitiz F, Scheibel AB, Fisher RS, Zaidel E. Fiber composition of the human corpus callosum. Brain Research. 1992;598:143–53.
8. Lynn JD, Anand C, Arshad M, Homayouni R, Rosenberg DR, Ofen N, et al. Microstructure of Human Corpus Callosum across the Lifespan: Regional Variations in Axon Caliber, Density, and Myelin Content. Cerebral Cortex. 2021;31:1032–45.
9. Friedrich P, Fraenz C, Schlüter C, Ocklenburg S, Mädler B, Güntürkün O, et al. The Relationship Between Axon Density, Myelination, and Fractional Anisotropy in the Human Corpus Callosum. Cerebral Cortex. 2020;30:2042–56.
10. Karat BG, DeKraker J, Hussain U, Köhler S, Khan AR. Mapping the macrostructure and microstructure of the in vivo human hippocampus using diffusion MRI. Human Brain Mapping. 2023;44:5485–503.
Figures

Table 1. Two subsampled datasets with the varying maximum b-value (shown in Bold). Number of gradient directions is shown in the bracket after each b-value.

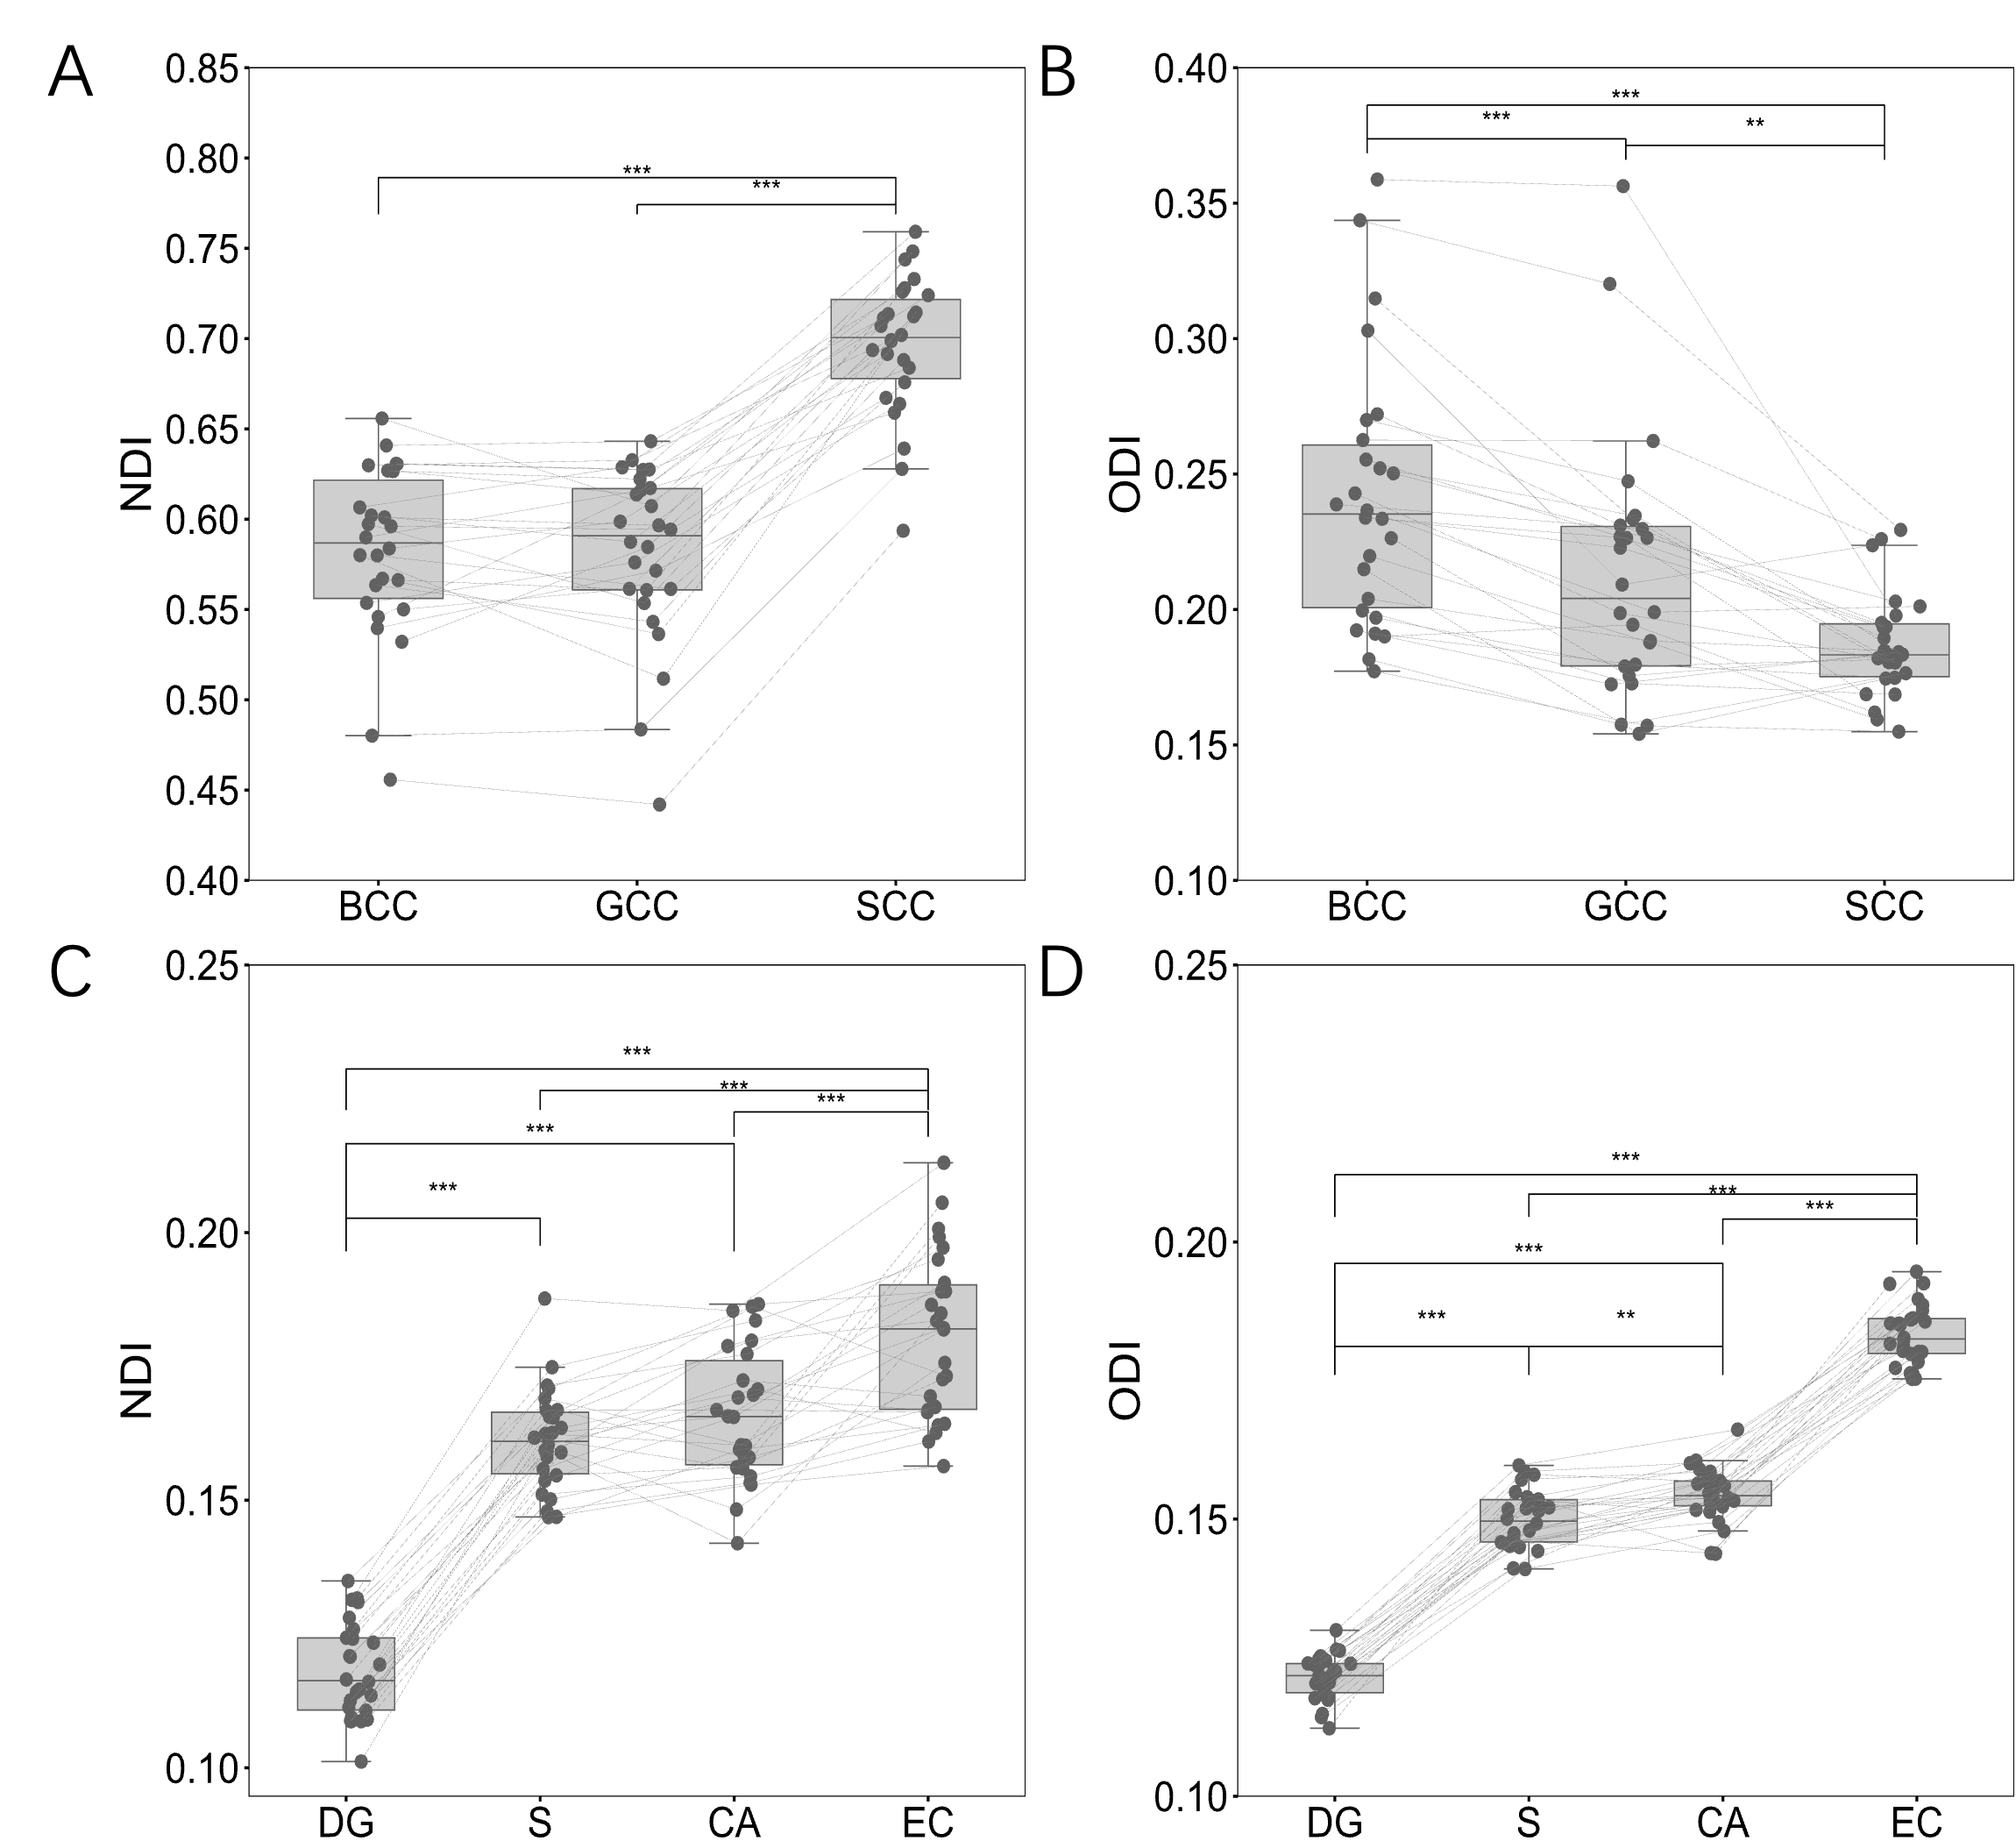
Fig. 2. Neurite density index (NDI) and neurite orientation dispersion index (ODI) computed from max-b = 9850 s/mm2in the corpus callosum subregions and hippocampal subfields. (A) NDI in the corpus callosum subregions; (B) ODI in the corpus callosum subregions; (C) NDI in the hippocampal subfields; (D) ODI in the hippocampal subfields. ** adjusted p < .01, *** adjusted p < .001
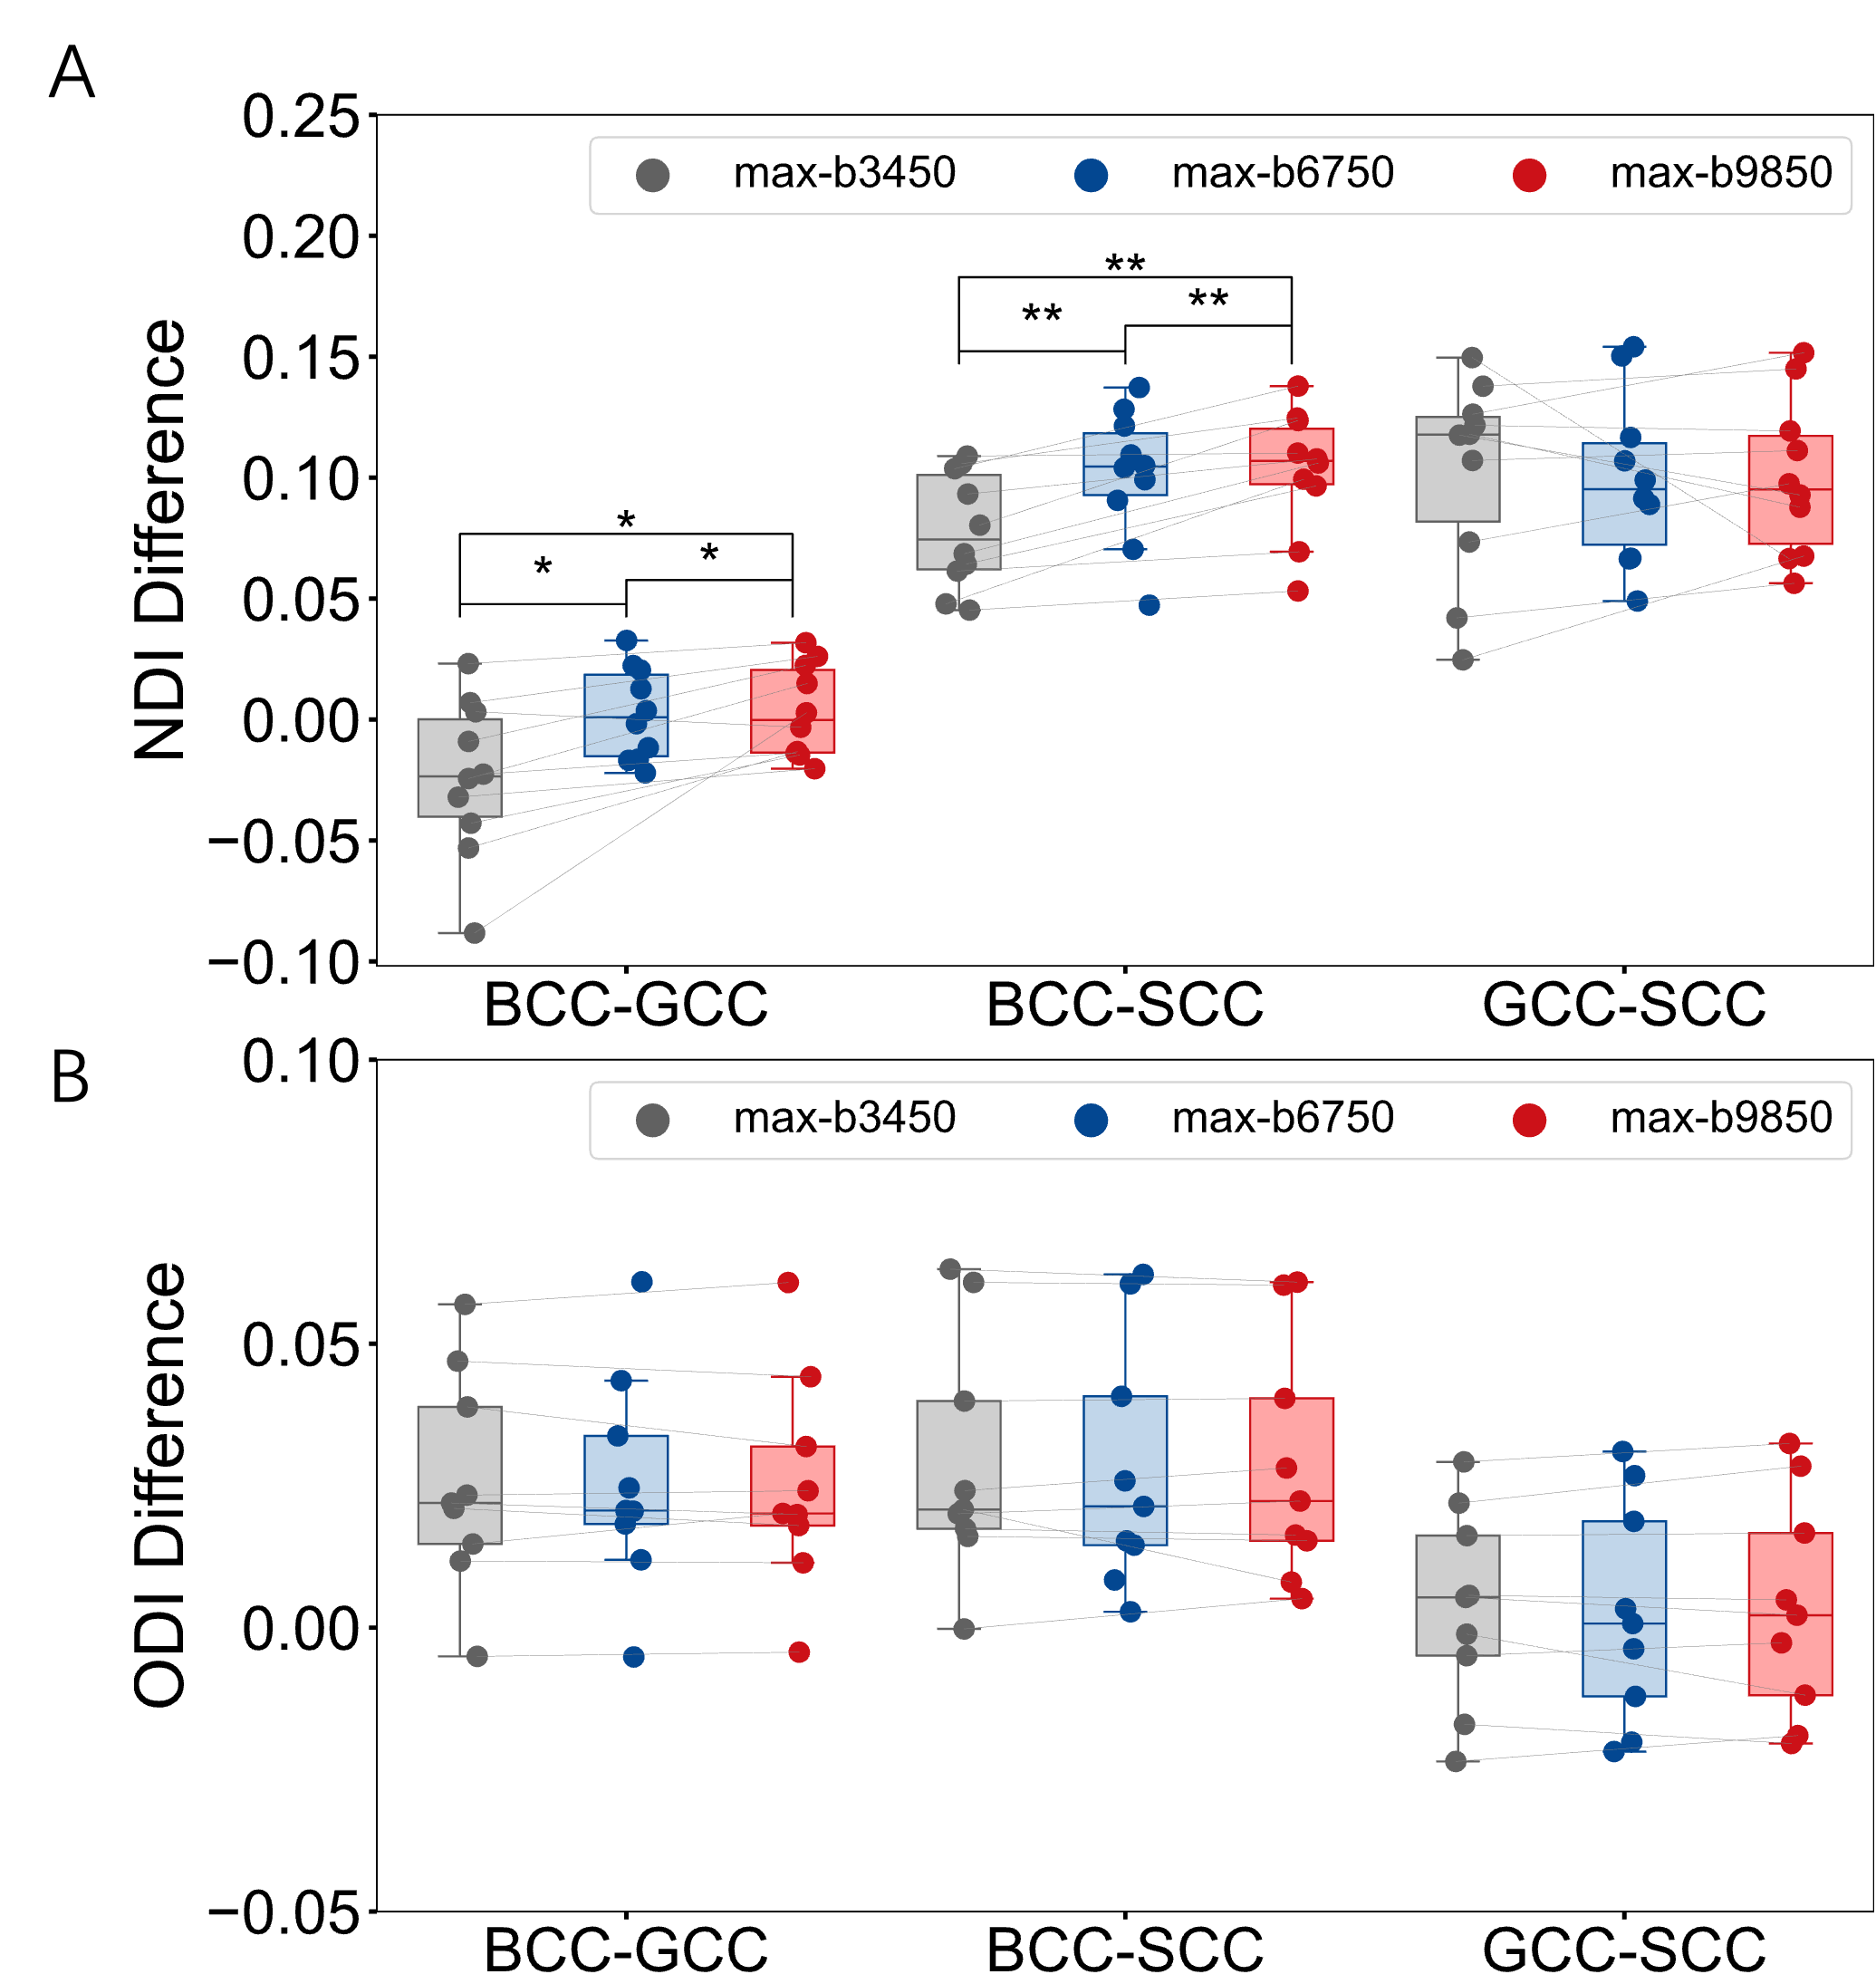
Fig. 3. (A) Effect of max-b on NDI for differentiating the corpus callosum subregions. (B) Effect of max-b on ODI for differentiating the corpus callosum subregions. * adjusted p < .05, ** adjusted p < .01