5112
Diffusion imaging of the brain at 3T and 7T: a comparison of metrics and reproducibility using a matched acquisition scheme1UCL Queen Square Institute of Neurology, University College London, London, United Kingdom, 2Imaging Neuroscience, UCL Queen Square Institute of Neurology, University College London, London, United Kingdom
Synopsis
Keywords: Diffusion Acquisition, High-Field MRI
Motivation: The SNR benefits of diffusion weighted imaging (DWI) at 7T are unclear. Previous studies comparing across field strengths involved varying scanner hardware and acquisition protocols.
Goal(s): To characterise the spatial SNR differences of brain DWI at 3T and 7T.
Approach: Participants were scanned back-to-back on 3T and 7T scanners with well-matched hardware and acquisition protocols. SNR and DTI metrics were compared between field strengths in white and grey matter regions.
Results: SNR is higher at 7T in WM but comparable or lower in GM. DTI metrics also vary between field strengths, and fitting error is lower at 7T.
Impact: This study indicates that there is tangible SNR benefit to studying white matter using diffusion-weighted imaging at 7T in humans. However, we caution researchers when studying grey matter structures, especially in the pallidum and close to the air-tissue interfaces.
Introduction
7T MRI has an intrinsic signal-to-noise ratio (SNR) advantage over 3T, enabling acquisitions of higher quality and resolution in clinically relevant scan times1. However, the actual SNR advantage is unclear for diffusion weighted imaging (DWI), as the potential increase in SNR may be negated by rapid T2 decay and pronounced susceptibility effects2. Previous studies have found differences in DWI at 3T and 7T MRI3,4,5 but the systems also varied in other aspects of hardware (e.g. gradient performance, RF coil design), making it difficult to disentangle the source of these differences. Here we compare DWI SNR and metrics on state-of-the-art 3T and 7T scanners with well-matched hardware and acquisition protocols, to determine if any observed systematic differences can be specifically attributed to field strength.Methods
Seven participants were scanned (4/3 male/female; age range [28-41]) on Siemens 3T Prisma and 7T Terra systems. Back-to-back DWI scans were acquired on each scanner (randomised order) across two sessions to assess reproducibility. Gradient performance for both scanners was the same (80mT/m max amplitude; 200mT/m/ms slew rate), while RF Transmit (Prisma: 2-channel body coil, Terra: 8-channel head coil, both operating in TrueForm mode to improve B1+ homogeneity) and RF Receive (Prisma: 64ch head/neck array, Terra: 32ch head only array) were different. A multi-band diffusion EPI sequence (provided by CMRR, University of Minnesota6) was used, with 1.5mm isotropic resolution, TE = 55/56ms (Terra/Prisma, due to differences in mechanical resonances), TR=4400ms (both systems), 96 slices, multiband/GRAPPA factor 2/3. Diffusion-weighting was applied using a single shell 64 x b=1000 s/mm2, resulting in a scan time of 5min 48s on both systems. 12 b=0 images were acquired to estimate SNR. For distortion correction, the full scan was repeated with opposite phase encoding direction (A>>P and P>>A). 3D T1-weighted volumetric images were acquired on both scanners for anatomical reference.DWI images were processed using eddy7 and TOPUP8 to correct for motion, eddy currents and susceptibility artefacts. SNR maps were extracted from eddy’s output (SNR=mean(b=0)/std(b=0)). The DTI model was fit using the weighted-least squares approach. Measures of fractional anisotropy (FA), mean diffusivity (MD), axial diffusivity (AxD), radial diffusivity (RD) and fitting error were extracted. Regional metrics were compared between 3T and 7T in white matter (WM)9 and grey matter (GM)10.
Results
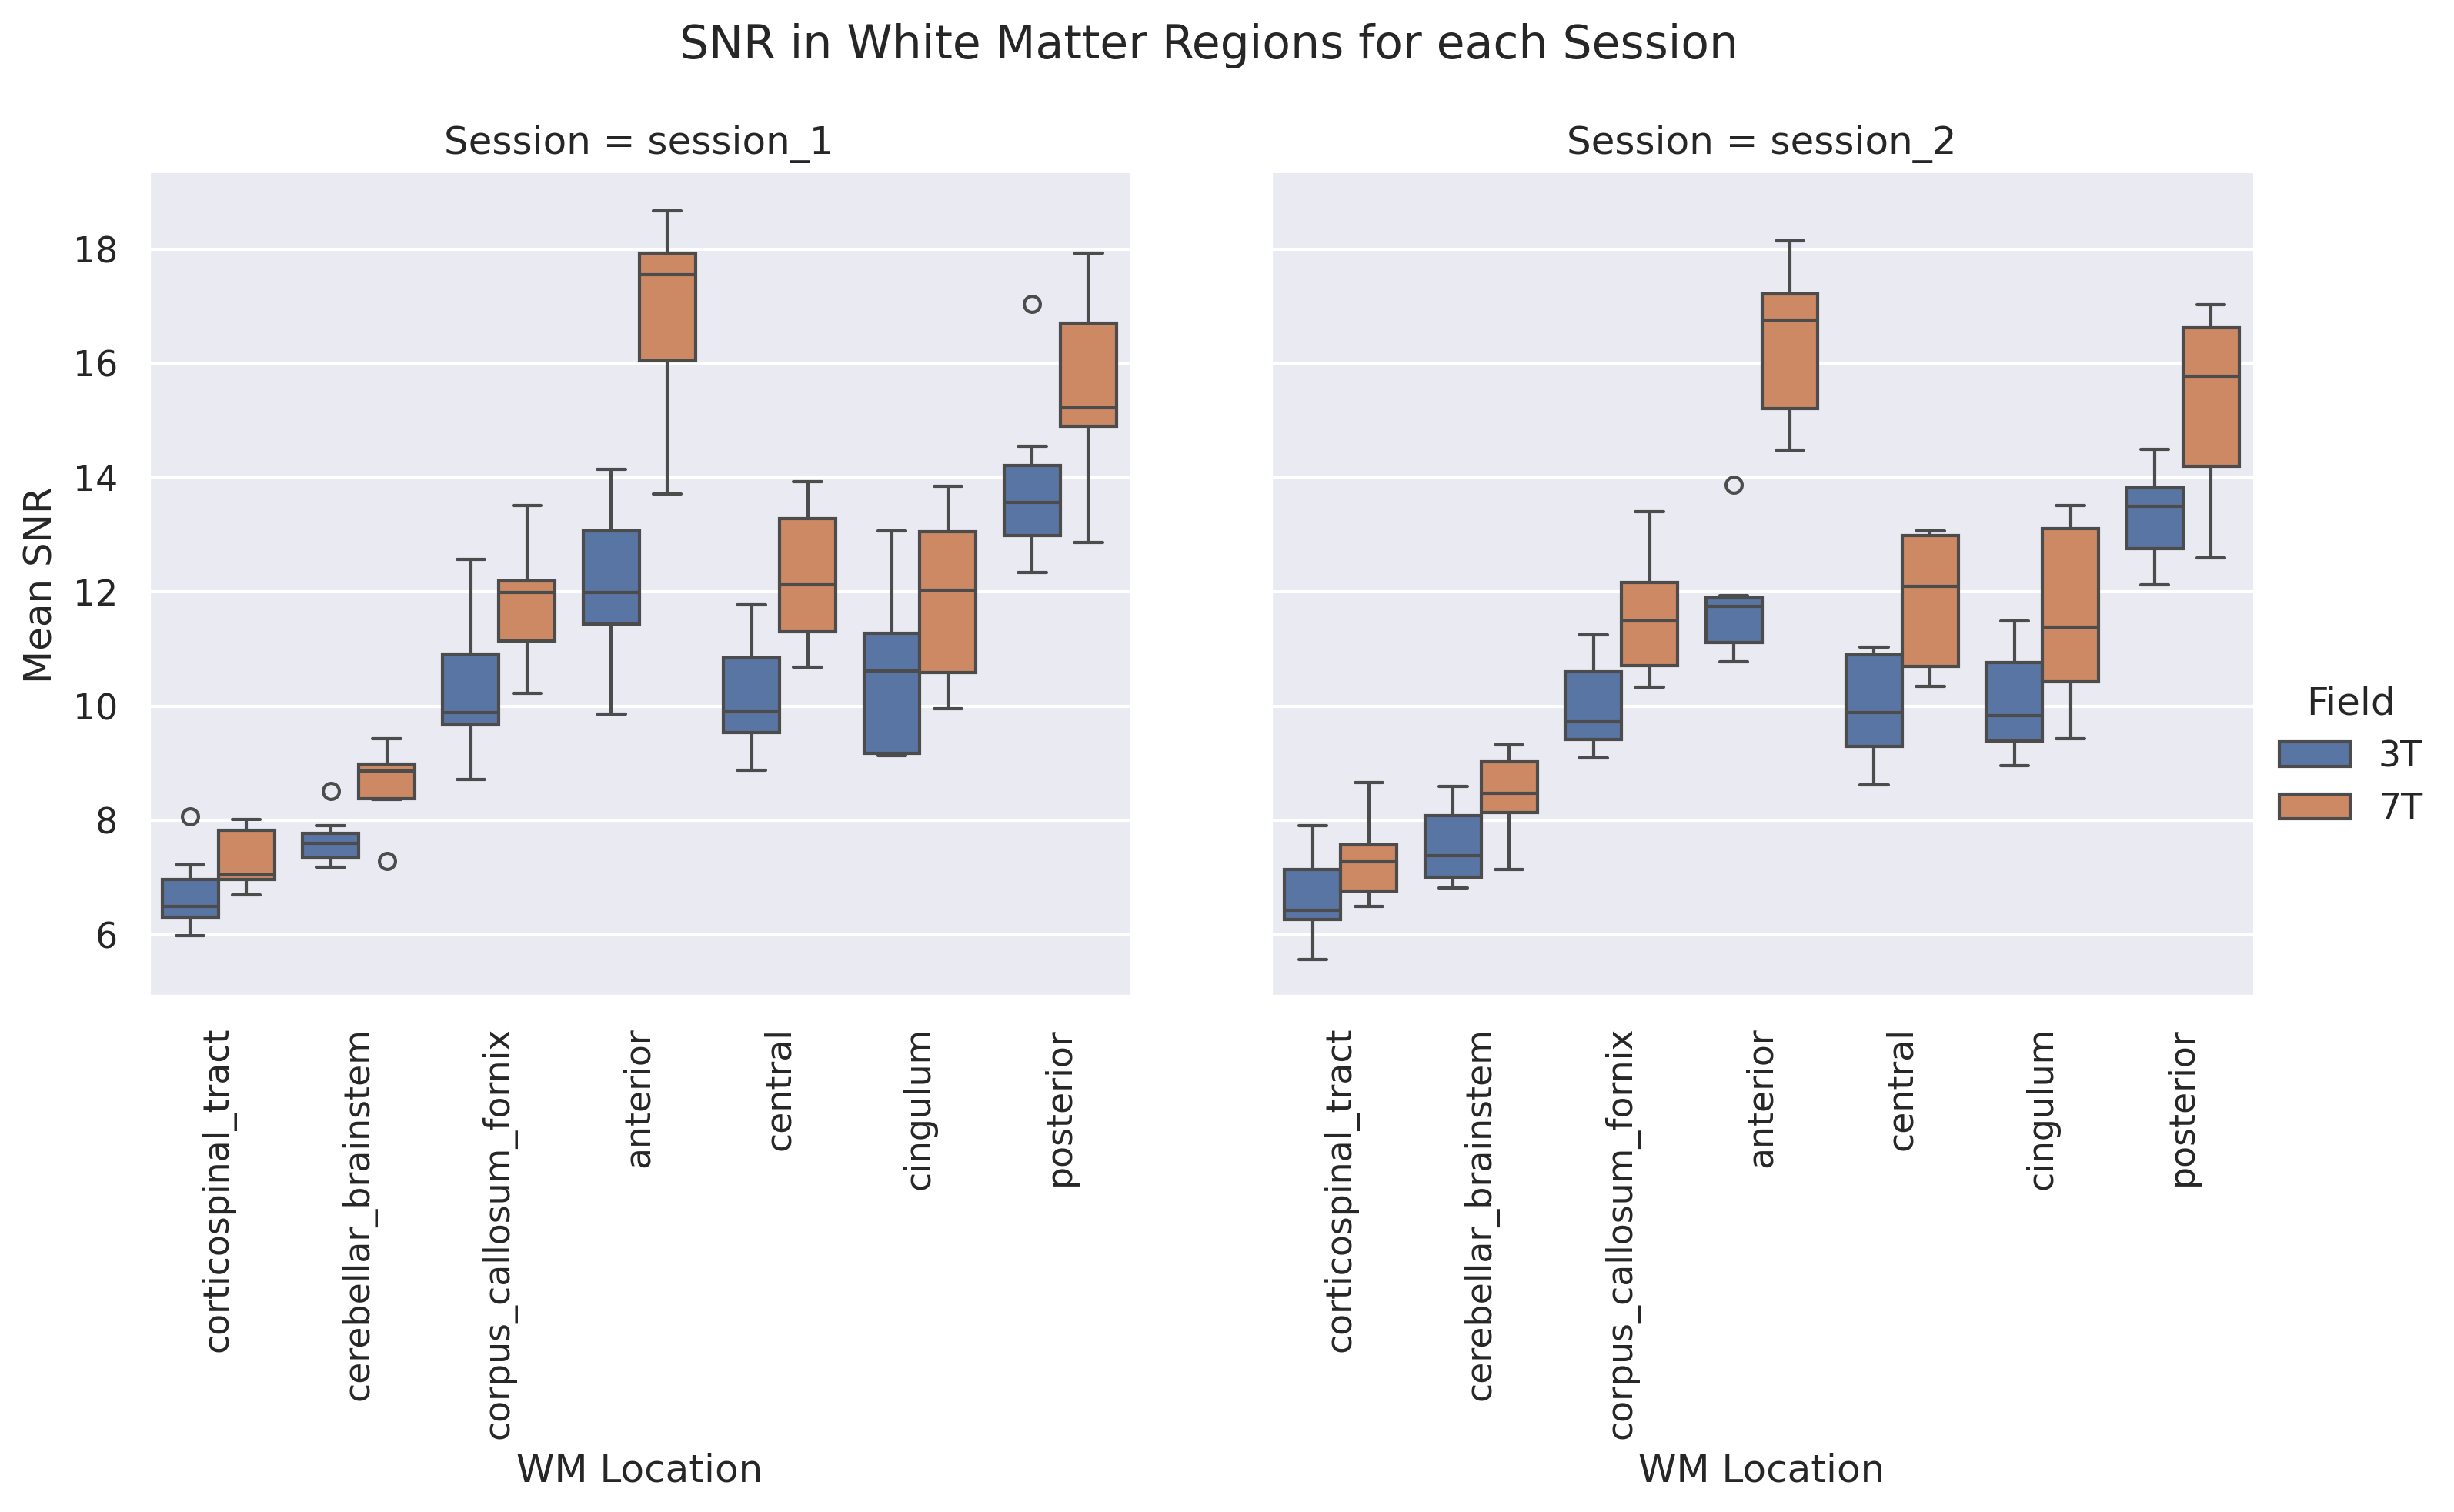
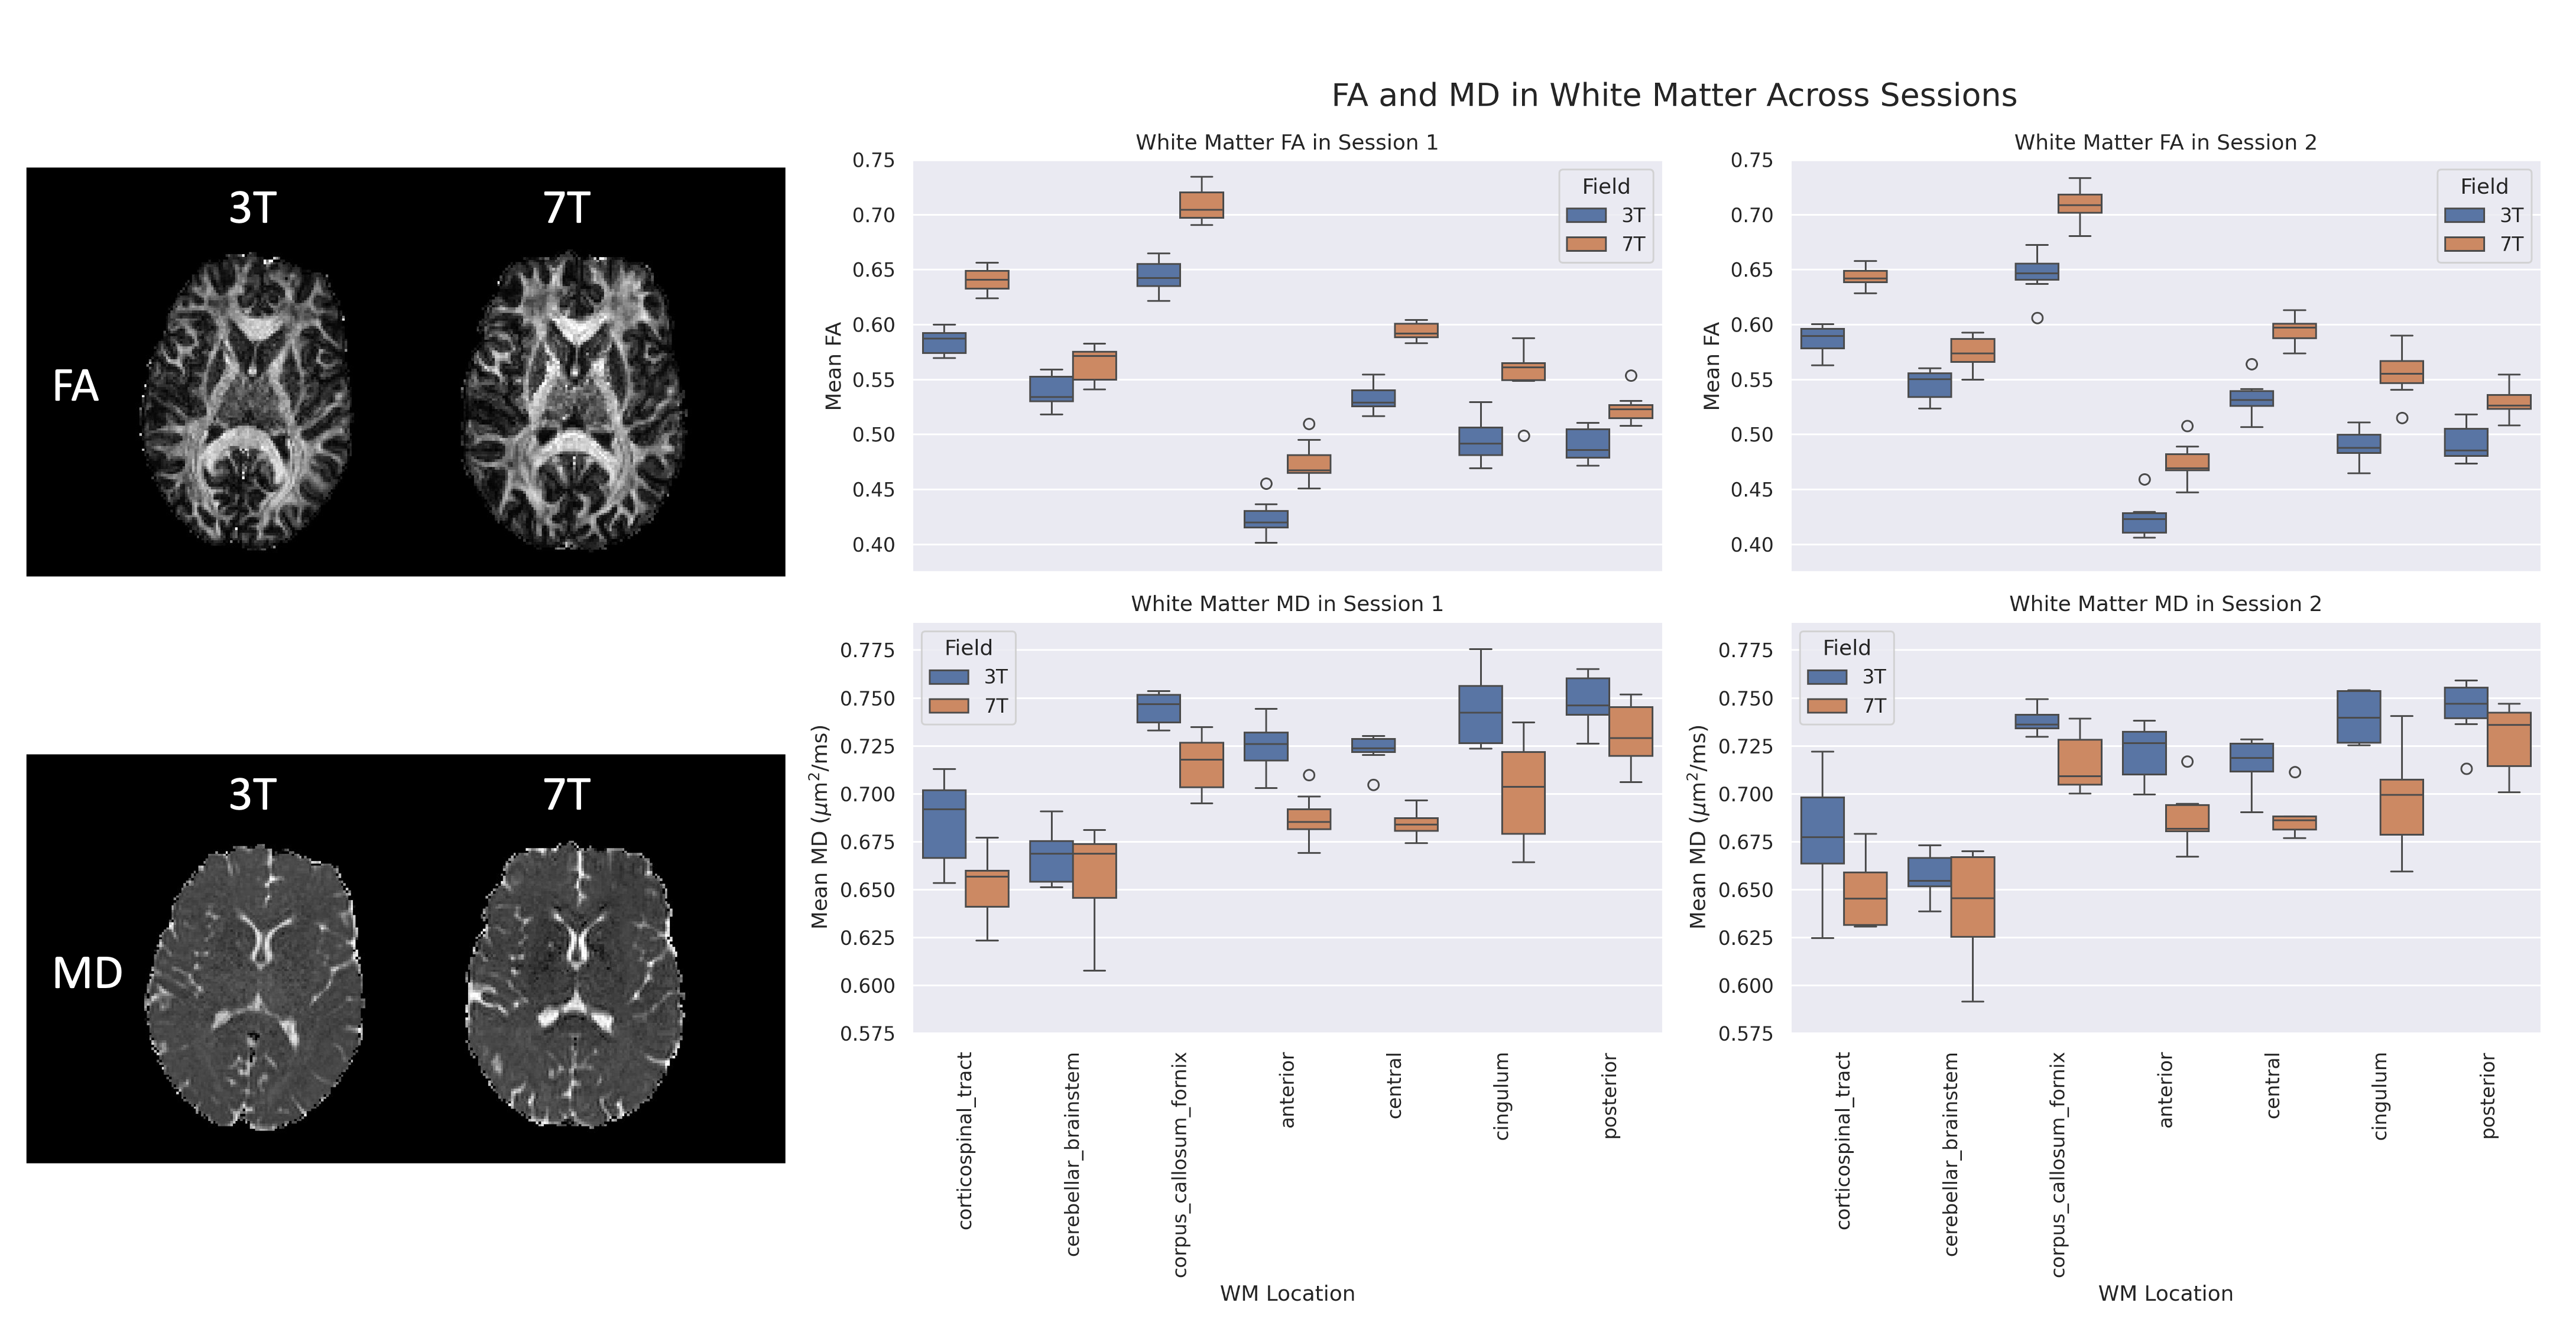
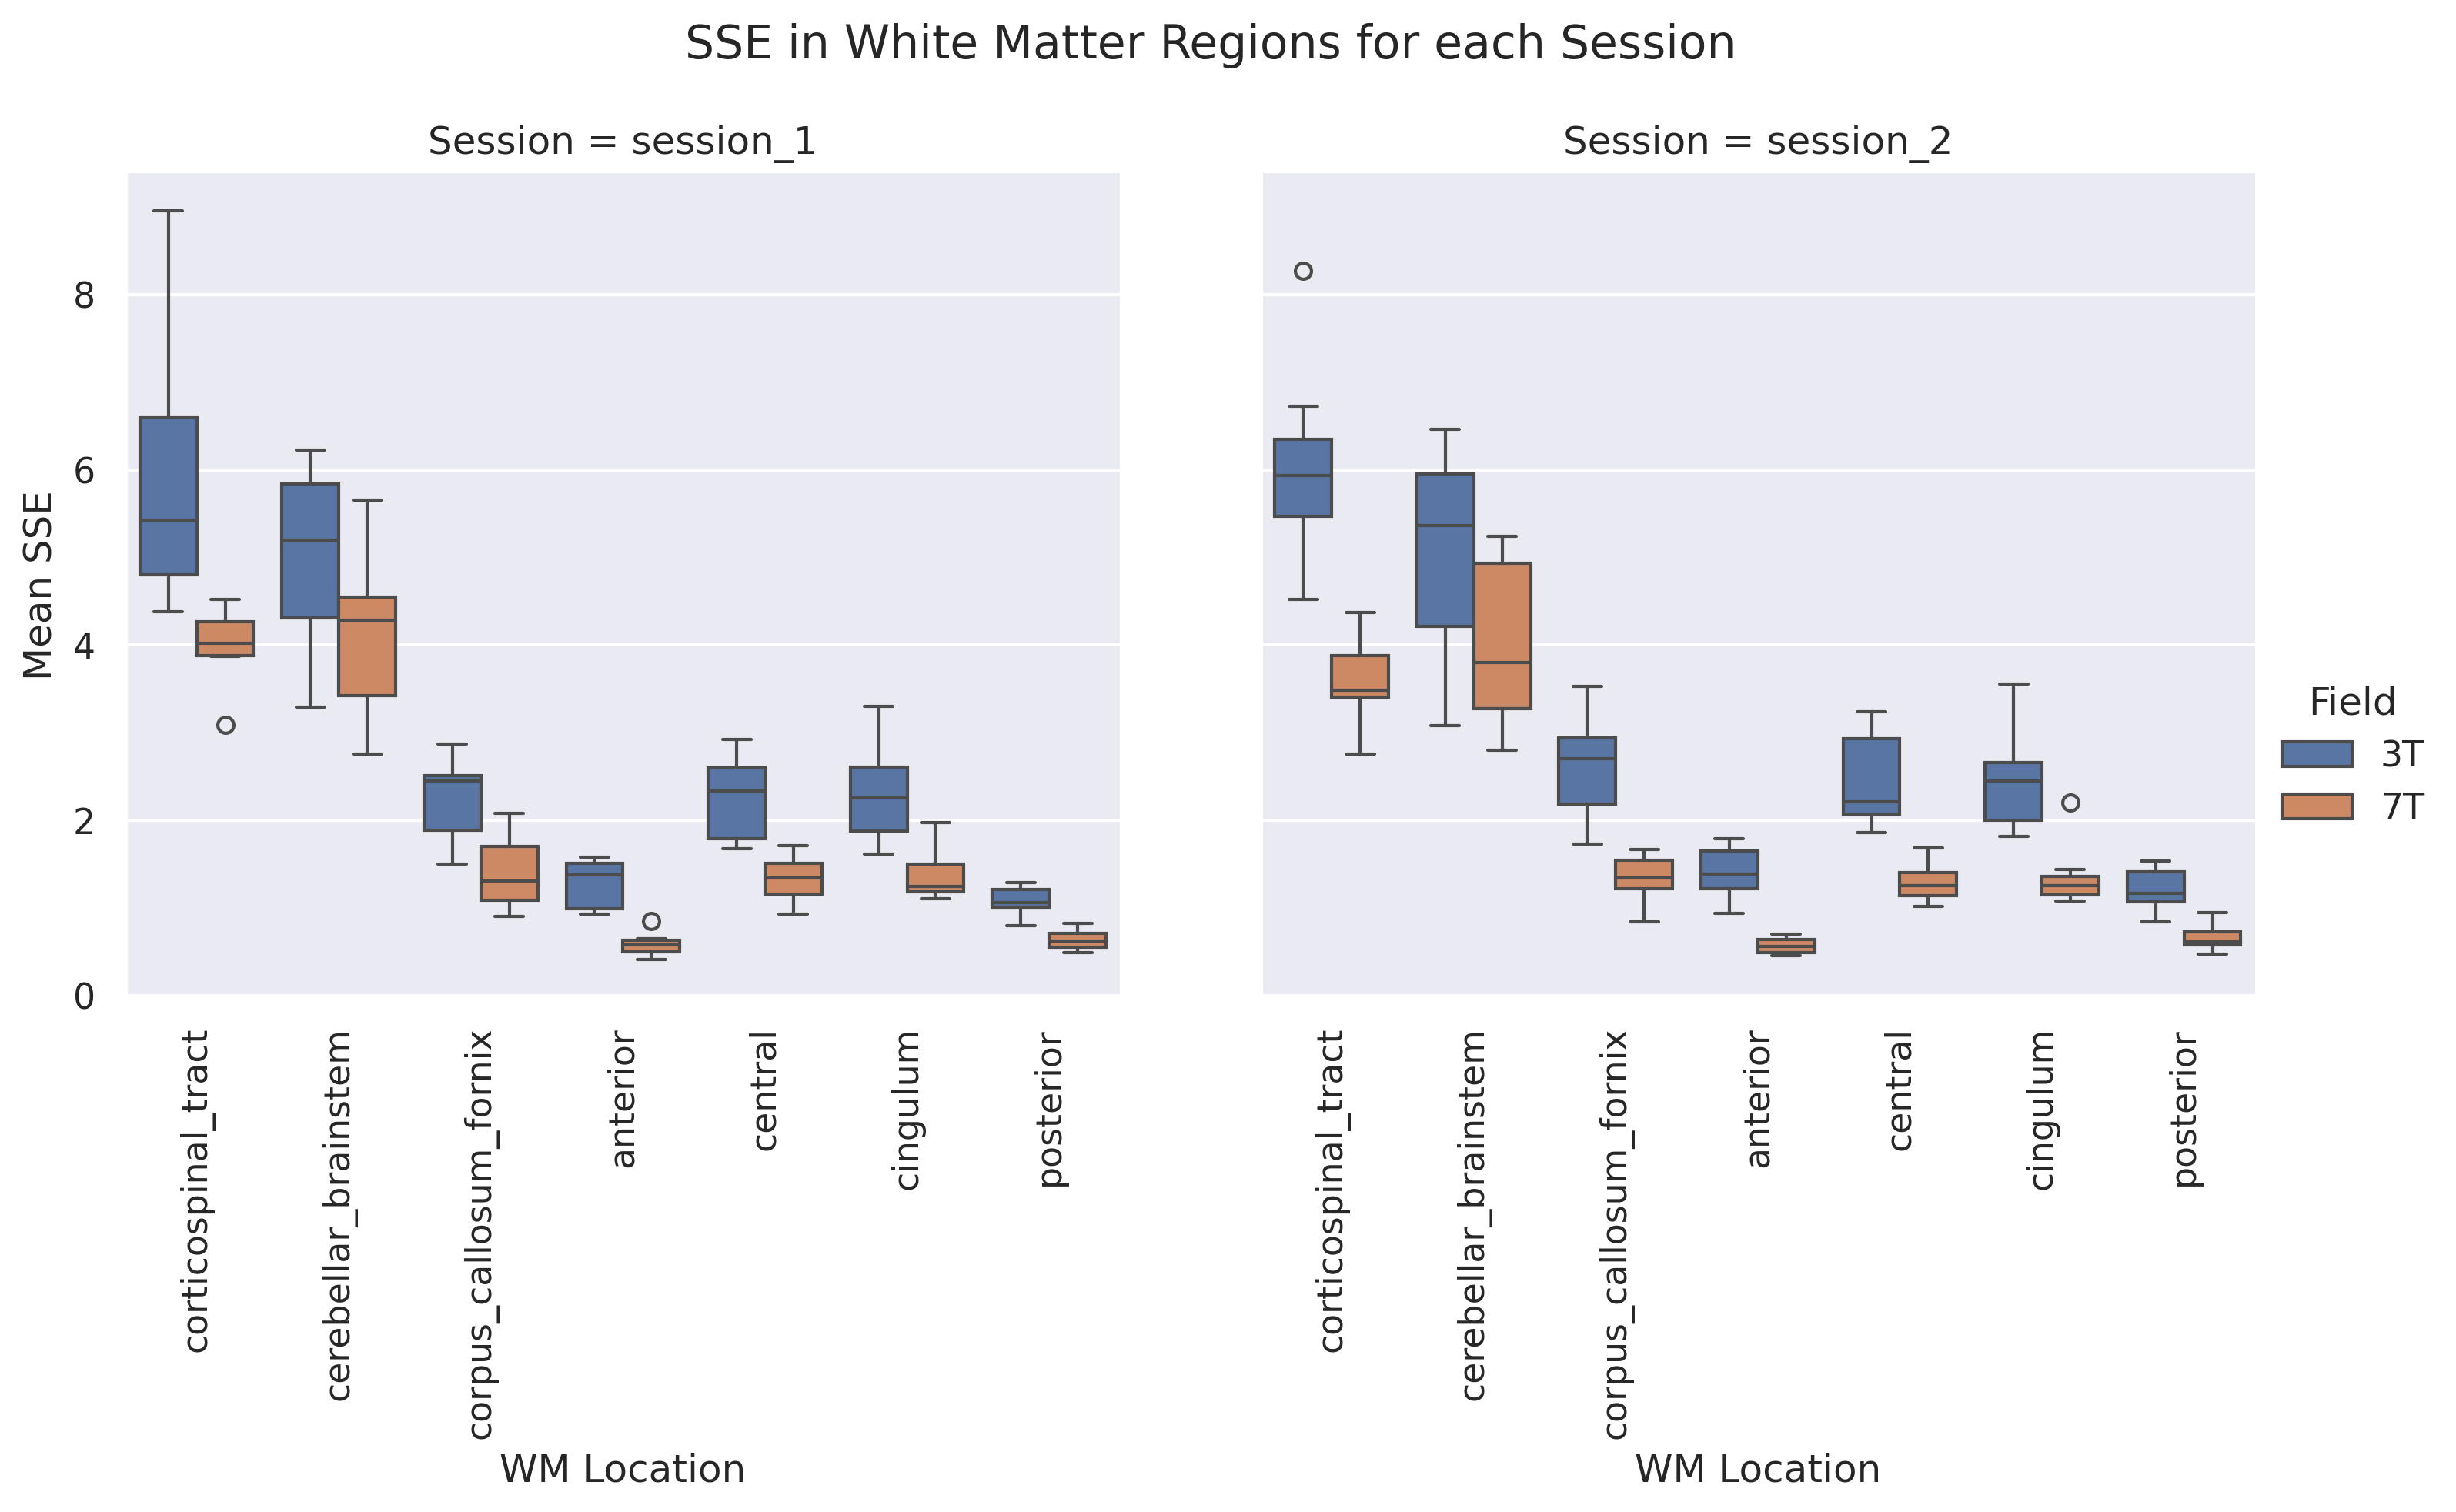
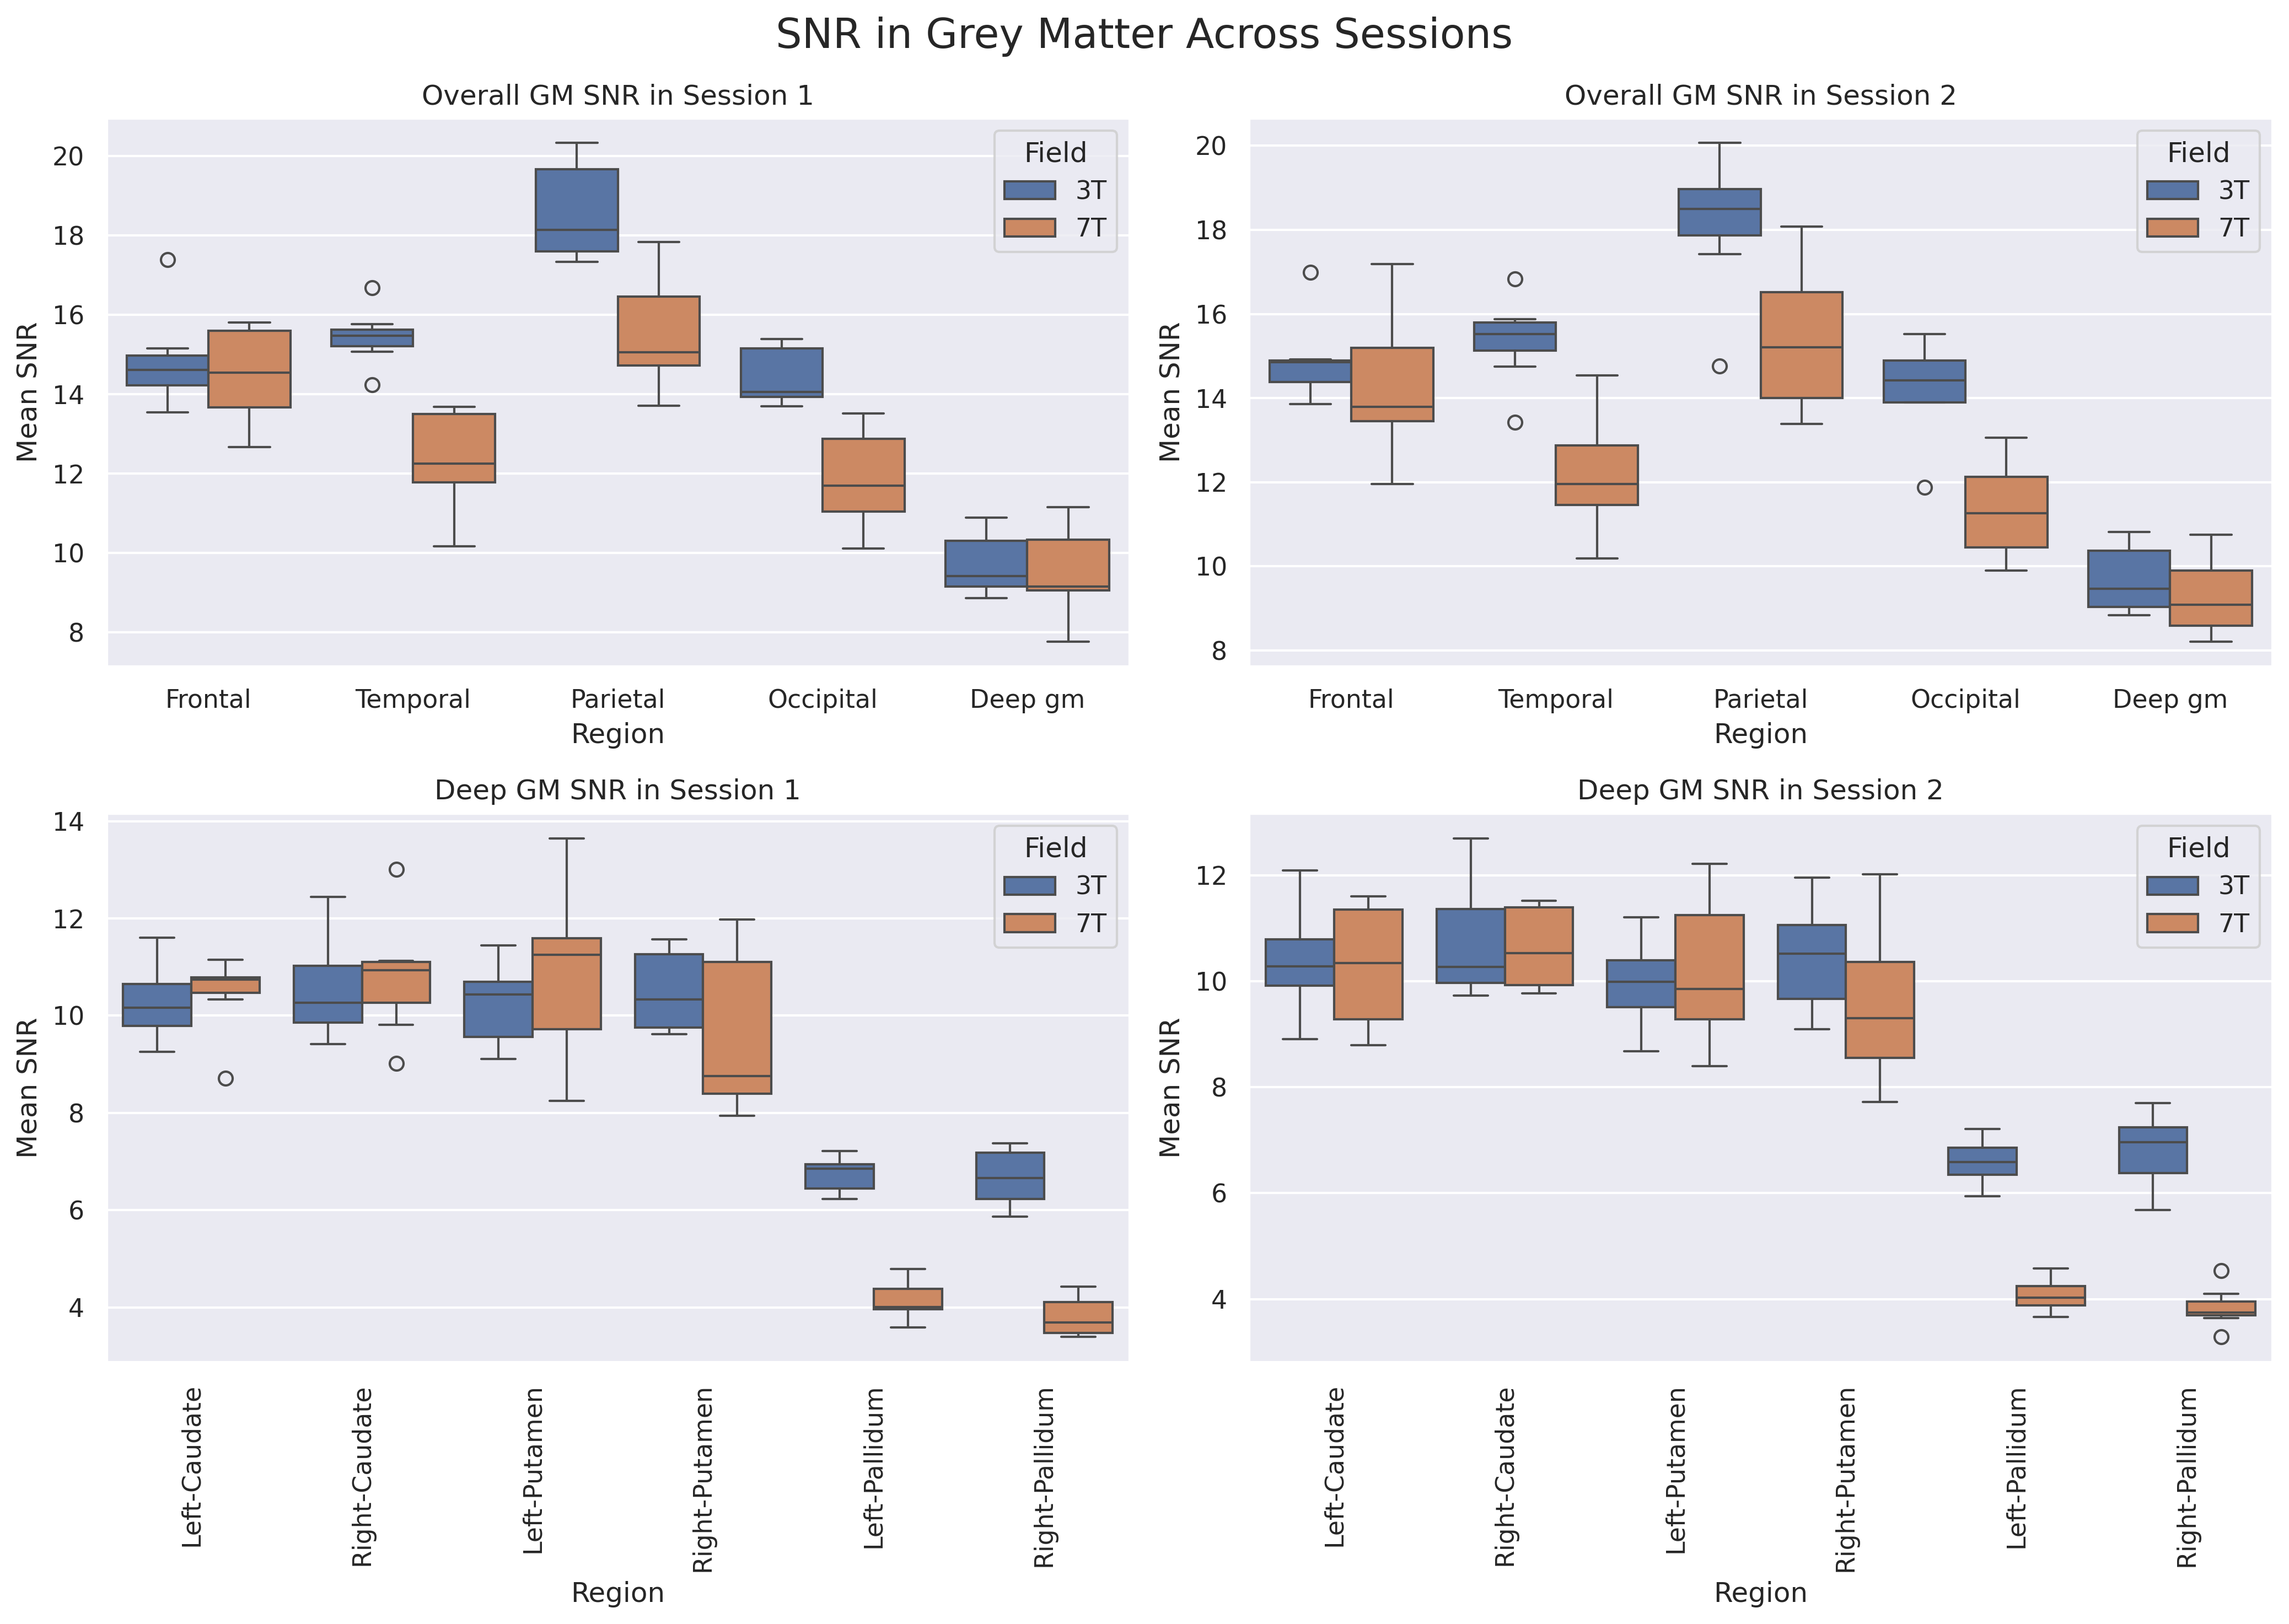
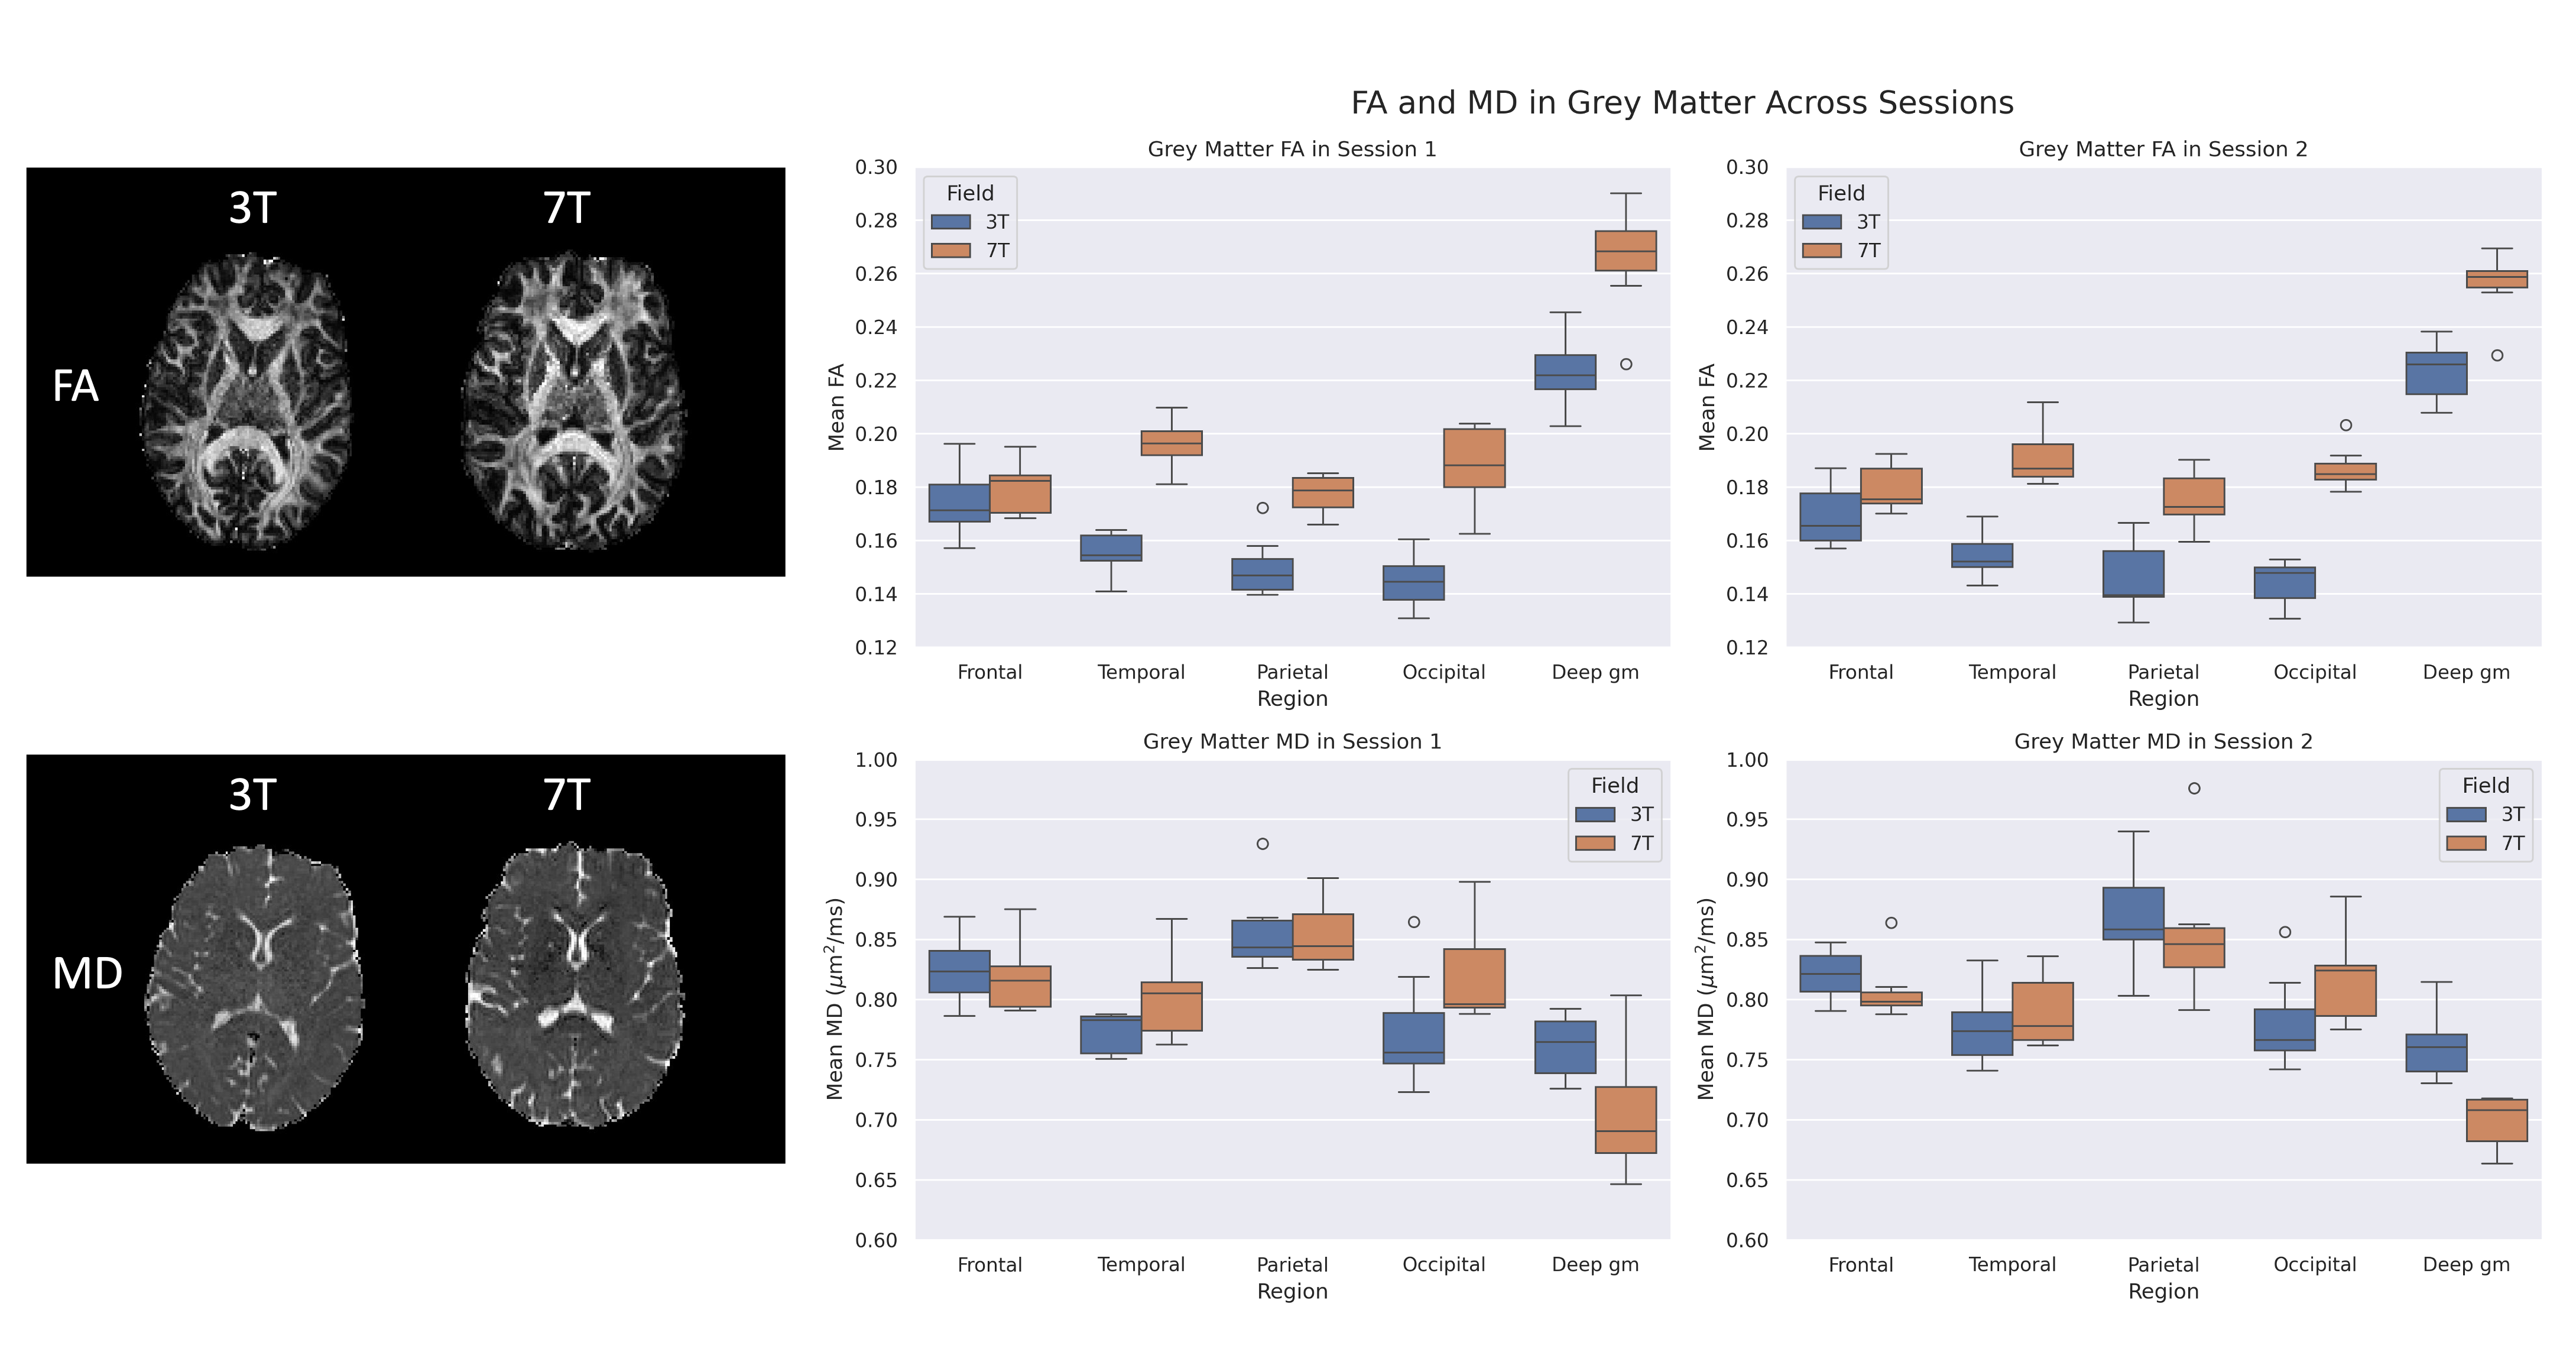
In WM, SNR appeared consistently higher at 7T than 3T, across both scanning sessions (Figure 1). DTI metrics showed an overall increase in FA, and decrease in MD, at 7T compared to 3T (Figure 2). RD decreased at 7T compared to 3T, while AxD appeared mostly similar between field strengths, with a potential increase at 7T in the corpus callosum and fornix. Error from the DTI model fit appears consistently lower at 7T than 3T for all WM (Figure 3).In GM, SNR appears lower at 7T than 3T in the frontal, parietal and occipital lobes, whereas SNR was comparable between field strengths in the subcortical GM and frontal lobe (Figure 4, top). In subcortical GM regions, SNR is comparable in the caudate and putamen, but markedly reduced at 7T in the pallidum (Figure 4, bottom). In cortical GM, areas with lower SNR (SNR < 7) are more common at 7T and appear near the air-tissue interface. DTI metric differences were less consistent between field strengths in GM than WM. There was an overall increase in FA at 7T compared to 3T, except for the frontal lobe, whereas MD, RD and AxD show an unclear overall pattern of change between 3T and 7T (Figure 5). DTI fitting error was lower at 7T in the parietal and occipital lobes, but similar in other GM areas.
Discussion
Using scanners with the same gradient performance and matched acquisition protocols, we have shown that the SNR of DWIs is higher at 7T compared to 3T in the WM, supporting previous work showing higher WM SNR at 7T3,4. However, SNR is either lower or comparable at 7T than 3T in the GM, with cortical regions close to the tissue-air interface and the pallidum showing marked SNR decrease at 7T. This is likely due to the shortened T2 at 7T caused by increased air/tissue susceptibility effects and the high iron content in the pallidum11. Additionally, DTI metrics differ between field strengths, potentially driven by varying tensor model error between 7T and 3T.Conclusion
Although researchers should be cautious of regions with shortened T2 and high susceptibility such as the pallidum and the air/tissue interfaces, whole brain DWI at 7T offers a clear SNR benefit in the WM.Acknowledgements
The Wellcome Centre for Human Neuroimaging at UCL Queen Square Institute of Neurology is supported by core funding from Wellcome [203147/Z/16/Z]. This work was funded by the UCL Wellcome Institutional Strategic Support Fund 3 (204841/Z/16/Z).References
1. Balchandani, P. and Naidich, T. P. (2015). Ultra-high-field MR neuroimaging. American Journal of Neuroradiology, 36(7):1204–1215.2. Gallichan, D. (2018). Diffusion MRI of the human brain at ultra-high field (UHF): A review. NeuroImage, 168:172–180.
3. Polders, D. L., Leemans, A., Hendrikse, J., Donahue, M. J., Luijten, P. R., and Hoogduin, J. M. (2011). Signal to noise ratio and uncertainty in diffusion tensor imaging at 1.5, 3.0, and 7.0 Tesla. Journal of Magnetic Resonance Imaging, 33(6):1456–1463.
4. Choi, S., Cunningham, D. T., Aguila, F., Corrigan, J. D., Bogner, J., Mysiw, W. J., ... & Schmalbrock, P. (2011). DTI at 7 and 3 T: systematic comparison of SNR and its influence on quantitative metrics. Magnetic resonance imaging, 29(6), 739-751.
5. De Santis, S., Bastiani, M., Droby, A., Kolber, P., Zipp, F., Pracht, E., ... & Roebroeck, A. (2019). Characterizing microstructural tissue properties in multiple sclerosis with diffusion MRI at 7 T and 3 T: the impact of the experimental design. Neuroscience, 403, 17-26.
6. University of Minnesota 2023, Multi-Band Accelerated EPI Pulse Sequences, <https://www.cmrr.umn.edu/multiband/>
7. Andersson, J. L., & Sotiropoulos, S. N. (2016). An integrated approach to correction for off-resonance effects and subject movement in diffusion MR imaging. Neuroimage, 125, 1063-1078.
8. Andersson, J. L., Skare, S., & Ashburner, J. (2003). How to correct susceptibility distortions in spin-echo echo-planar images: application to diffusion tensor imaging. Neuroimage, 20(2), 870-888.
9. Mori S, Oishi K, Jiang H, et al. Stereotaxic white matter atlas based on diffusion tensor imaging in an ICBM template. Neuroimage. 2008;40:570-582.
10. Billot, B., Magdamo, C., Cheng, Y., Arnold, S. E., Das, S., & Iglesias, J. E. (2023). Robust machine learning segmentation for large-scale analysis of heterogeneous clinical brain MRI datasets. Proceedings of the National Academy of Sciences, 120(9), e2216399120.
11. Ghadery, C., Pirpamer, L., Hofer, E., Langkammer, C., Petrovic, K., Loitfelder, M., ... & Schmidt, R. (2015). R2* mapping for brain iron: associations with cognition in normal aging. Neurobiology of Aging, 36(2), 925-932.
Figures