5100
Tensor-valued encoded diffusion MRI with spiral readout for whole-brain mapping of microscopic fractional anisotropy1MR Physics, Deutsches Zentrum für Neurodegenerative Erkrankungen e.V., Bonn, Germany, 2Department of Physics & Astronomy, University of Bonn, Bonn, Germany
Synopsis
Keywords: Microstructure, Diffusion/other diffusion imaging techniques, Tensor-valued encoding, Spiral imaging
Motivation: Improvement of the quantification of the microstructure in the human brain with tensor-valued encoded diffusion MRI.
Goal(s): Obtain whole-brain macro- and microscopic diffusion tensor distribution metrics using spiral k-space trajectories at 7T.
Approach: Two diffusion-weighted sequences realizing the QTI approach were designed with Pulseq. They were compared to each other and to an additionally acquired DTI sequence including a ROI analysis.
Results: Accurate metric maps were obtained which are in accordance with the literature and DTI values.
Impact: Combining a multiband spiral sequence with advanced diffusion weighting enables fast whole-brain mapping of microscopic fractional anisotropy in 11-12 minutes.
Introduction
Diffusion-weighted MRI quantifies microstructural properties of human brain tissue by a variety of parameters1. Problems arise in case of different tissue compartments in a voxel, leading to possibly confounded anisotropy measures in diffusion tensor imaging (DTI), that can easily be misinterpreted1. Tensor-valued encoding (TVE), however, enables the determination of a diffusion tensor distribution instead of calculating an averaged quantity like fractional anisotropy (FA)2. In this work, whole-brain diffusion tensor distribution metric maps are obtained with the q-space trajectory imaging (QTI) approach3 comparing two types of gradient waveforms. A spiral readout combined with multiband acquisition is used to reduce the echo time and therefore enhance the SNR for higher accuracy of the maps4.Methods
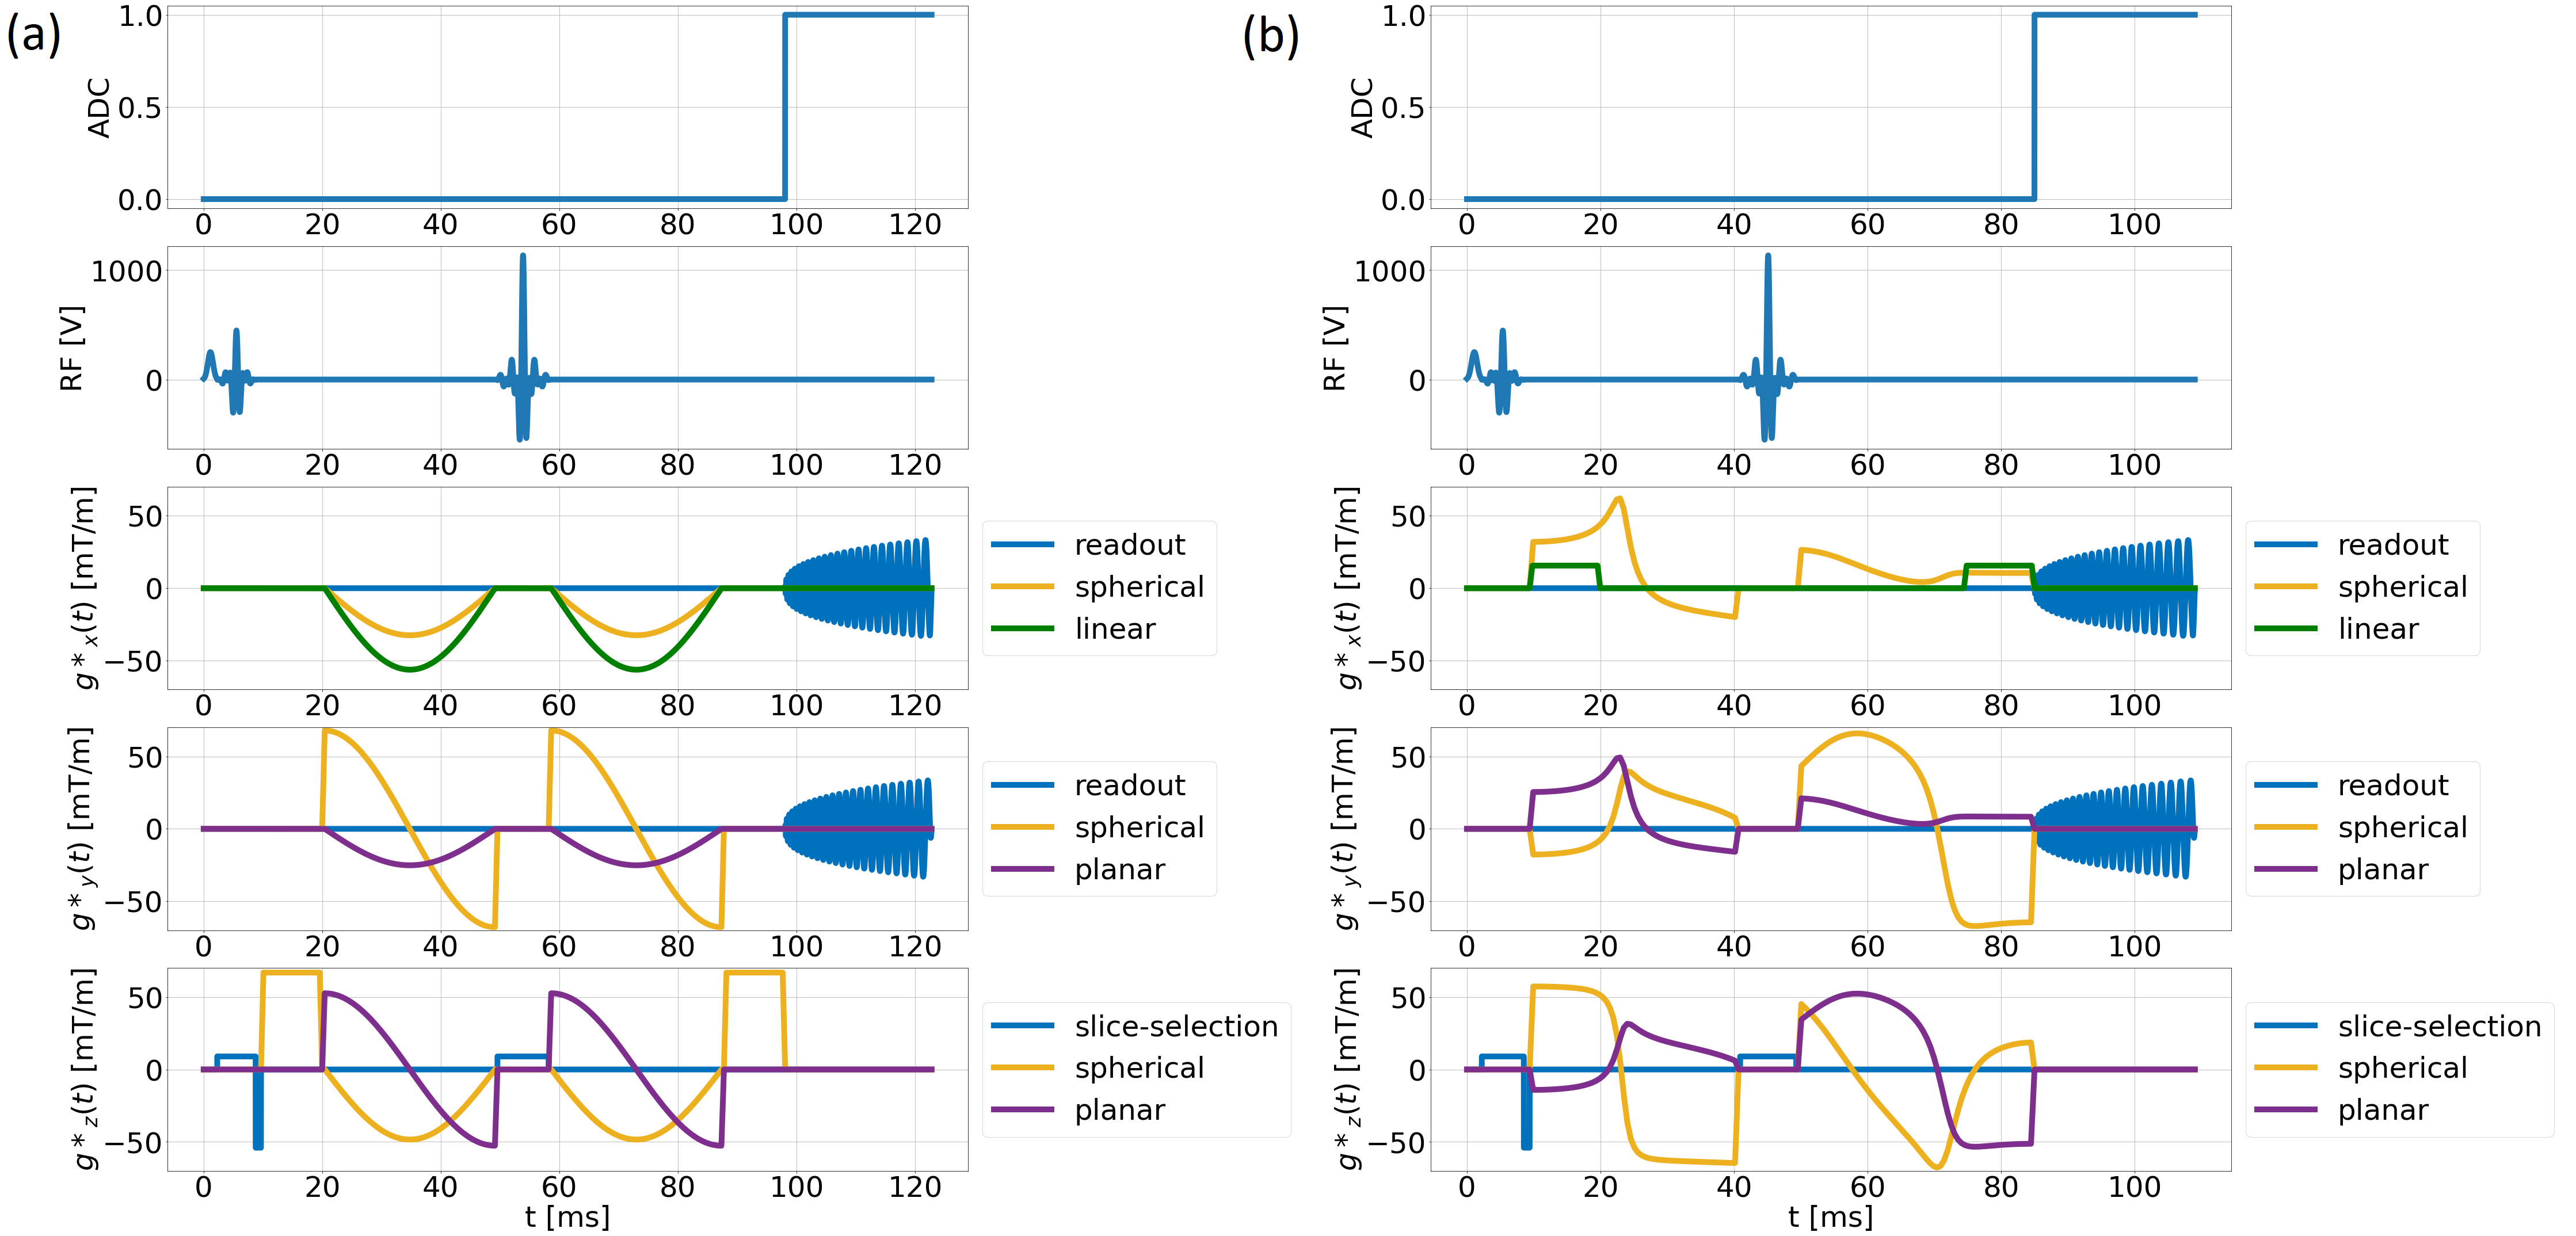
Measurements from one healthy subject were performed on a MAGNETOM 7T-Plus scanner (Siemens, Erlangen) with a 32 channel receive, 8 channel transmit coil (Nova Medical) and a maximum gradient strength of 70mT/m. Two diffusion encoding waveforms were incorporated into a multiband spiral diffusion sequence (MB=2, in-plane acceleration R=3)5 in order to realize QTI3. The sequence design was done with PyPulseq6,7. Figure 1a displays an improved version of the “qMASmod”-sequence8 with additional correction factors accounting for finite gradient slew rate. The “Detuned”-sequence9 in Figure 1b is based on the free-waveform sequence10 and employs the NOW toolbox11 for the calculation of spherical encoding waveforms. The “qMASmod“-sequence contains tuned linear and planar encoding, whereas the “Detuned”-sequence employs trapezoidal gradients for the linear encoding with the same encoding duration9. The tuning was established by correct scaling of the spherical encoding waveforms9,10. According to the Q3-scheme12, the diffusion sequence parameters for “qMASmod” (“Detuned”) were: FOV=210x210x105mm3; res=1.5mm isotropic; [bplanar,bspherical,blinear]=[[0,100,800],[0,2000(1900)],[0,100,800,2000(1900)]]; [nplanar, nspherical, nlinear]=[[4,7,9],[8,30],[20,9,50,15]]; TE=92.5ms/78.7ms; volume TR=4.3s/3.8s; TA=11:58 min/10:43 min. Additionally, a DTI scan with TE=46.6ms was performed as a reference for the macroscopic metrics (FA and MD).The complete imaging pipeline – sequence design, acquisition, and image reconstruction – is based on an established workflow13. B0 and coil sensitivity maps were estimated from a GRE prescan. Additionally, dynamic encoding fields were measured up to third spatial order with a field camera14 (Skope, Zürich) and incorporated in the reconstruction15. Furthermore, a T1-weighted MP-RAGE was acquired for registration to the FSL MNI152-template16. The metric maps (MD: mean diffusivity; FA: fractional anisotropy; µFA: microscopic fractional anisotropy; CMD: normalized size variance of the tensors; CC: microscopic orientation coherence) were calculated with the QTI-class in Dipy17. Afterwards ROI analyses were performed for the splenium, the lateral ventricles (LV) and the anterior corona radiata (ACR), respectively, by applying the registration from MNI to structural space on the labeled regions from FSL atlases18-19.
Results
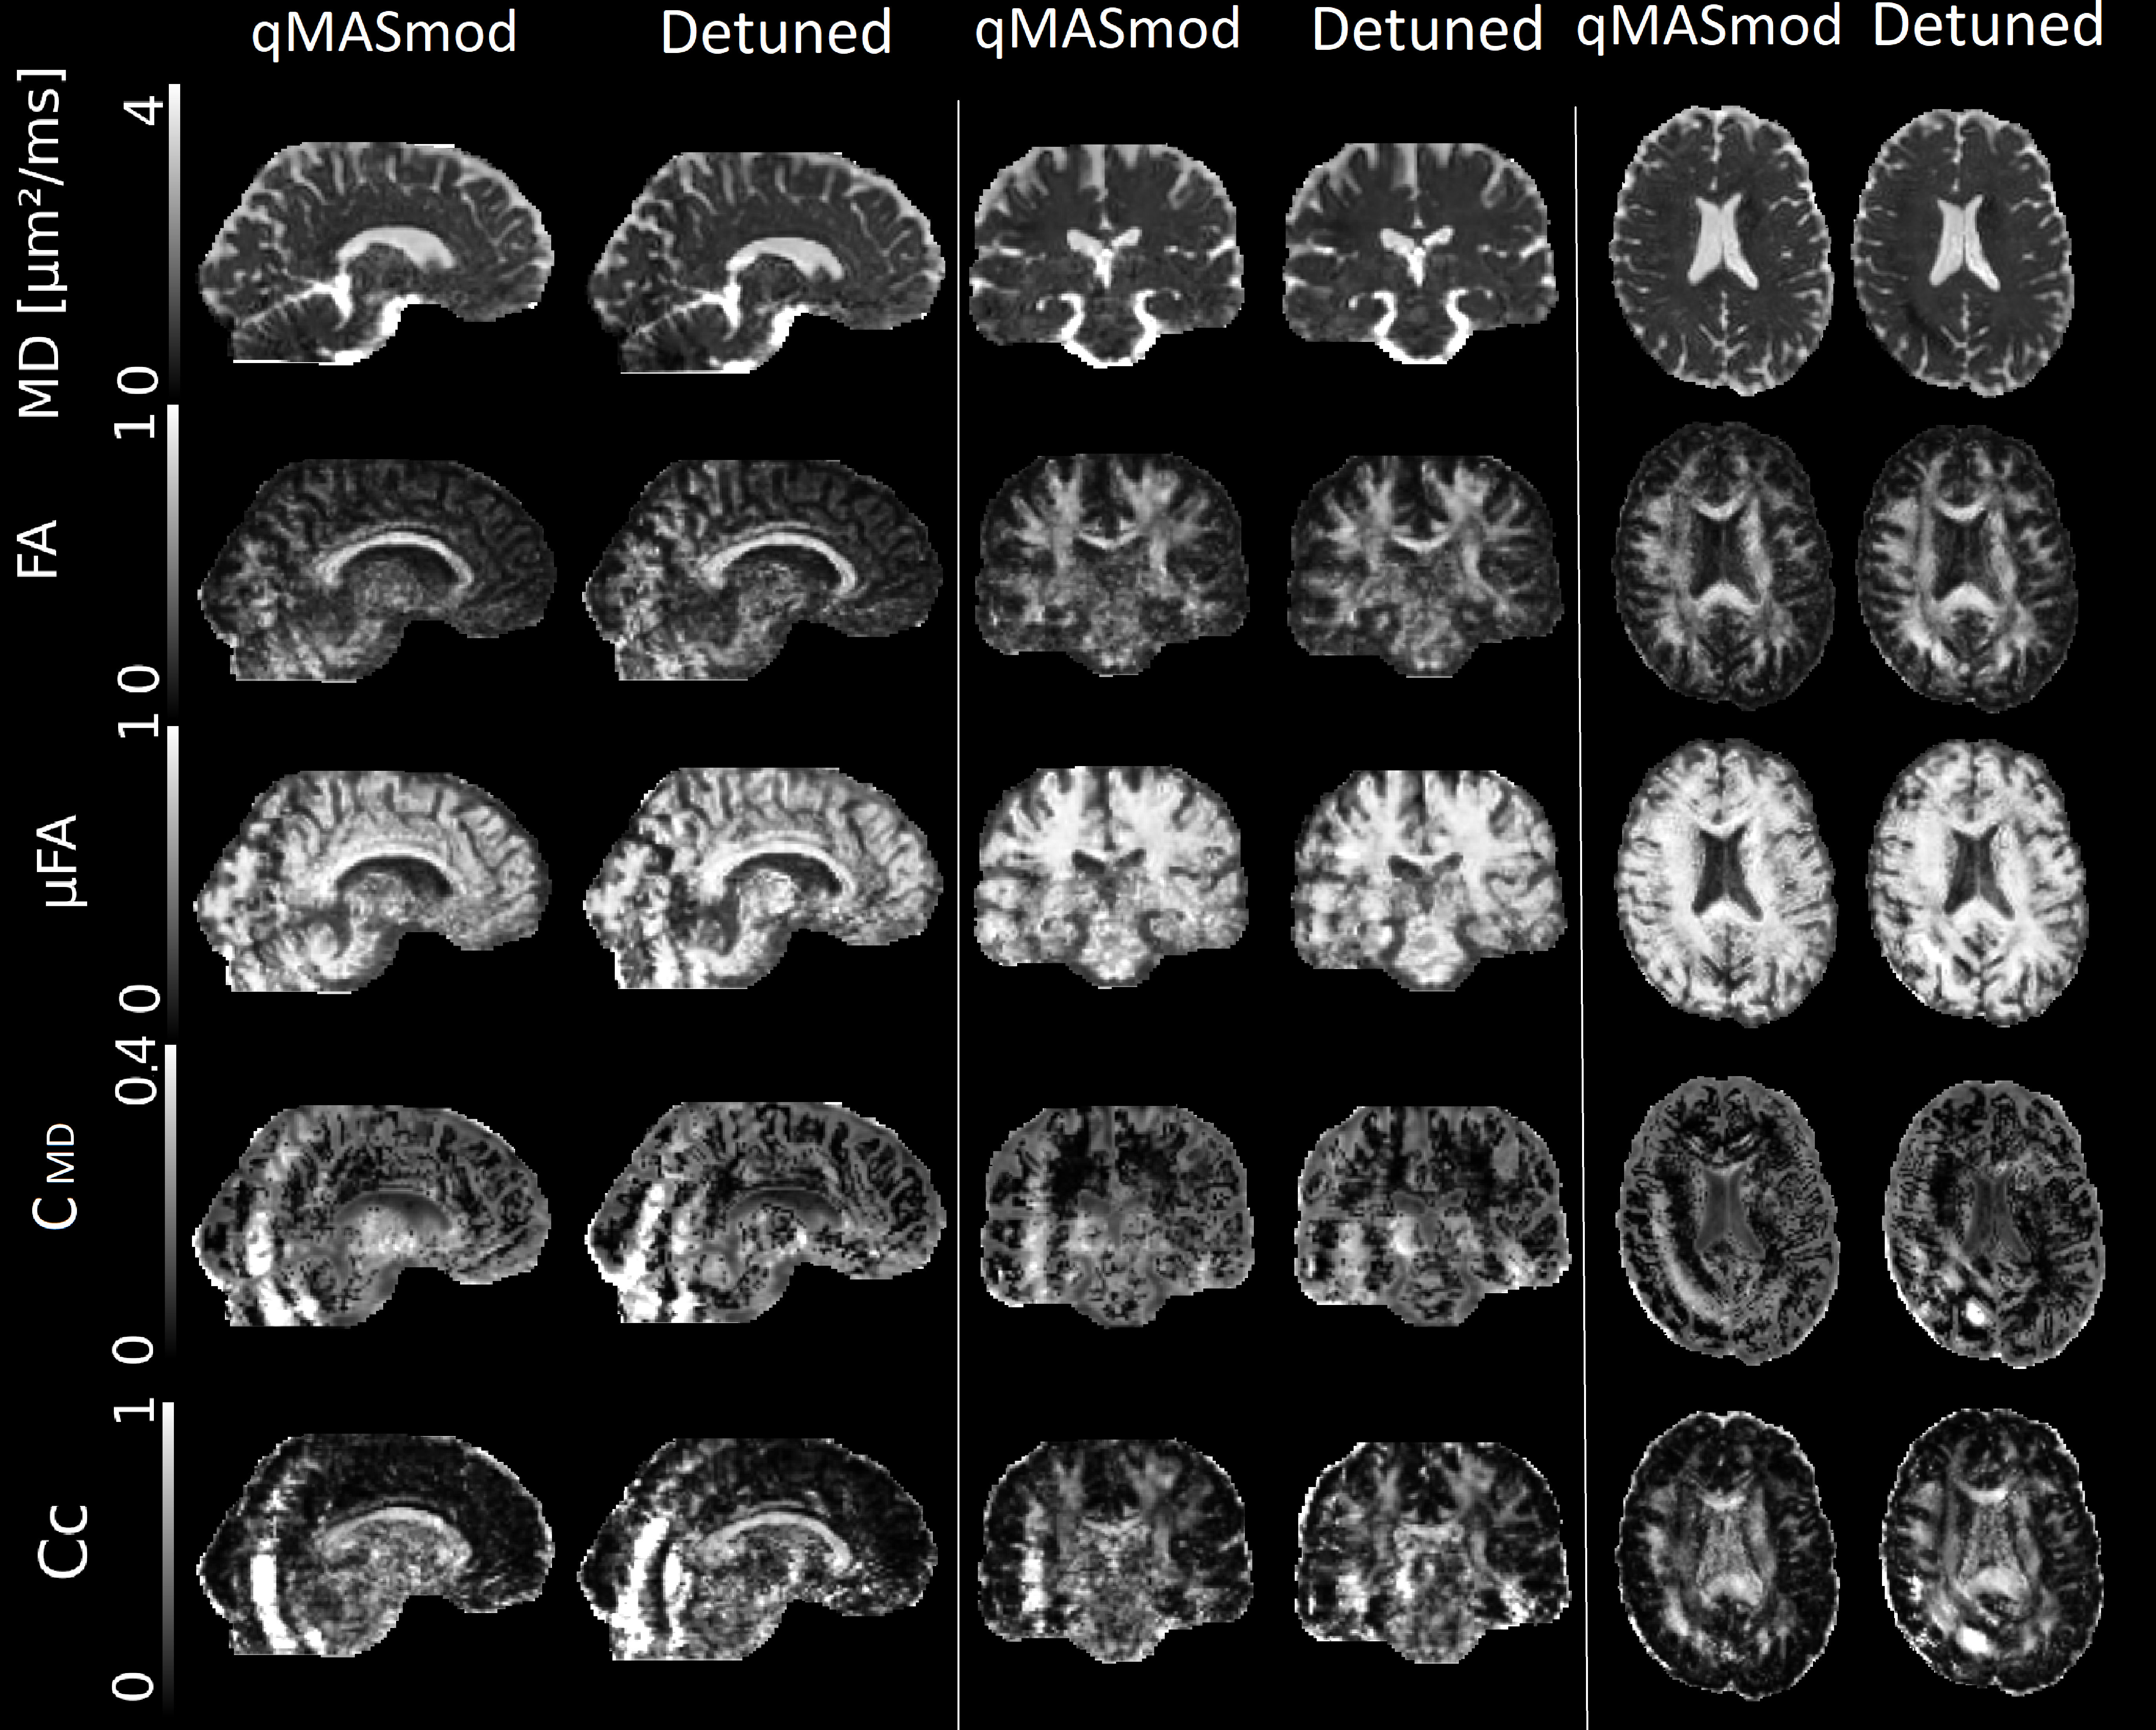
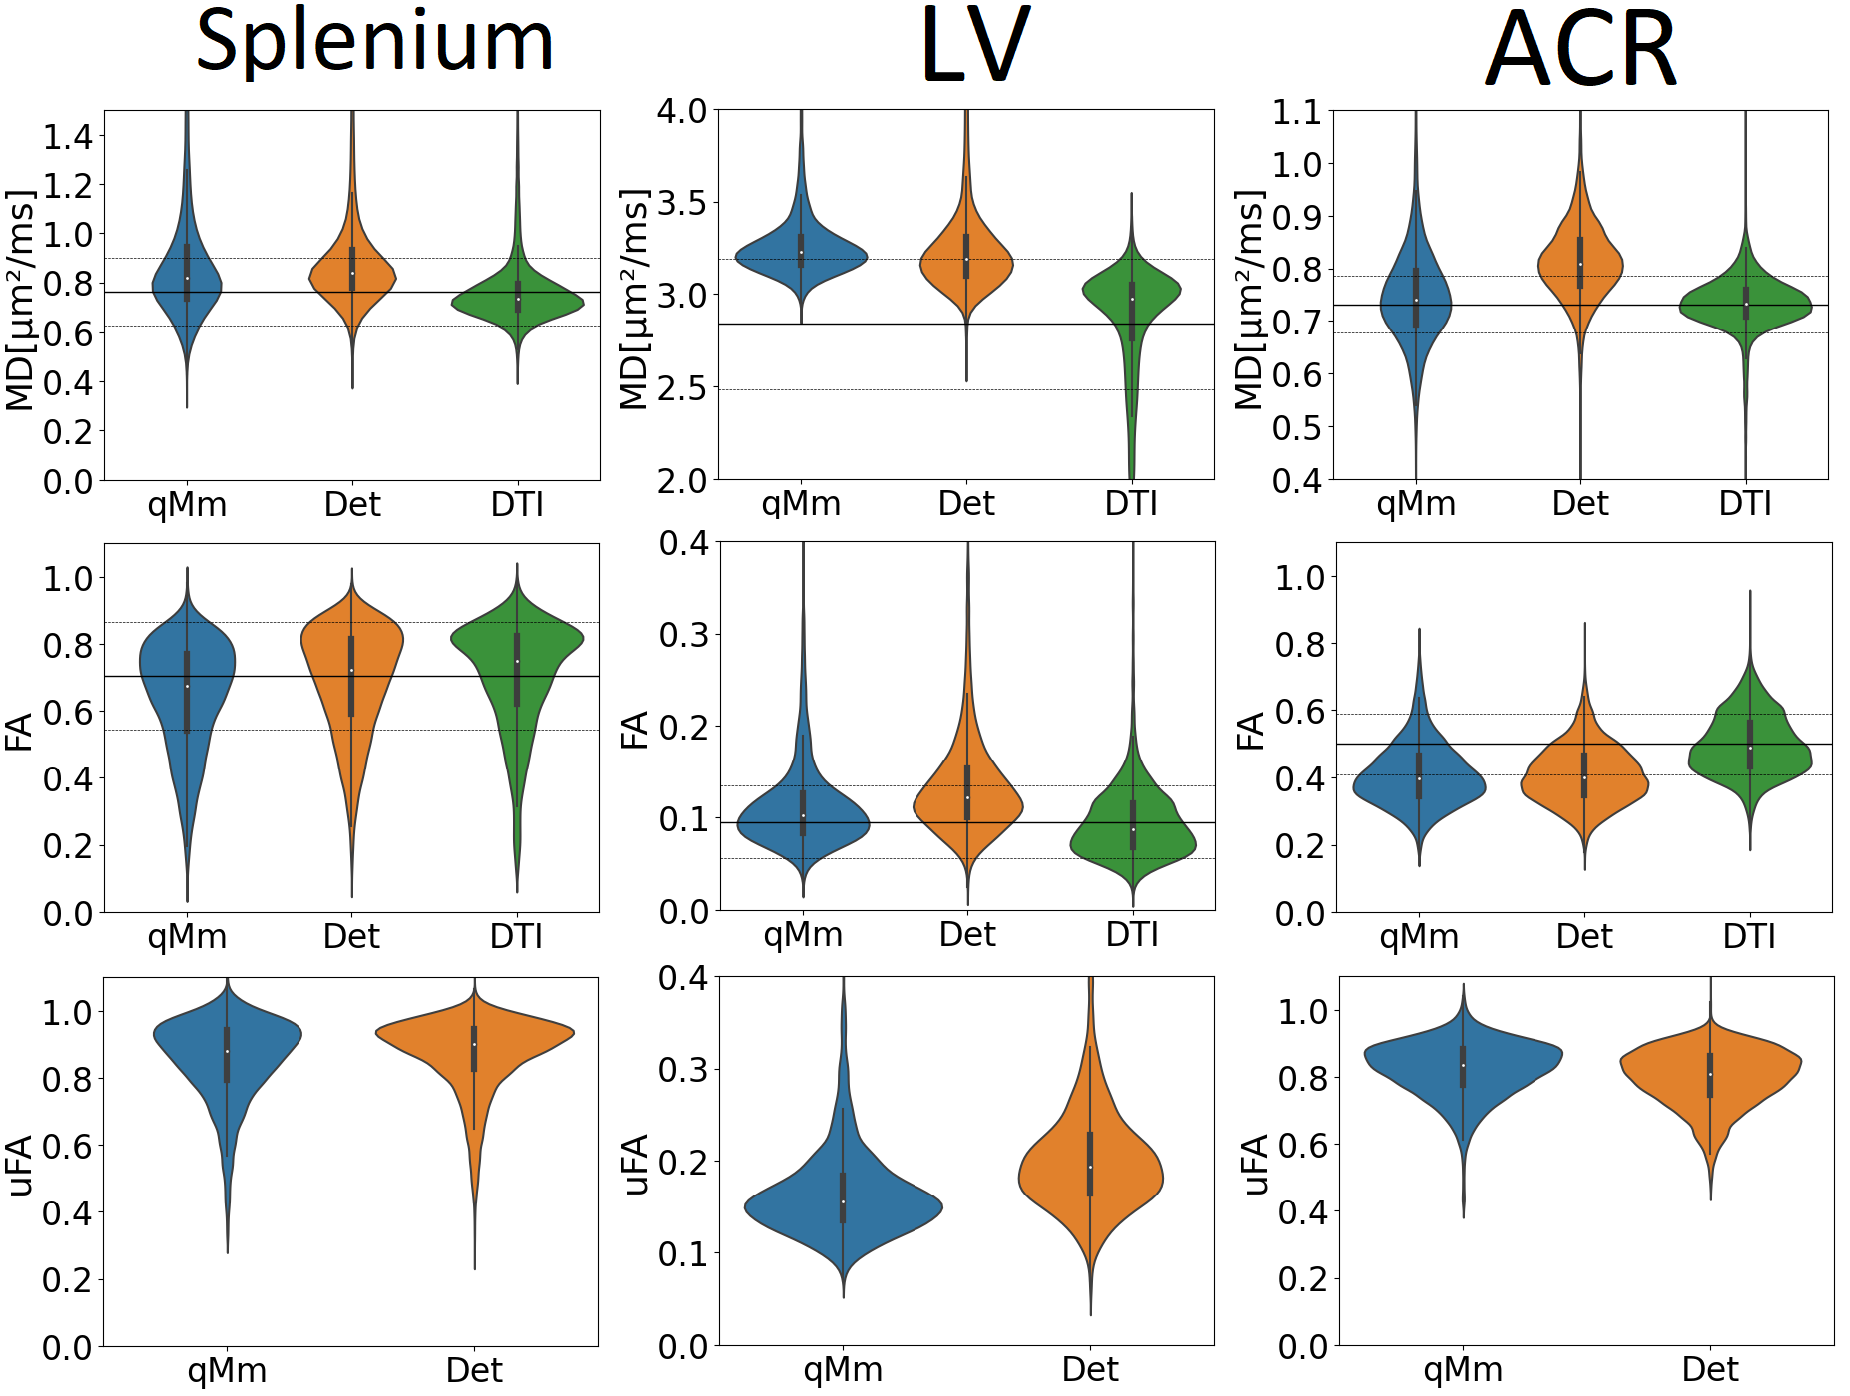
Figure 2 displays several diffusion metrics for the two waveforms. The maps indicate high MD, low (µ)FA, low CC and homogeneous CMD in the LV and the opposite scenario in the white matter. Figure 3 presents the histograms of the two waveforms and the DTI for the selected ROIs. In general, the histograms of the three sequences are in high agreement for all metrics. Whereas the difference between the FA and µFA in the splenium is rather small, the µFA is approximately twice as large as the FA in the ACR. Furthermore, the MD of the QTI-sequences in the LV is slightly higher and the FA in the ACR is slightly lower compared to the DTI sequence. The “qMASmod”-sequence is in higher agreement with the DTI values regarding the FA in the LV and the MD in the ACR.Discussion
The MD-and (µ)FA- maps of the “qMASmod”- and “Detuned”-sequence are in good agreement with previously published results4. The MD maps of the “Detuned”-sequence appear to be less noisy compared to the “qMASmod”-sequence due to the shorter echo time and the enhanced SNR. The similar FA and CC maps demonstrate the orientation dependence of the FA. The ROI analysis shows that the LV have small (µ)FA values and high isotropic variance CMD due to the high amount of CSF. In contrast, FA and µFA are larger for the white matter. The splenium, consisting of parallel fiber bundles, has similar FA and µFA values. However, the ACR containing crossing fibers has smaller FA than µFA values. These findings agree well with the expectations. The greater agreement between the “qMASmod”-sequence and the DTI might be caused by the tuned gradients, which reduces the impact of time-dependence20.Conclusion
Tensor-valued encoded diffusion MRI with the QTI approach enables the determination of microscopic diffusion metrics such as microscopic fractional anisotropy and orientation coherence. Utilizing a multiband spiral sequence, whole-brain maps were obtained at 7T in 11-12 minutes with an isotropic resolution of 1.5mm.Acknowledgements
No acknowledgements found.References
1. Nicole Seiberlich et al. Quantitative magnetic resonance imaging. Academic Press, 2020.2. Daniel Topgaard. ‘Multidimensional diffusion MRI’. In: J. Magn. Reson. 275 (2017), pp. 98–113.
3. Carl-Fredrik Westin et al. ‘Q-space trajectory imaging for multidimensional diffusion MRI of the human brain’. In: Neuroimage 135 (2016), pp. 345–362.
4. Sajjad Feizollah and Christine L Tardif. ‘Toward high-resolution mapping of microscopic anisotropy in the cortex using b-tensor diffusion imaging with a spiral readout at 7 Tesla’. In: Proc. Int. Soc. Magn. Reson. Med. 29. 2019, p. 3653.
5. Marten Veldmann et al. ‘Spiral readout improves in vivo MR axon radius estimation in human white matter’. In: Proc. Int. Soc. Magn. Reson. Med. 31. Toronto, Canada, 2023, p. 5172.
6. Kelvin J. Layton et al. ‘Pulseq: A rapid and hardware-independent pulse sequence prototyping framework’. In: Magn. Reson. Med. 77.4 (2017), pp. 1544–1552.
7. Ravi, Keerthi, Sairam Geethanath, and John Vaughan. ‘PyPulseq: A Python Package for MRI Pulse Sequence Design.’ In: J.O.S.S. 4.42 (2019): 1725.
8. Sebastian Vellmer et al. ‘Comparative analysis of isotropic diffusion weighted imaging sequences’. In: J. Magn. Reson. 275 (2017), pp. 137– 147.
9. Lundell, H., Nilsson, M., Dyrby, T.B. et al. ‘Multidimensional diffusion MRI with spectrally modulated gradients reveals unprecedented microstructural detail.’ In: Sci. Rep. 9, 9026 (2019)
10. Filip Szczepankiewicz, Scott Hoge and Carl-Fredrik Westin. ‘Linear, planar and spherical tensor-valued diffusion MRI data by free waveform encoding in healthy brain, water, oil and liquid crystals’. In: Data in brief 25 (2019), p. 104208.
11. Jens Sjölund et al. ‘Constrained optimization of gradient waveforms for generalized diffusion encoding’. In: J. Magn. Reson. 261 (2015), pp. 157–168.
12. Jan Morez et al. ‘Optimal experimental design and estimation for q-space trajectory imaging’. In: Human Brain Mapping 44.4 (2023), pp. 1793–1809.
13. Marten Veldmann et al. ‘Open-source MR imaging and reconstruction workflow’. In: Magn. Reson. Med. 88.6 (2022), pp. 2395–2407.
14. Christoph Barmet, Nicola De Zanche and Klaas P Pruessmann. ‘Spatiotemporal magnetic field monitoring for MR’. In: Magn. Reson. Med. 60.1 (2008), pp. 187–197.
15. Wilm, Bertram J., et al. ‘Single‐shot spiral imaging enabled by an expanded encoding model: Demonstration in diffusion MRI.’ In: Magn. Reson. Med. 77.1 (2017): 83-91.
16. Jenkinson, M., Beckmann, C. F., Behrens, T. E. J., Woolrich, M. W., & Smith, S. M. (2012). FSL. NeuroImage, 62(2), 782–790.
17. Eleftherios Garyfallidis et al. ‘Dipy, a library for the analysis of diffusion MRI data’. In: Frontiers in neuroinformatics 8 (2014), p. 8.
18. Susumu Mori et al. MRI atlas of human white matter. Elsevier, 2005.
19. Nikos Makris et al. ‘Decreased volume of left and total anterior insular lobule in schizophrenia’. In: Schizophrenia research 83.2-3 (2006), pp. 155–171.
20. Lasič, Samo, et al. "Stay on the beat with tensor-valued encoding: time-dependent diffusion and cell size estimation in ex vivo heart." In: Frontiers in Physics 10 (2022): 167.
Figures