5099
Time-dependent DW-MRS to probe lactate compartmentation in Huntington’s disease mouse model1Université Paris-Saclay, CEA, CNRS, MIRCen, Laboratoire des Maladies Neurodégénératives, Fontenay-aux-Roses, France, 2Cardiff University Brain Research Imaging Centre (CUBRIC), School of Psychology, Cardiff University, Cardiff, United Kingdom, 3School of Computer Science and Informatics, Cardiff University, Cardiff, United Kingdom
Synopsis
Keywords: Microstructure, Rare disease
Motivation: In the healthy brain, lactate compartmentation and exchange are crucial for neurotransmission. In Huntington’s disease (HD), lactate metabolism appears to be impaired, but lactate compartmentation is unkown.
Goal(s): To assess lactate compartmentation between intracellular and extracellular spaces under pathological conditions in vivo.
Approach: Using time-dependent DW-MRS, which may probe lactate exchange and compartmentation, we measured diffusivity and kurtosis in a cohort of zQ175 mice, a model of HD, versus control mice at 3, 6 and 12 months.
Results: Results suggest a larger extracellular fraction in zQ175 mice at 12 months, while no other microstructural changes would be measurable using DW-MRS.
Impact: DW-MRS allows probing brain lactate compartmentation, thus unravelling some crucial aspect of lactate metabolism. Results suggest that, while no microstructural alteration can be observed in the zQ175 mouse model of Huntington’s disease, impaired lactate compartmentation is detected with DW-MRS.
Introduction
Lactate plays a crucial role in the brain, as it is involved in neuronal activity. Lactate metabolism could be impaired in neurodegenerative diseases1 and its distribution between intracellular and extracellular spaces (ICS/ECS) may be modified under pathological conditions. It has already been shown that brain lactate concentration tends to decrease in Huntington’s disease (HD) mice, e.g. in the striatum of zQ175 mice2, and that the astrocyte-to-neuron lactate shuttle mechanism may not operate in the striatum of R6/2 mice3, which may be linked to neurons containing mutant huntingtin3,4. However, we still do not know how lactate is compartmentalized between ICS/ECS under pathological conditions.Diffusion-weighted spectroscopy (DW-MRS) provides information on microstructure, and may possibly inform about compartmentation for metabolites which are not purely intracellular, i.e. glucose and lactate5. Furthermore, time-dependent diffusion6–14 is well suited to probe exchanges15,16 between ICS/ECS. Indeed, lactate time-dependent diffusivity and kurtosis (DL(td)/KL(td)) are a priori influenced by the ICS/ECS, but we previously reported that lactate exchange is presumably negligible in control mice, over the range of diffusion times (td) accessible in such experiments17.
Here, we propose to estimate lactate compartmentation between ICS/ECS, by measuring DL(td)/KL(td) in a cohort composed of zQ175 versus wild-type (WT) mice in a longitudinal study, in order to assess whether lactate compartmentation is altered. We also seek to determine whether lactate exchange might be much faster than in control mice.
Method
Five heterozygous zQ175 mice and five WT mice were anesthetized (~1.1% isoflurane) and scanned with an 11.7 T Bruker scanner equipped with a cryoprobe, using a DW-STE-LASER sequence18, with TE/TR=33.4/2500 ms, and δ=3.1 ms. Diffusion gradient direction was changed at each repetition to perform powder-averaging. Metabolite spectra were acquired in a 30-µL voxel, containing mainly GM ([GM/WM/CSF] ~ [76%/8%/16%]) around the striatum. Spectra were obtained for each td=42.5/100/250/500 ms in two blocks of 32 repetitions and with b=0.2/0.9/1.9/3.2/4.3/6.9/8.0 ms/µm2, for each group at 3, 6 and 12 months.Spectra were analyzed with LCModel19 (including experimental macromolecular spectra in the basis-sets). D(td)/K(td) were estimated by fitting the kurtosis representation 20 to the data.
Results and discussion
Metabolite concentrations exhibit some significant differencesSpectra acquired in the best SNR conditions (td=42.5 ms and b=0.2 ms/µm²) may be used to estimate metabolite concentration (Fig.1). When comparing group-averaged spectra without any normalization, we note that tCr peak is significantly higher in zQ175 than in WT, in line with previous findings2,21, while MM signal appears very stable (Fig.2). Therefore, MM signal may be used as an internal concentration reference. We observe a significant increase in the amount of Ins and Glu from 6 months of age, as previously observed in more severe HD mouse models or at a later age in zQ1752,21. Finally, we also observe a significant decrease in lactate levels in zQ175 strains compared with WT. These changes could be markers of neurodegeneration or inflammation, but do not provide information about compartmentation.
Intracellular metabolite D(td)/K(td) suggest no microstructural changes
In both groups, for each metabolite, diffusivity decreases and kurtosis increases with increasing td, as previously observed in WT22 (Fig.3). There are no significant differences in diffusivity or kurtosis behavior between zQ175 and WT, for all intracellular metabolites (i.e. all detected metabolites except lactate). This might be because zQ175 is a fairly mild HD model, e.g. compared with R6/223. Potential alterations in microstructure (such as cell shrinkage or swelling) would thus be below DW-MRS sensitivity. Ongoing histological analyses should help further assessing this point.
DL(td)/KL(td) exhibit impaired lactate compartmentation
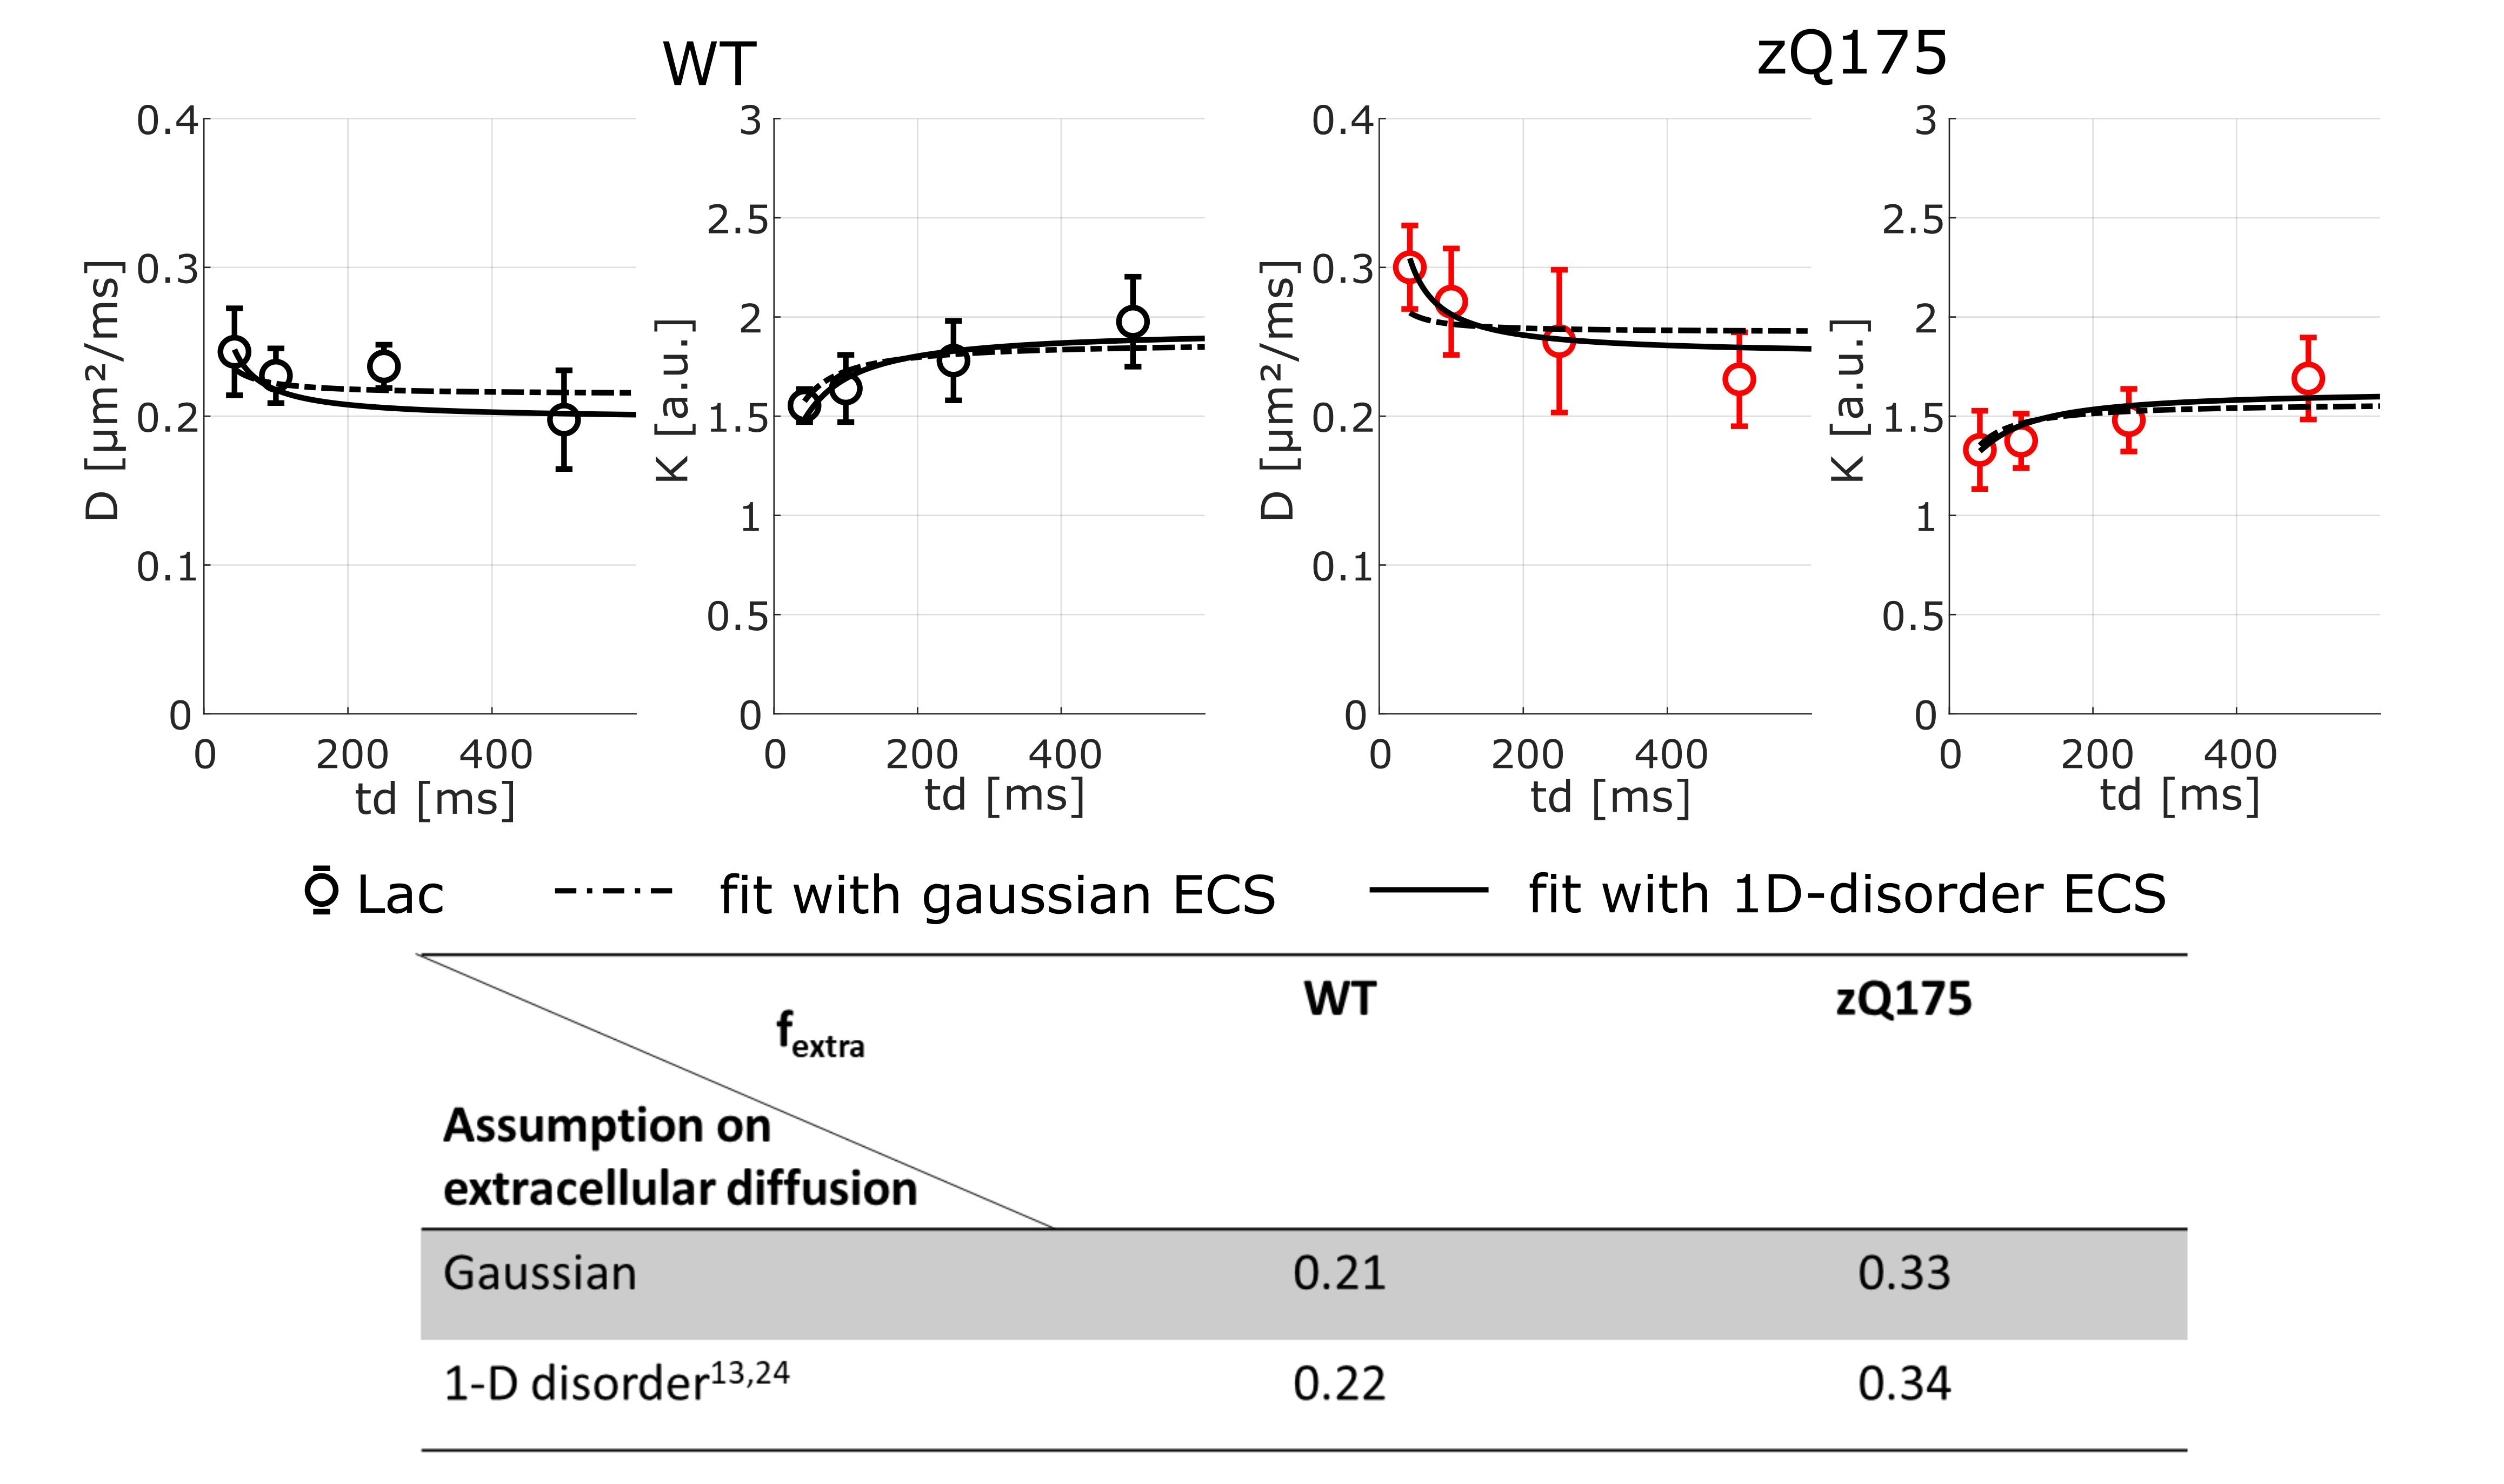
For lactate, DL(td) is higher and KL(td) is lower in zQ175, suggesting a larger contribution from the (less restricted) extracellular space in zQ175. Lactate kurtosis is higher regardless of td and, most importantly, increases with td, so even in a pathological model, we can consider that exchange does not dominate the time-dependence, in which case we would rather observe a decrease with td. To go a step further and try to quantify the extracellular fraction in zQ175 and WT, we applied a two-compartment model (Fig.4 without exchange to fit DL(td)/KL(td) data, including either Gaussian or 1D-disorder13,24 extracellular compartment, and an “intracellular compartment” characterized from intracellular metabolite diffusion). Whatever the assumption for extracellular diffusion, we found a large increase of extracellular fraction in zQ175.
Conclusion
Brain lactate compartmentation appears impaired between WT and zQ175 mice, with larger fextra in zQ175. This result suggests that even in this mild HD model, lactate energy metabolism is impaired, in particular astrocyte-to-neuron shuttling through ECS, in line with the literature on HD3,4. Ultimately, this study illustrates the power of DW-MRS to probe changes in compartmentation.Acknowledgements
This project has received funding from the European Research Council (ERC) under the European Union’s Horizon 2020 research and innovation programs (grant agreement n° 818266) and the UKRI Future Leaders Fellowship MR/T020296/2. 11.7 T scanner was funded by NeurATRIS (“Investissements d'Avenir”, ANR-11-INBS-0011). MP is supported by UKRI Future Leaders Fellowship MR/T020296/2.References
1. Newington JT, Harris RA, Cumming RC. Reevaluating Metabolism in Alzheimer’s Disease from the Perspective of the Astrocyte-Neuron Lactate Shuttle Model. Journal of Neurodegenerative Diseases. 2013;2013:e234572. doi:10.1155/2013/234572
2. Zarate N, Gundry K, Yu D, et al. In vivo MR spectroscopy reflects synapse density in a Huntington’s disease mouse model. bioRxiv. Published online January 26, 2022:2021.10.26.465951. doi:10.1101/2021.10.26.465951
3. Acuña AI, Esparza M, Kramm C, et al. A failure in energy metabolism and antioxidant uptake precede symptoms of Huntington’s disease in mice. Nat Commun. 2013;4(1):2917. doi:10.1038/ncomms3917
4. Solís-Maldonado M, Miró MP, Acuña AI, et al. Altered lactate metabolism in Huntington’s disease is dependent on GLUT3 expression. CNS Neuroscience & Therapeutics. 2018;24(4):343-352. doi:10.1111/cns.12837
5. Pfeuffer J, Tkác I, Gruetter R. Extracellular-intracellular distribution of glucose and lactate in the rat brain assessed noninvasively by diffusion-weighted 1H nuclear magnetic resonance spectroscopy in vivo. J Cereb Blood Flow Metab. 2000;20(4):736-746. doi:10.1097/00004647-200004000-00011
6. Aggarwal M, Burnsed J, Martin LJ, Northington FJ, Zhang J. Imaging neurodegeneration in the mouse hippocampus after neonatal hypoxia–ischemia using oscillating gradient diffusion MRI. Magnetic Resonance in Medicine. 2014;72(3):829-840. doi:10.1002/mrm.24956
7. Arbabi A, Kai J, Khan AR, Baron CA. Diffusion dispersion imaging: Mapping oscillating gradient spin-echo frequency dependence in the human brain. Magnetic Resonance in Medicine. 2020;83(6):2197-2208. doi:10.1002/mrm.28083
8. Baron CA, Beaulieu C. Oscillating gradient spin-echo (OGSE) diffusion tensor imaging of the human brain. Magnetic Resonance in Medicine. 2014;72(3):726-736. doi:10.1002/mrm.24987
9. Does MD. Inferring brain tissue composition and microstructure via MR relaxometry. NeuroImage. 2018;182:136-148. doi:10.1016/j.neuroimage.2017.12.087
10. Wu D, Martin LJ, Northington FJ, Zhang J. Oscillating gradient diffusion MRI reveals unique microstructural information in normal and hypoxia-ischemia injured mouse brains. Magnetic Resonance in Medicine. 2014;72(5):1366-1374. doi:10.1002/mrm.25441
11. Aggarwal M, Smith MD, Calabresi PA. Diffusion-time dependence of diffusional kurtosis in the mouse brain. Magnetic Resonance in Medicine. 2020;84(3):1564-1578. doi:10.1002/mrm.28189
12. Pyatigorskaya N, Le Bihan D, Reynaud O, Ciobanu L. Relationship between the diffusion time and the diffusion MRI signal observed at 17.2 tesla in the healthy rat brain cortex. Magnetic Resonance in Medicine. 2014;72(2):492-500. doi:10.1002/mrm.24921
13. Lee HH, Papaioannou A, Novikov DS, Fieremans E. In vivo observation and biophysical interpretation of time-dependent diffusion in human cortical gray matter. NeuroImage. 2020;222:117054. doi:10.1016/j.neuroimage.2020.117054
14. Wu D, Li Q, Northington FJ, Zhang J. Oscillating gradient diffusion kurtosis imaging of normal and injured mouse brains. NMR in Biomedicine. 2018;31(6):e3917. doi:10.1002/nbm.3917
15. Jelescu IO, de Skowronski A, Geffroy F, Palombo M, Novikov DS. Neurite Exchange Imaging (NEXI): A minimal model of diffusion in gray matter with inter-compartment water exchange. NeuroImage. 2022;256:119277. doi:10.1016/j.neuroimage.2022.119277
16. Olesen JL, Østergaard L, Shemesh N, Jespersen SN. Diffusion time dependence, power-law scaling, and exchange in gray matter. NeuroImage. 2022;251:118976. doi:10.1016/j.neuroimage.2022.118976
17. Mougel E, Palombo M, Valette J. Probing lactate exchange in Gray Matter via time-dependent DW-MRS. In: Proc. Intl. Soc. Mag. Reson. Med. 32. ; 2023:0683.
18. Ligneul C, Palombo M, Valette J. Metabolite diffusion up to very high b in the mouse brain in vivo: Revisiting the potential correlation between relaxation and diffusion properties. Magnetic Resonance in Medicine. 2017;77(4):1390-1398. doi:10.1002/mrm.26217
19. Provencher SW. Automatic quantitation of localized in vivo 1H spectra with LCModel. NMR in Biomedicine. 2001;14(4):260-264. doi:10.1002/nbm.698
20. Jensen JH, Helpern JA. Quantifying Non-Gaussian Water Diffusion by Means of Pulsed-Field-Gradient MRI. In: Proc. Intl. Soc. Mag. Reson. Med. 13. ; 2003:2154.
21. Heikkinen T, Lehtimäki K, Vartiainen N, et al. Characterization of Neurophysiological and Behavioral Changes, MRI Brain Volumetry and 1H MRS in zQ175 Knock-In Mouse Model of Huntington’s Disease. PLOS ONE. 2012;7(12):e50717. doi:10.1371/journal.pone.0050717
22. Mougel E, Valette J, Palombo M. Investigating exchange, structural disorder and restriction in Gray Matter via water and metabolites diffusivity and kurtosis time-dependence. In: Proc. Intl. Soc. Mag. Reson. Med. 31. ; 2022:0255. doi:10.58530/2022/0255
23. Carter RJ, Lione LA, Humby T, et al. Characterization of Progressive Motor Deficits in Mice Transgenic for the Human Huntington’s Disease Mutation. J Neurosci. 1999;19(8):3248-3257. doi:10.1523/JNEUROSCI.19-08-03248.1999
24. Novikov DS, Jensen JH, Helpern JA, Fieremans E. Revealing mesoscopic structural universality with diffusion. Proceedings of the National Academy of Sciences. 2014;111(14):5088-5093. doi:10.1073/pnas.1316944111
Figures
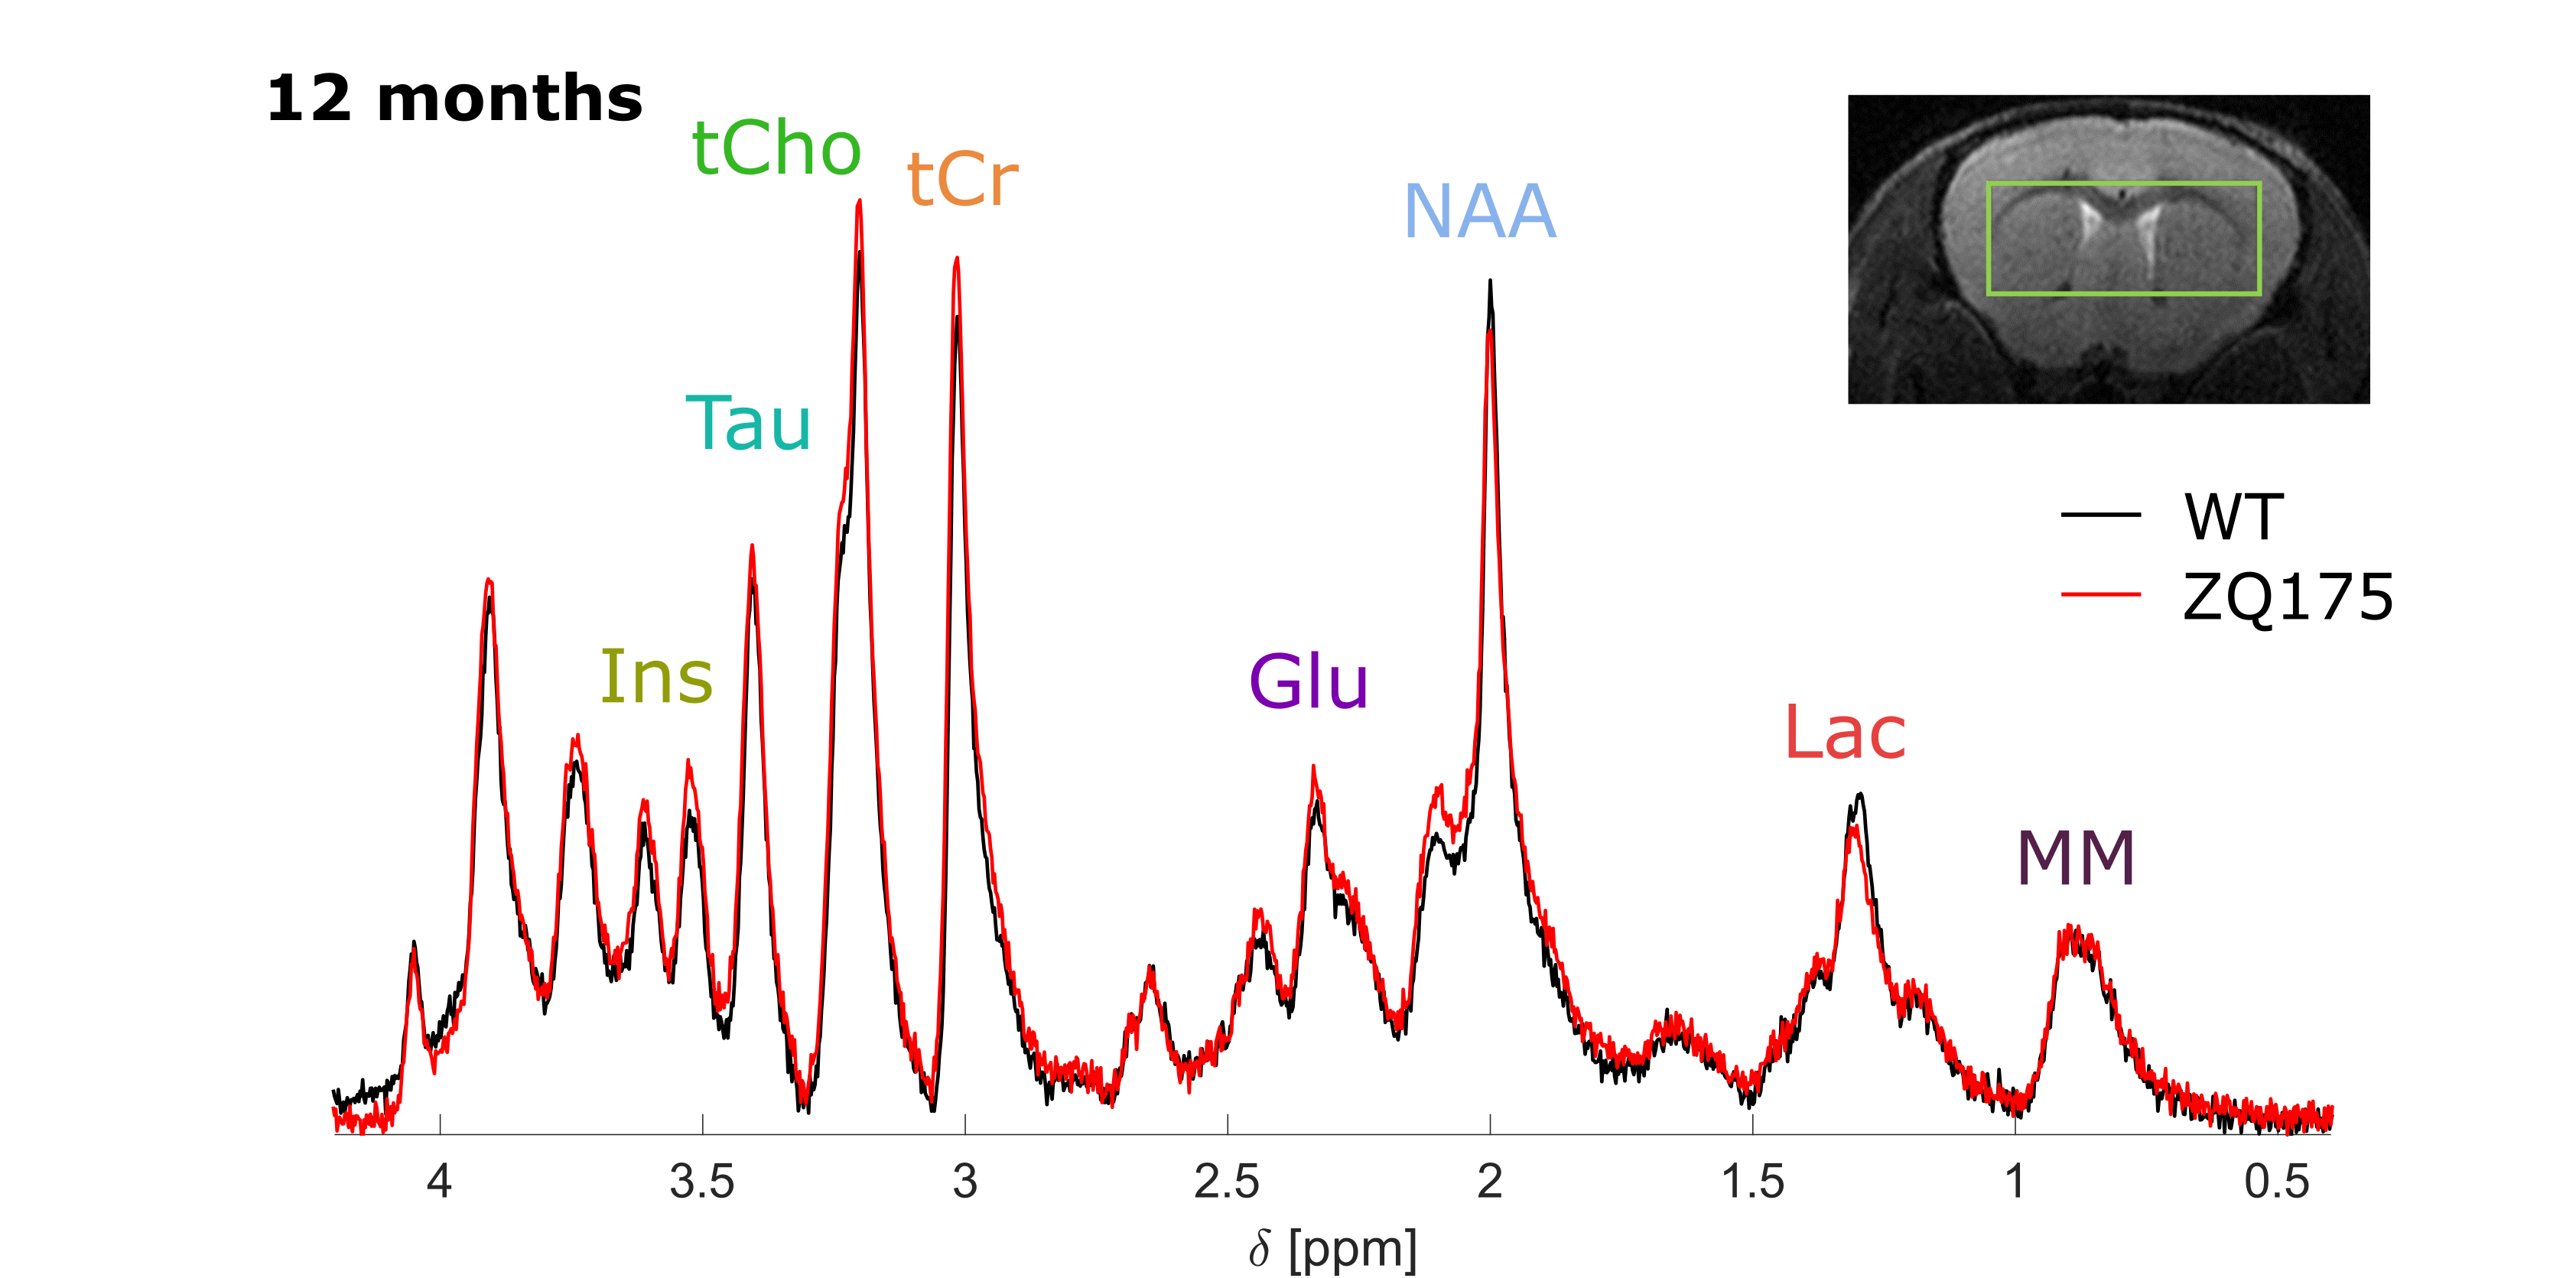
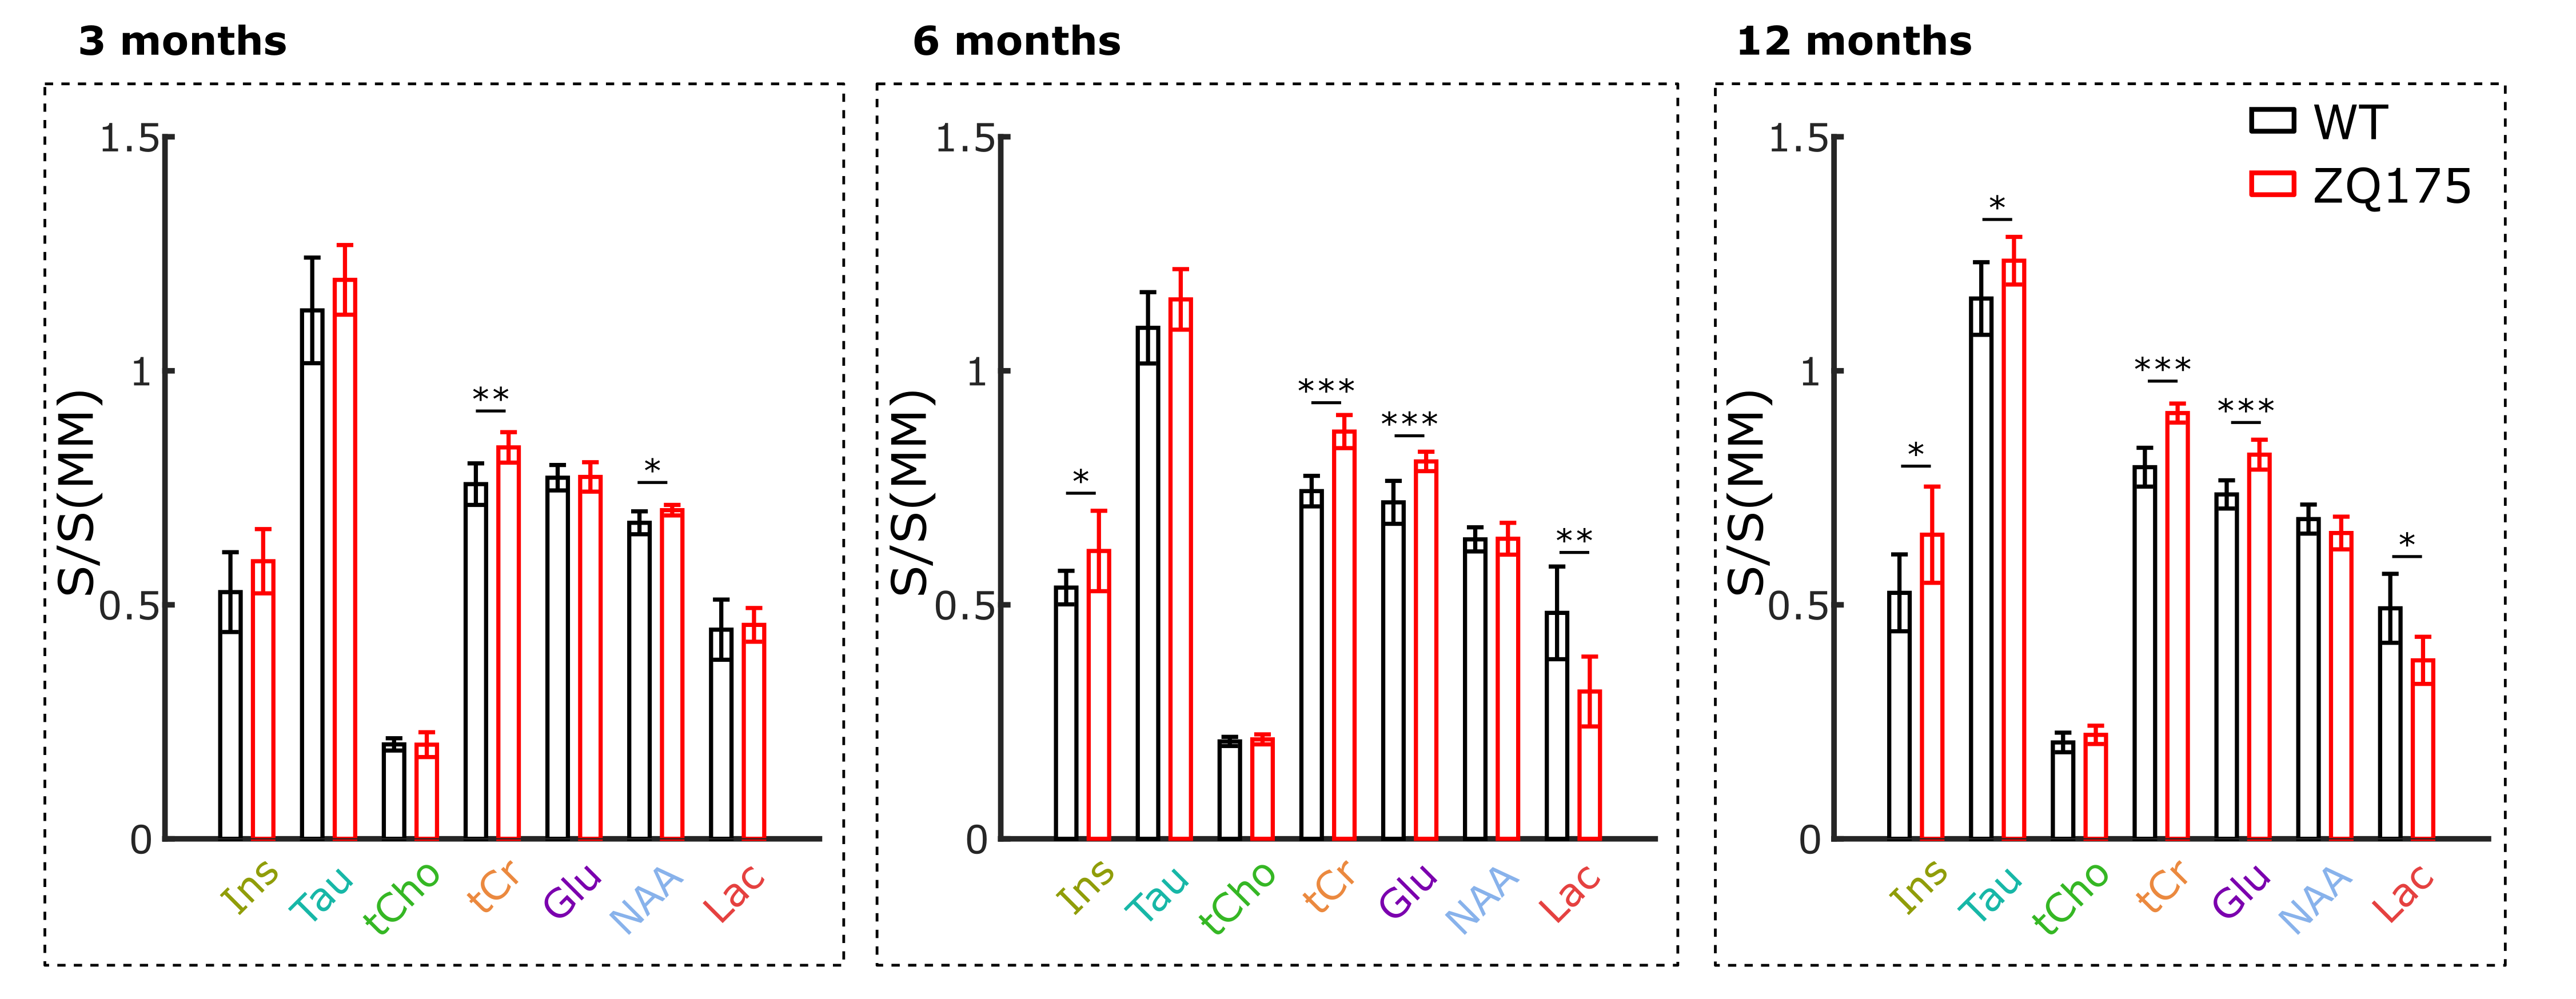
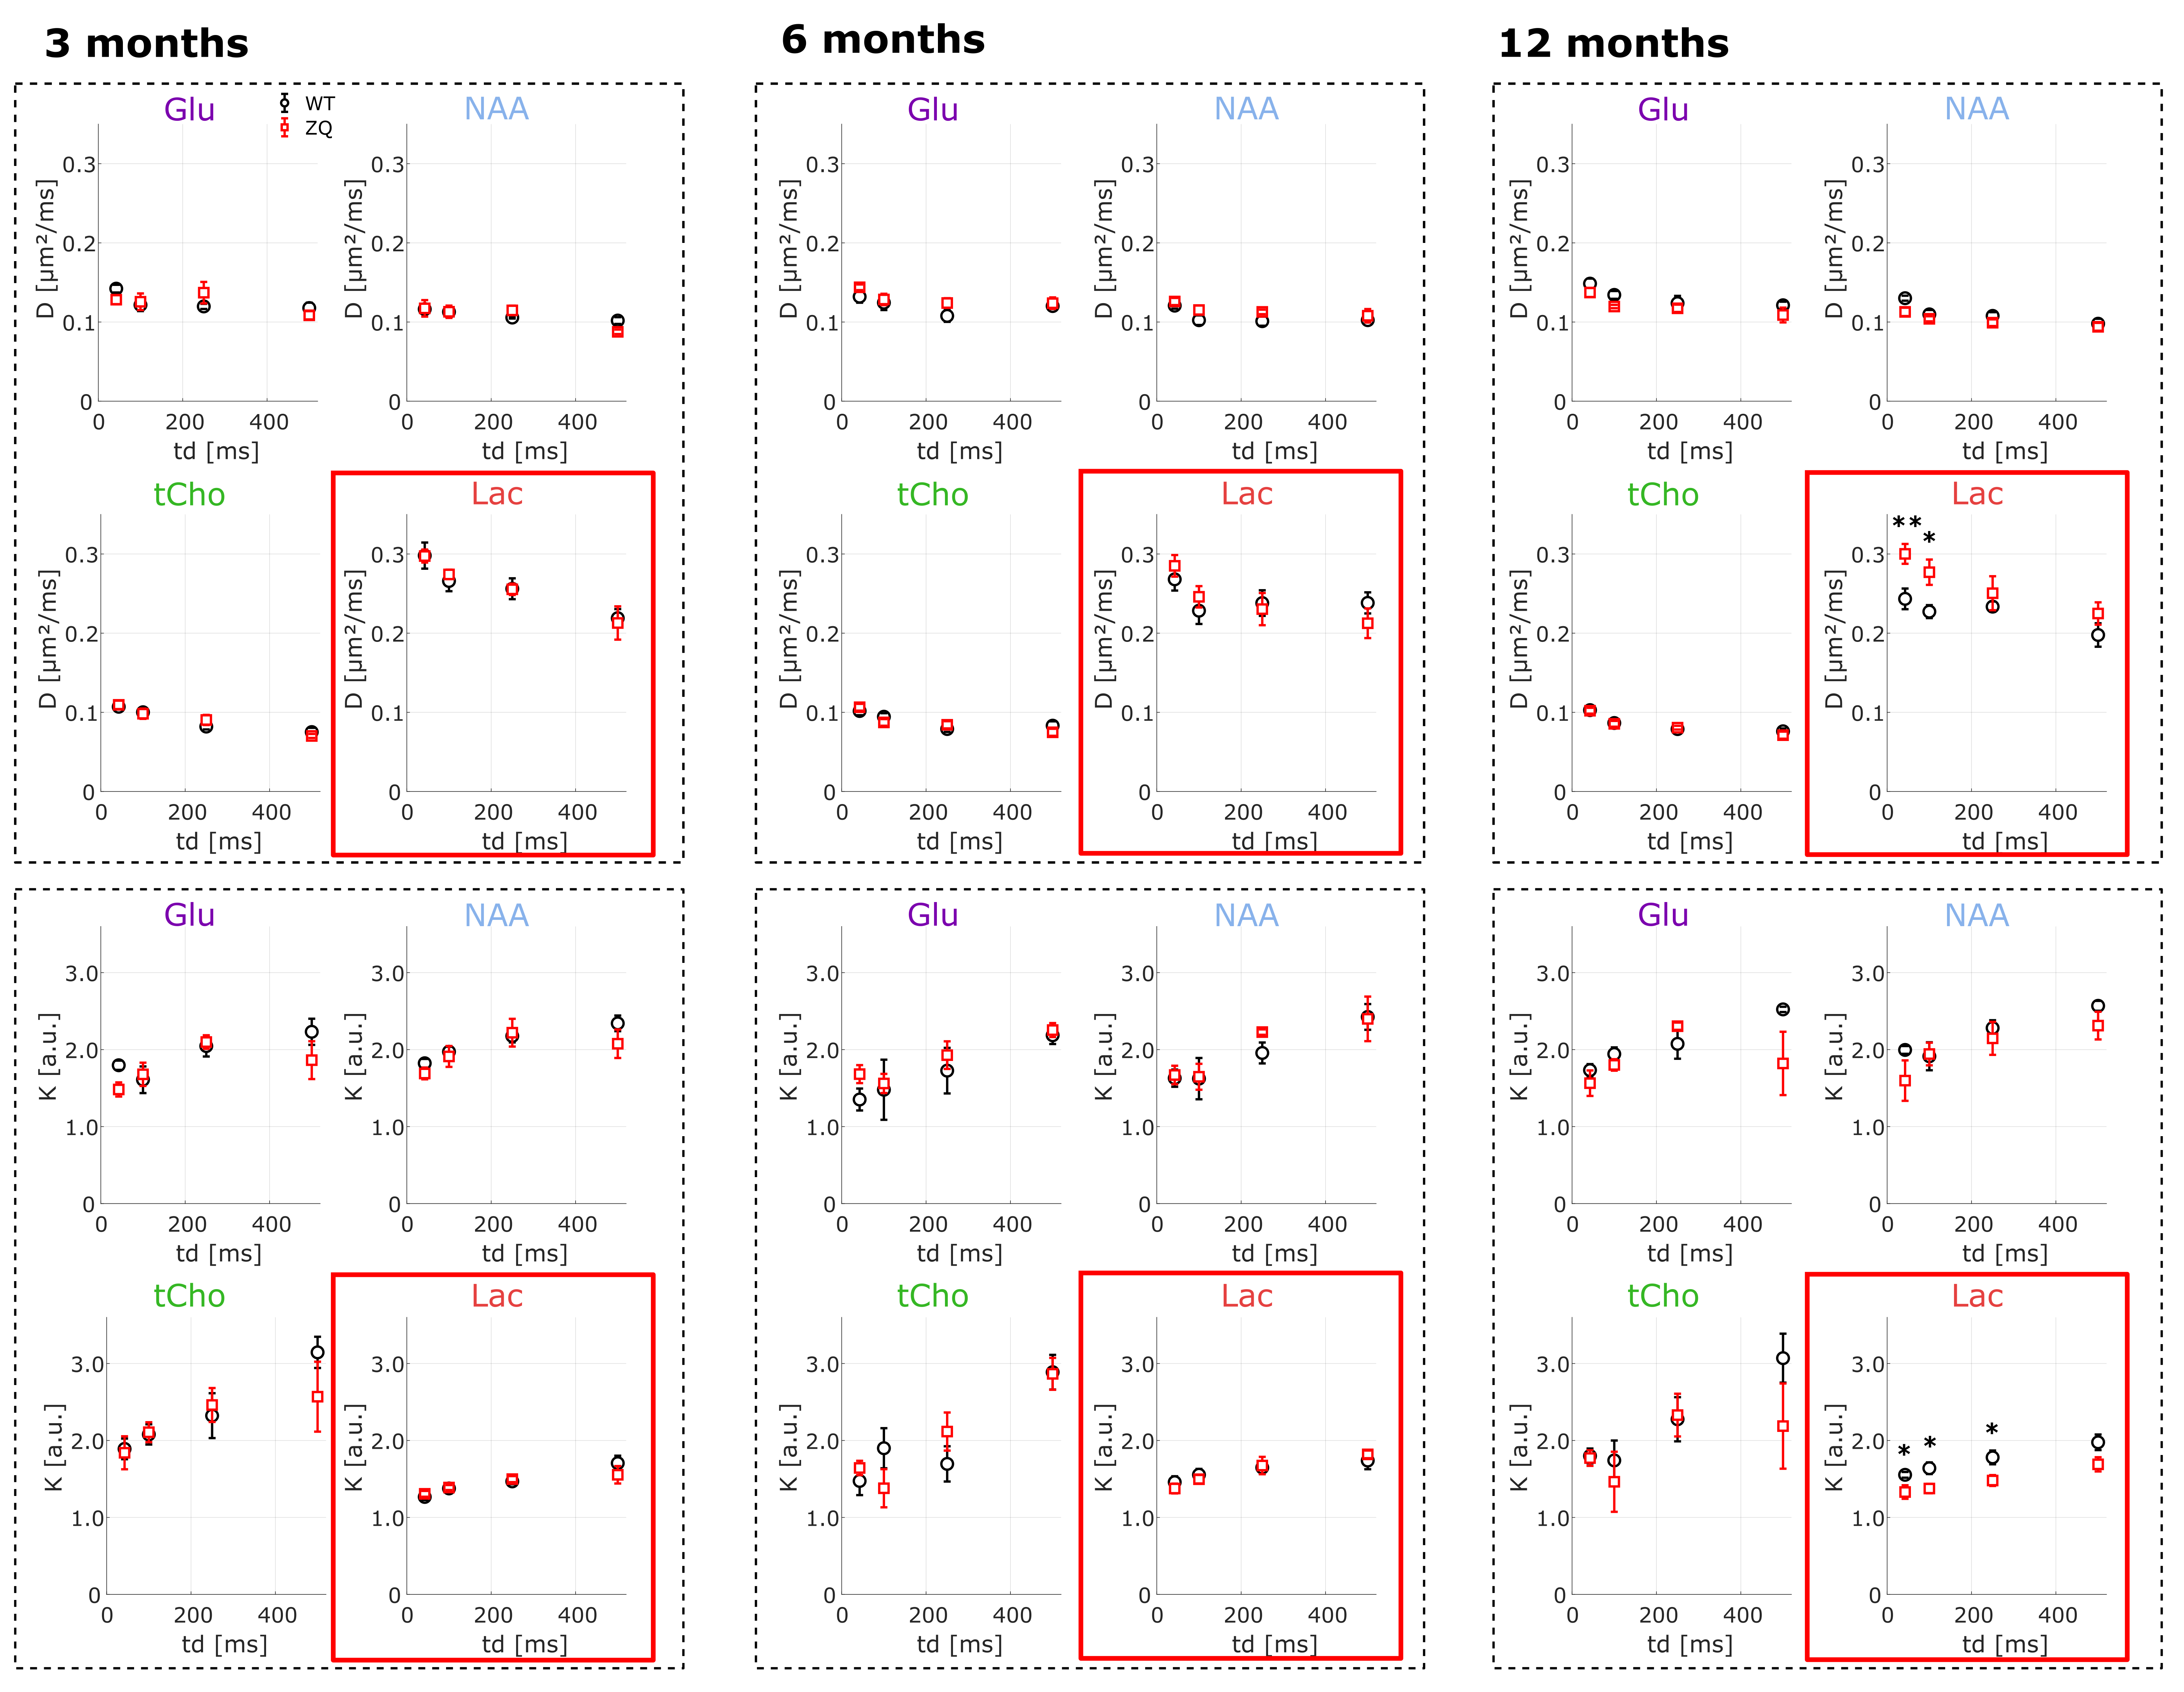
Fig.3: Diffusivity and kurtosis of some intracellular metabolites and lactate as a function of diffusion time, as measured at 3, 6 and 12 months. Statistical analysis was performed to compare both groups at each time point (WT, black; and zQ175, red) using a t-test (* p<0.05,** p< 0.01). No change is observed for intracellular metabolites, while significantly higher D and lower K are measured for lactate in zQ175 at 12 months, indicating a potential larger extracellular contribution.