5093
Multiparametric MRI as a Diagnostic Tool for Metabolic Dysfunction-Associated Steatotic Liver Disease1Radiology and Nuclear Medicine, Amsterdam University Medical Centers, Amsterdam, Netherlands, 2Imaging and Biomarkers, Cancer Center Amsterdam, Amsterdam, Netherlands, 3Vascular Medicine, Amsterdam University Medical Centers, Amsterdam, Netherlands, 4Amsterdam Gastroenterology Endocrinology Metabolism (AGEM) Institute, Amsterdam, Netherlands, 5Gastroenterology and Hepatology, Radboud University Medical Center, Nijmegen, Netherlands, 6Perspectum Ltd., Oxford, United Kingdom, 7Pathology, Amsterdam University Medical Centers, Amsterdam, Netherlands
Synopsis
Keywords: Liver, Quantitative Imaging, Biomarkers, Diagnosis, Elastography, IVIM, Liver
Motivation: The reference standard for diagnosing Metabolic-Dysfunction-Associated Steatotic Liver Disease (MASLD) is invasive liver biopsy. There is a need for non-invasive diagnostic methods to assess MASLD.
Goal(s): The goal was to determine if multiparametric MRI, including cT1-mapping, MR elastography, intravoxel incoherent motion diffusion-weighted MRI and proton-density fat fraction, can effectively diagnose metabolic-dysfunction-associated steatohepatitis (MASH).
Approach: The diagnostic potential of multiparametric MRI parameters was assessed in 75 MASLD patients from the ongoing Amsterdam MASLD cohort study ANCHOR.
Results: Results demonstrated that multiparametric MRI can play a role in diagnosing MASLD stages, providing an alternative non-invasive diagnostic method to liver biopsies.
Impact: This research enables non-invasive diagnosis of Metabolic-Dysfunction-Associated Steatotic Liver Disease by combining cT1, MRE stiffness, and blood marker AST. This provides an alternative to liver biopsy, allowing assessment of the entire liver, which could significantly impact clinical practice and trials.
Introduction
Metabolic-Dysfunction-Associated Steatotic Liver Disease (MASLD) is the leading cause of liver failure1,2. MASLD encompasses various stages, from isolated hepatic steatosis to metabolic-dysfunction-associated steatohepatitis (MASH), culminating in irreversible cirrhosis3. Disease progression heightens the risk of cardiovascular diseases and mortality4,5. Diagnosing and distinguishing MASLD stages is critical in preventing irreversible conditions.Liver biopsy is the reference standard for diagnosing MASLD, utilizing the SAF score (steatosis, disease activity (hepatocyte ballooning+lobular inflammation), and fibrosis)6,7. However, its invasiveness, potential sampling errors and the accompanying risk of post-biopsy bleeding necessitate non-invasive diagnostic tools, especially for repeated assessments in this chronic disease8,9.
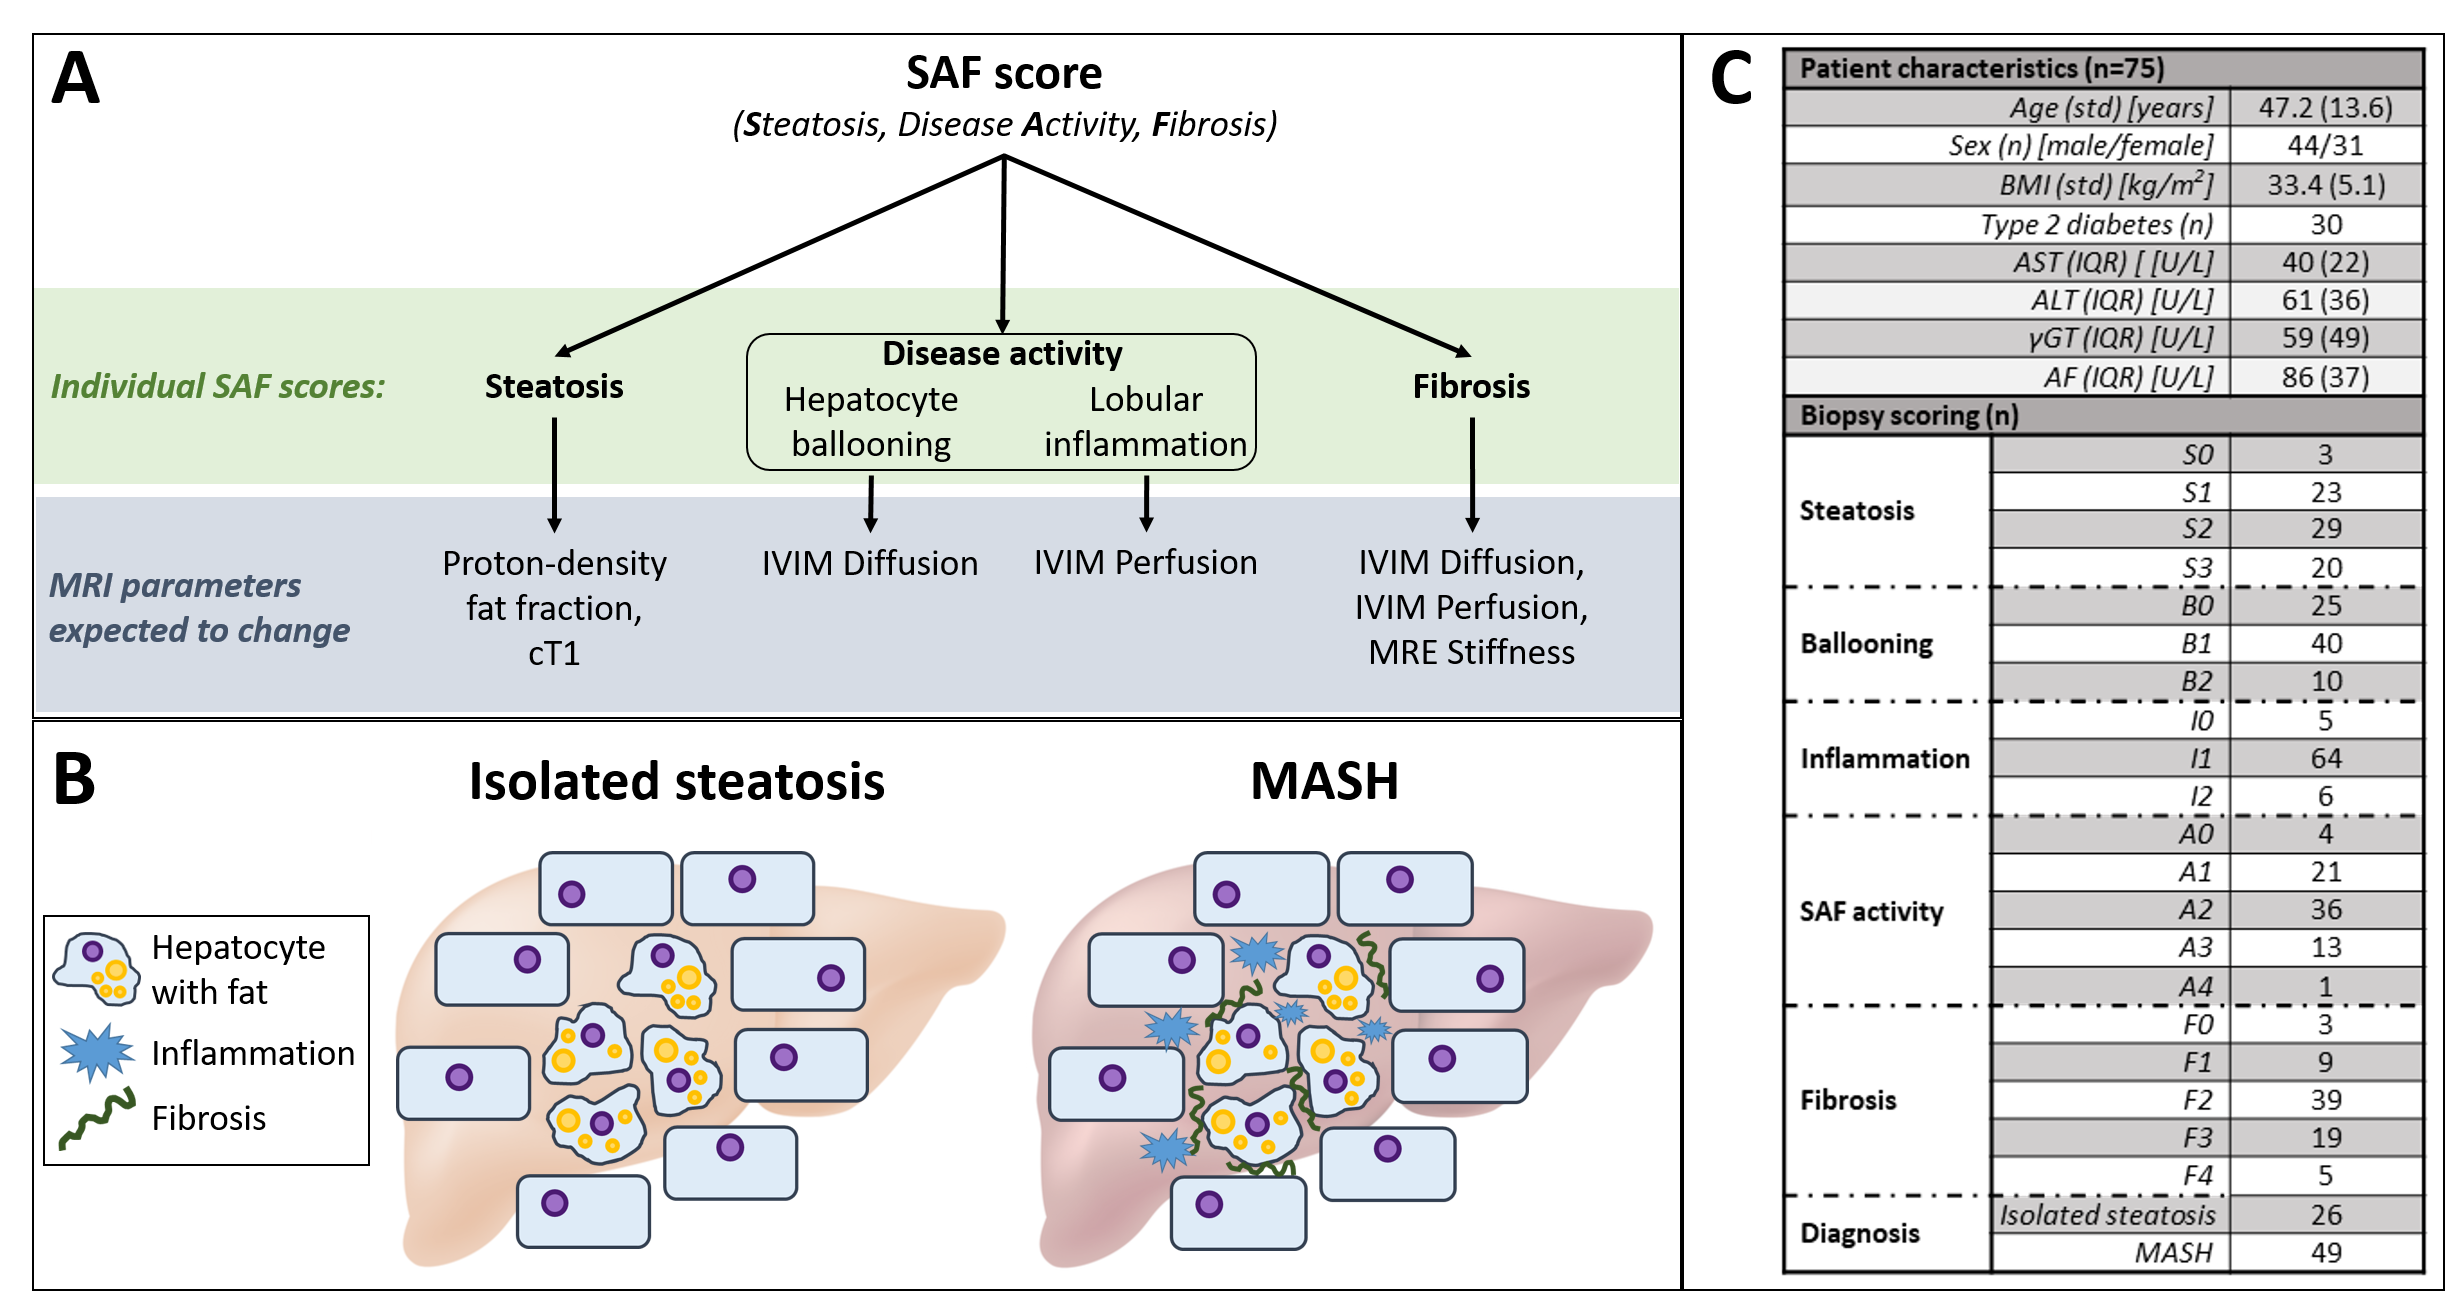
We hypothesize that multiparametric MRI can be a non-invasive alternative for diagnosing and monitoring MASLD (Figure 1A). Proton-density fat fraction (PDFF) and T1 may relate to steatosis grades10. Hepatocyte ballooning, characterized by hepatocyte enlargement and cytoskeletal alterations, may lead to changes in diffusivity observed through intravoxel incoherent motion diffusion-weighted MRI (IVIM)11. In case of acute inflammation, vasodilation will occur, theoretically increasing perfusion in contrast to a decreased perfusion in chronic inflammation. Given that fibrosis signifies the accumulation of collagen and alterations in microcirculation, we anticipate a potential decrease in diffusivity and perfusion, alongside an increase in liver stiffness, measured with MR elastography (MRE)10,12. This research endeavors to verify these hypotheses and assess the diagnostic efficacy of multiparametric MRI for MASLD.
Method
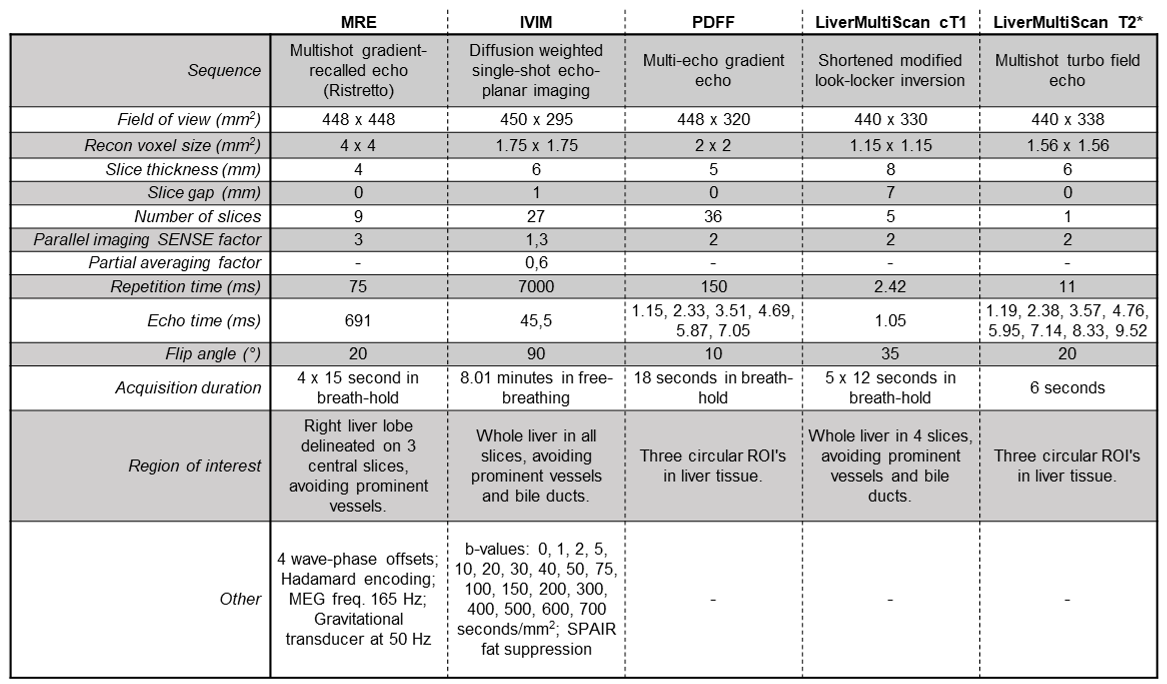
Patients (≥18 years old, BMI>25 kg/m2) with ultrasound-confirmed hepatic steatosis, increased aspartate aminotransferase (AST) and/or alanine aminotransferase (ALT) levels were included. Participants with excessive alcohol use, defined as ≥21 units/week for men and ≥14 units/week for women, were excluded.MRE, IVIM, PDFF, T1 and T2* scans (Table 1) were obtained after 4 hours of fasting (3.0T, Ingenia, Philips). MRE was analyzed with Root software, resulting in liver stiffness and viscosity13. An unsupervised physics-informed deep neural network was used to calculate diffusion, perfusion fraction, and pseudo-diffusion maps from IVIM data14,15. A multi-echo, multifrequency water/fat model with correction for T2* effects provided magnitude-based fat fraction from PDFF scans16. The LiverMultiScan® software (Perspectum Ltd, Oxford, UK) was used for cT1- (iron-corrected) and T2*-mapping17.
Blood samples were collected. Within two weeks, an ultrasound-guided biopsy was performed. Two pathologists scored the tissue samples in tandem according to the SAF score. Patients were classified as isolated steatosis or MASH using the fatty liver inhibition of progression (FLIP) algorithm18(Figure 1B).
After testing for normality (Shapiro-Wilk), the Spearman’s Rank correlation coefficient was computed between MRI parameters, blood markers, and individual SAF scores. The ability of MRI parameters to differentiate SAF groups was tested using the one-way ANOVA test with post-hoc unpaired t-test or Kruskal-Wallis test with post-hoc Tukey HSD test, depending on normality.
Single- and multivariate logistic regression using 5-fold cross-validation was performed on the six variables with the highest Spearman’s Rank correlation coefficients to determine their ability to diagnose MASH. The variable with the highest area under the receiver operating characteristic curve (AUROC) was combined with all other variables for two predictor analyses. Subsequently, the two combinations giving the highest multivariate AUROC were combined for three predictor analysis.
Results
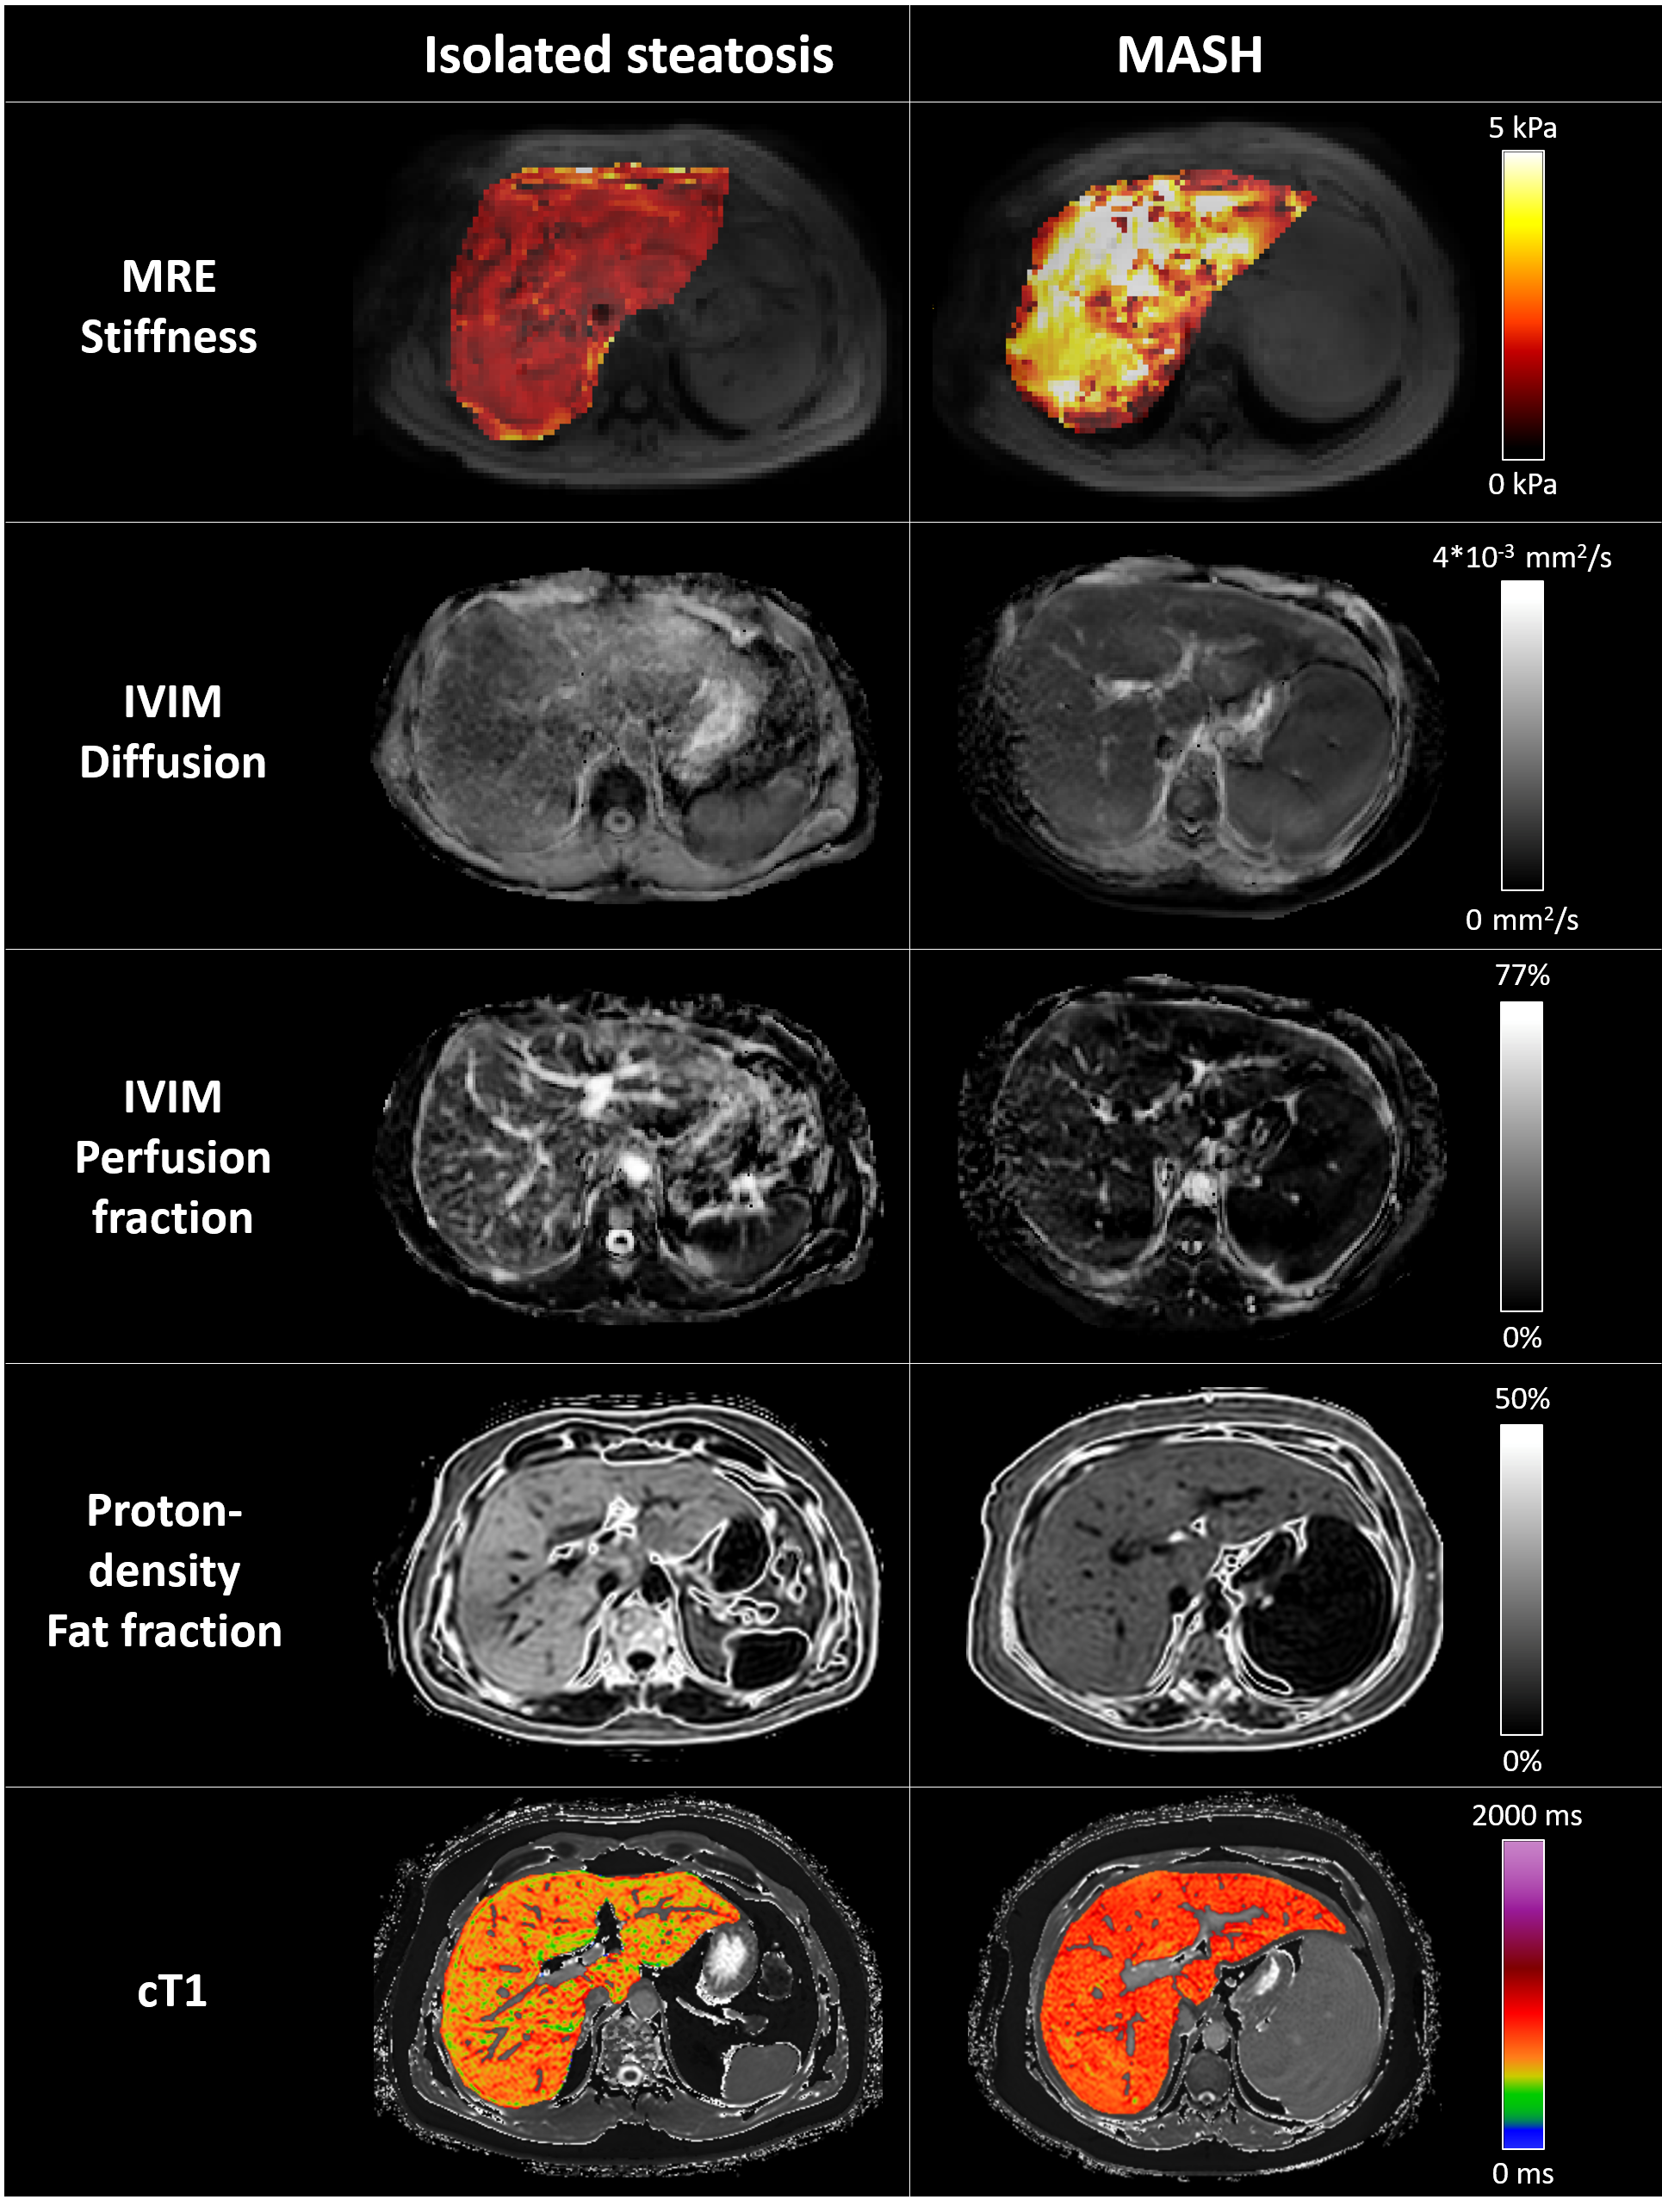
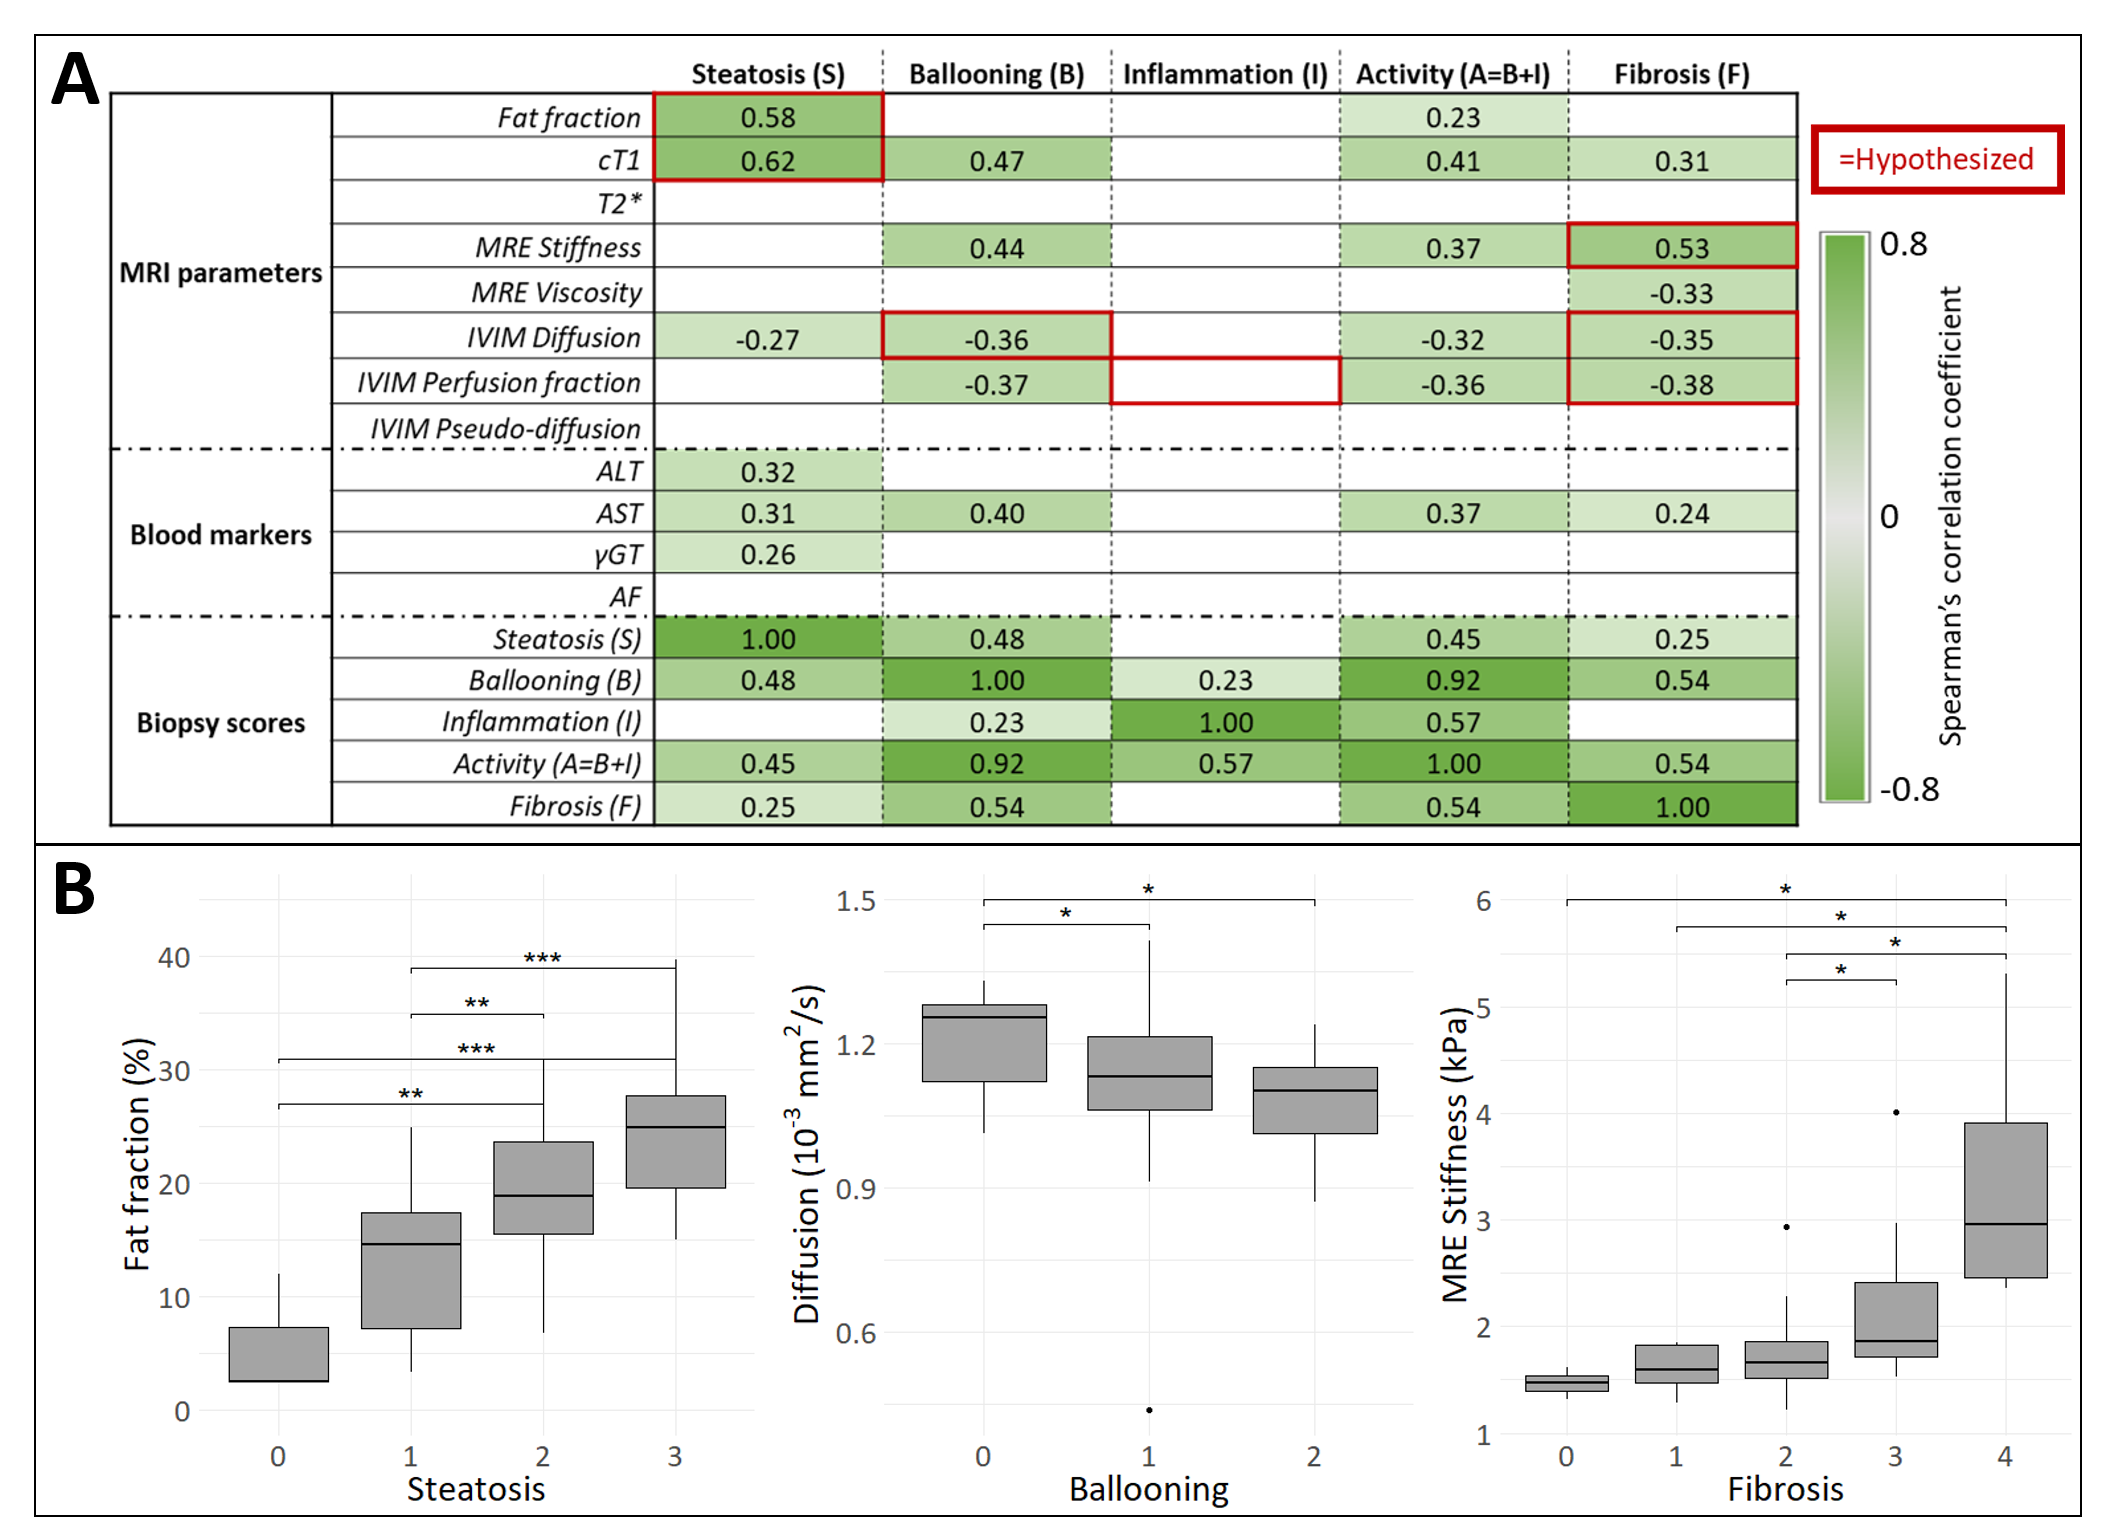
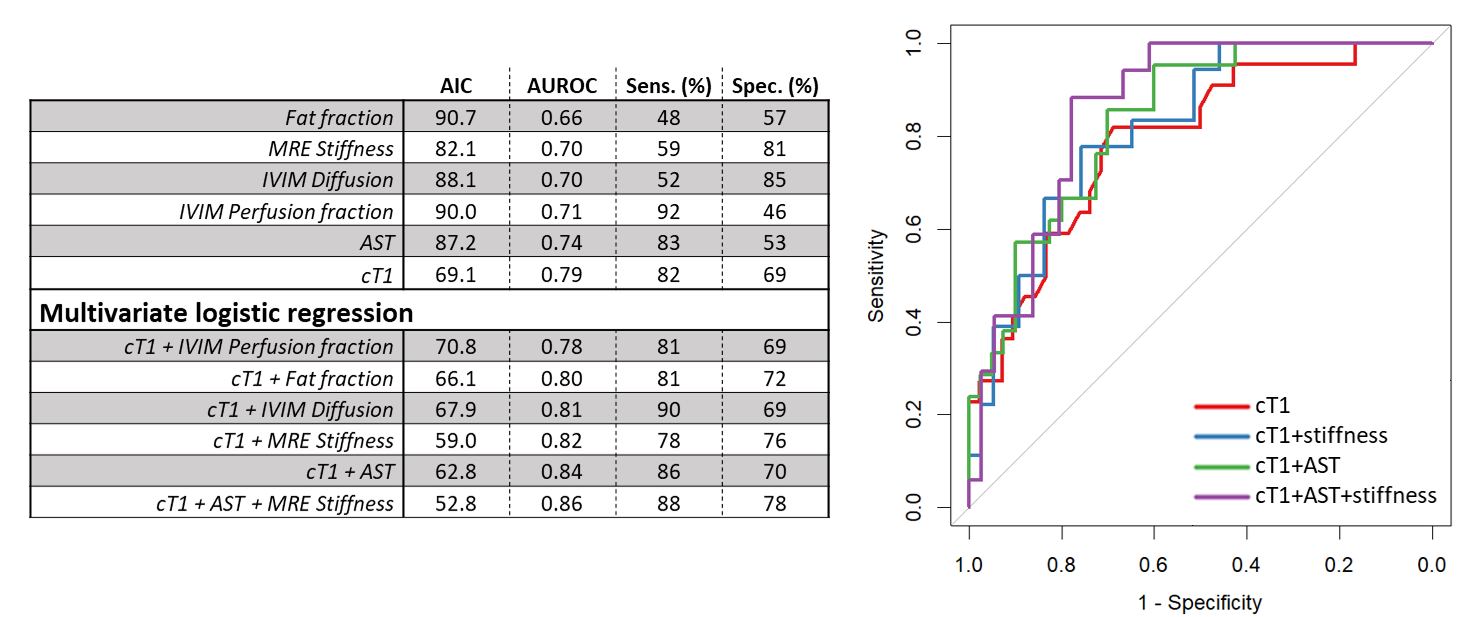
26 isolated steatosis and 49 MASH patients were included (Figure 1C and 2). Most MRI parameters correlated with one or more biopsy scores (Figure 3). cT1 significantly correlates with steatosis, hepatocyte ballooning, disease activity (=ballooning+inflammation) and fibrosis. No correlations with any metric were found for lobular inflammation.With logistic regression analysis, cT1 gives the highest AUROC value for diagnosing MASH (Figure 4). Combining cT1, AST and MRE stiffness results in the highest diagnostic performance (LogOdds=16.267-0.014*cT1-0.051*AST-1.518*MREstiffness) with AUROC of 0.86 and cross-validated sensitivity and specificity of 88% and 78%, respectively.
Discussion
All of our hypotheses (red squares in Figure 3) were verified by significant correlations (green cells), except for inflammation. This could be explained by the small spread of inflammation scores in this patient group (Figure 1C). More correlations were found than stated in the hypothesis, which could be related to the interdependence of the biopsy scores. Disease progression will lead to higher individual SAF scores.By combining cT, AST and MRE stiffness, we were able to diagnose MASH with a sensitivity of 88% and a specificity of 78%. This is of great interest, as no non-invasive biomarker is available to differentiate MASH from isolated steatosis. In previous research, a combination of fat fraction, stiffness and T1 was able to differentiate between non-MASH and MASH patients19. In our study, AST had more added value than fat fraction.
Conclusion
cT1 outperforms other MRI parameters in diagnosing MASH, and its performance increased when combined with AST and MRE stiffness, resulting in a sensitivity of 88% and specificity of 78%.Acknowledgements
No acknowledgement found.References
1. Mary ER, Jeffrey VL, Vlad R, Sven MF, Arun JS, Fasiha K, et al. A multisociety Delphi consensus statement on new fatty liver disease nomenclature. Annals of Hepatology. 2024;29(1):101133.
2. Younossi Z, Tacke F, Arrese M, Chander Sharma B, Mostafa I, Bugianesi E, et al. Global Perspectives on Nonalcoholic Fatty Liver Disease and Nonalcoholic Steatohepatitis. Hepatology. 2019;69(6):2672-82.
3. Hardy T, Oakley F, Anstee QM, Day CP. Nonalcoholic Fatty Liver Disease: Pathogenesis and Disease Spectrum. Annual Review of Pathology: Mechanisms of Disease. 2016;11(1):451-96.
4. Dulai PS, Singh S, Patel J, Soni M, Prokop LJ, Younossi Z, et al. Increased risk of mortality by fibrosis stage in nonalcoholic fatty liver disease: Systematic review and meta‐analysis. Hepatology. 2017;65(5):1557-65.
5. Rod ST, Rebecca JT, Sue B, Hannes H, Patrik N, Jorn MS, et al. Association Between Fibrosis Stage and Outcomes of Patients With Nonalcoholic Fatty Liver Disease: A Systematic Review and Meta-Analysis. Gastroenterology. 2020;158(6):1611-25.e12.
6. Bedossa P, Consortium tFP. Utility and appropriateness of the fatty liver inhibition of progression (FLIP) algorithm and steatosis, activity, and fibrosis (SAF) score in the evaluation of biopsies of nonalcoholic fatty liver disease. Hepatology. 2014;60(2):565-75.
7. Fabio N, Pierre B, Larysa F, Raluca P, Frédéric C, Pascal L, et al. Clinical validation of the FLIP algorithm and the SAF score in patients with non-alcoholic fatty liver disease. Journal of Hepatology. 2020;72(5):828-38.
8. Ratziu V, Charlotte F, Heurtier A, Gombert S, Giral P, Bruckert E, et al. Sampling variability of liver biopsy in nonalcoholic fatty liver disease. Gastroenterology. 2005;128(7):1898-906.
9. Seeff LB, Everson GT, Morgan TR, Curto TM, Lee WM, Ghany MG, et al. Complication rate of percutaneous liver biopsies among persons with advanced chronic liver disease in the HALT-C trial. Clin Gastroenterol Hepatol. 2010;8(10):877-83.
10. Jayakumar S, Middleton MS, Lawitz EJ, Mantry PS, Caldwell SH, Arnold H, et al. Longitudinal correlations between MRE, MRI-PDFF, and liver histology in patients with non-alcoholic steatohepatitis: Analysis of data from a phase II trial of selonsertib. Journal of Hepatology. 2019;70(1):133-41.
11. Caldwell S, Ikura Y, Dias D, Isomoto K, Yabu A, Moskaluk C, et al. Hepatocellular ballooning in NASH. J Hepatol. 2010;53(4):719-23.
12. Tao YY, Zhou Y, Wang R, Gong XQ, Zheng J, Yang C, et al. Progress of intravoxel incoherent motion diffusion-weighted imaging in liver diseases. World J Clin Cases. 2020;8(15):3164-76.
13. Rene B, Fons R. ROOT — An object oriented data analysis framework. Nuclear Instruments and Methods in Physics Research Section A: Accelerators, Spectrometers, Detectors and Associated Equipment. 1997;389(1):81-6.
14. Barbieri S, Gurney-Champion OJ, Klaassen R, Thoeny HC. Deep learning how to fit an intravoxel incoherent motion model to diffusion-weighted MRI. Magnetic Resonance in Medicine. 2020;83(1):312-21.
15. Kaandorp MPT, Barbieri S, Klaassen R, van Laarhoven HWM, Crezee H, While PT, et al. Improved unsupervised physics-informed deep learning for intravoxel incoherent motion modeling and evaluation in pancreatic cancer patients. Magn Reson Med. 2021;86(4):2250-65.
16. Yokoo T, Shiehmorteza M, Hamilton G, Wolfson T, Schroeder ME, Middleton MS, et al. Estimation of hepatic proton-density fat fraction by using MR imaging at 3.0 T. Radiology. 2011;258(3):749-59.
17. Mojtahed A, Kelly CJ, Herlihy AH, Kin S, Wilman HR, McKay A, et al. Reference range of liver corrected T1 values in a population at low risk for fatty liver disease-a UK Biobank sub-study, with an appendix of interesting cases. Abdom Radiol (NY). 2019;44(1):72-84.
18. Bedossa P, Poitou C, Veyrie N, Bouillot J-L, Basdevant A, Paradis V, et al. Histopathological algorithm and scoring system for evaluation of liver lesions in morbidly obese patients. Hepatology. 2012;56(5):1751-9.
19. Kim JW, Lee Y-S, Park YS, Kim B-H, Lee SY, Yeon JE, Lee CH. Multiparametric MR Index for the Diagnosis of Non-Alcoholic Steatohepatitis in Patients with Non-Alcoholic Fatty Liver Disease. Scientific Reports. 2020;10(1):2671.
Figures