5088
Quantitative MRI of the Prostate with Age: T1 Relaxation, T2 Relaxation, Mean Diffusivity, and Volume1Biomedical Engineering, University of Alberta, Edmonton, AB, Canada, 2Radiology and Diagnostic Imaging, University of Alberta, Edmonton, AB, Canada, 3Urology, University of Alberta, Edmonton, AB, Canada
Synopsis
Keywords: Prostate, Aging
Motivation: T1 relaxation, T2 relaxation, mean diffusivity (MD) and volume can offer valuable information about prostate tissue remodeling that may occur with cancer and aging.
Goal(s): These age relationships are relevant for identification of cancer thresholds, but also provide insight on unique prostate zone changes with age.
Approach: 74 normal volunteers aged 19-69 years were scanned.
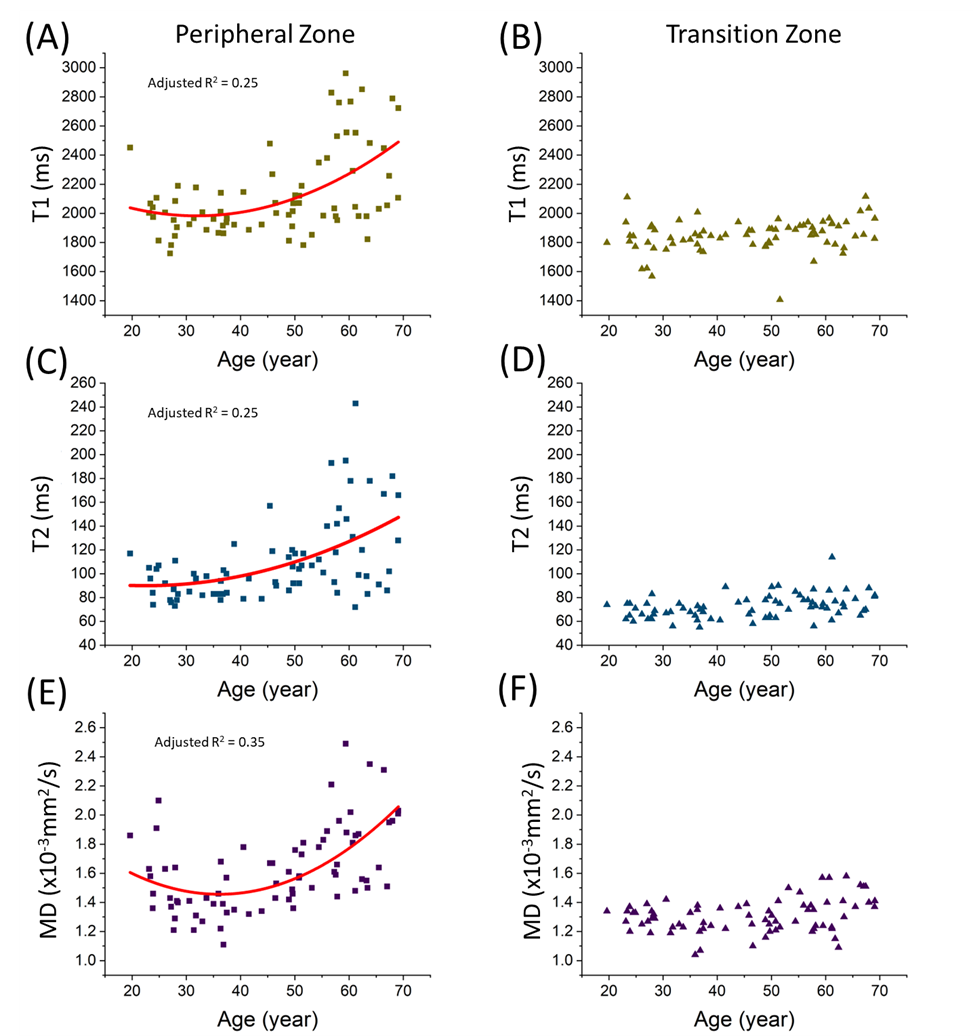
Results: T1, T2, MD and volume in the peripheral zone showed a positive quadratic association with age being mainly flat and then increasing after 45 years. In contrast, there were no such T1/T2/MD versus age correlations in the transition zone, despite a marked increase of volume with aging.
Impact: Quantitative T1/T2 relaxation and mean diffusivity demonstrate microstructural changes of the prostate, particularly in the peripheral zone and not the transition zone, with typical aging (19-69 years) which may provide a ‘normative’ benchmark for tumor identification.
Introduction
Diffusion-weighted imaging (DWI) with mean diffusivity (MD) mapping and T2-weighted imaging are standard components of clinical practice for prostate MRI1. T1 and T2 mapping are not routinely employed, but may provide complementary information for tumor identification and characterization. T1 and T2 mapping techniques also offer advantages including higher resolution, shorter scans, and reduced distortion compared to diffusion MRI. Quantitative T1 and T2 cut-off values have been proposed to differentiate prostate cancer in both the transition zone (TZ) and peripheral zone (PZ), which have regional differences2–4. However, this relies on knowledge of typical ‘healthy’ values, but patients have been combined over a wide age span neglecting potential age effects. To date, studies have only explored age-related alterations in prostate volume and MD5,6. The purpose here is to determine how T1 and T2 values, as well as MD and volume, change with age in the prostate with typical aging.Methods
Prostate MRI was acquired on a 3T Siemens Prisma in male volunteers without diagnosis of prostate cancer (n=74, 19-69 years) using four scans with the same 40 1.8 mm slices with 1.8x1.8 mm2 in-plane resolution including: (i) T2-weighted anatomical (TSE, TE 52 ms, 6:44 min) for volumes, (ii) DWI (SS-EPI, b0, b750 s/mm2, 6 directions, 15 averages, 8:39 min) for MD, (iii) dual flip angle 3D VIBE (flip 1 and 8 deg, TE 2.29 ms, TR 5.11 ms, 4:08 min) for T1 map and (iv) dual-echo TSE (TE 13 and113 ms, 2:17 min) for T2 map. DWI was processed with DIPY, T1 maps were calculated by Siemens “MapIt”, and T2 maps were computed using in-house software, incorporating Bloch fitting of proton density weighted (PDW) and T2 weighted images with B1+ map7. For evaluating MD, T1 and T2 values in PZ and TZ, separate Regions of Interest (ROIs) were identified manually on the mean DWI, T1 map and T2 map across multiple slices, within both zones. For volume measurement, ROIs were drawn on the single-echo T2-weighted anatomical images for PZ and TZ. Quadratic curve fitting examined the relationship between T1, T2, MD or volume versus age in both zones. Summary parameters were assessed for below 45 years (n=32) and above 45 years (n=42) with an unpaired t-test (p<0.05).Results
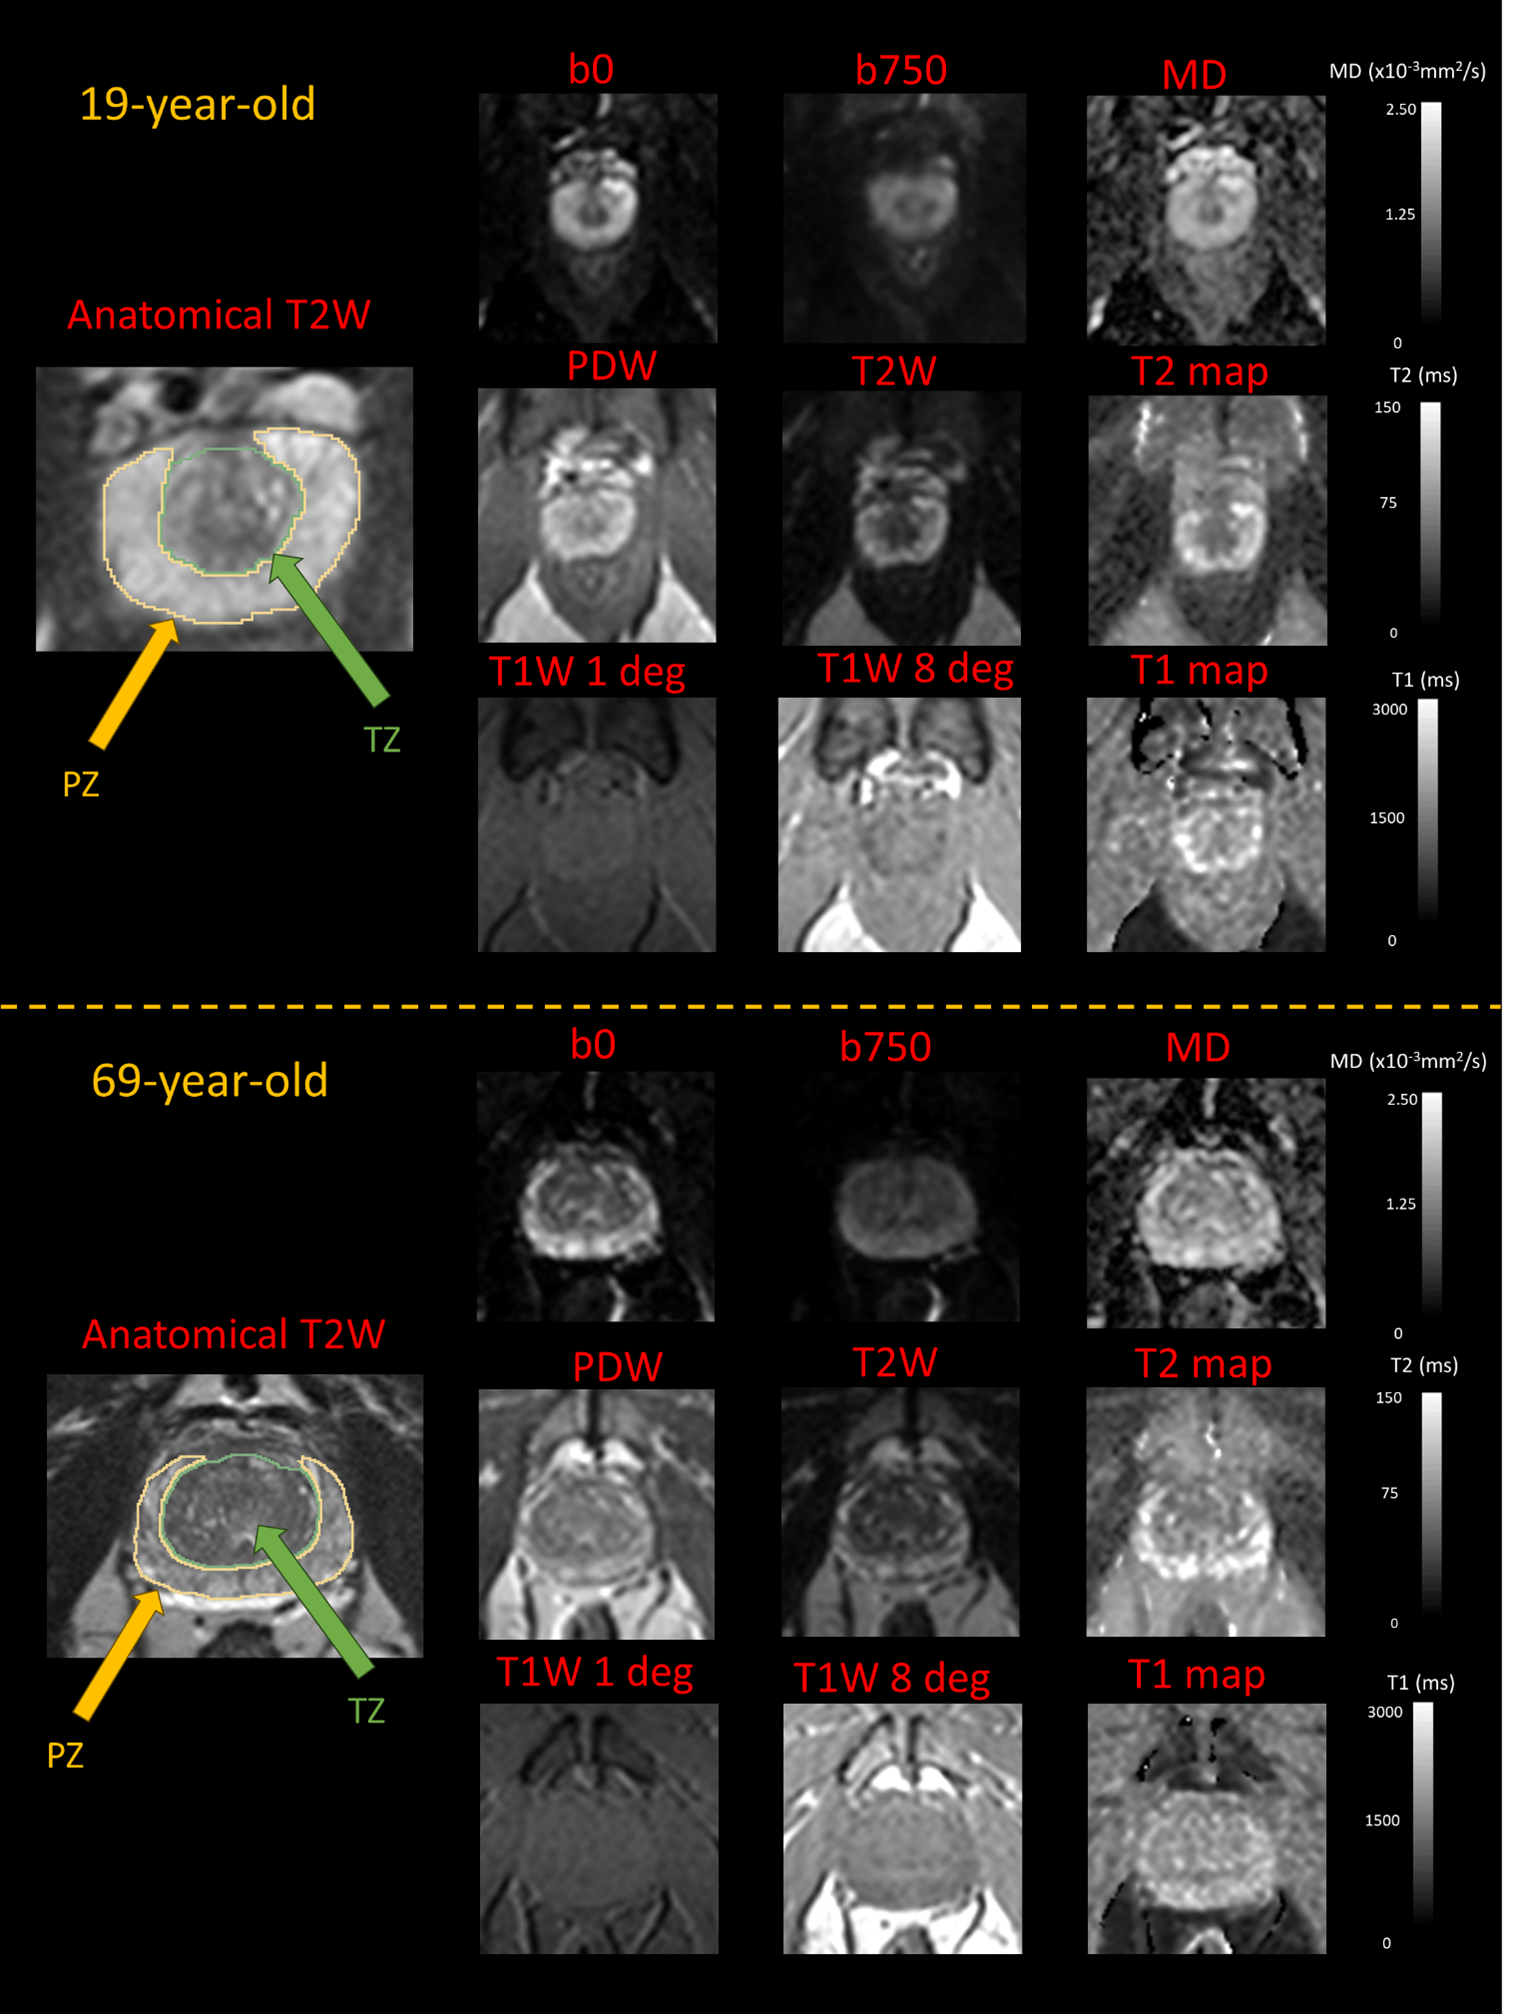
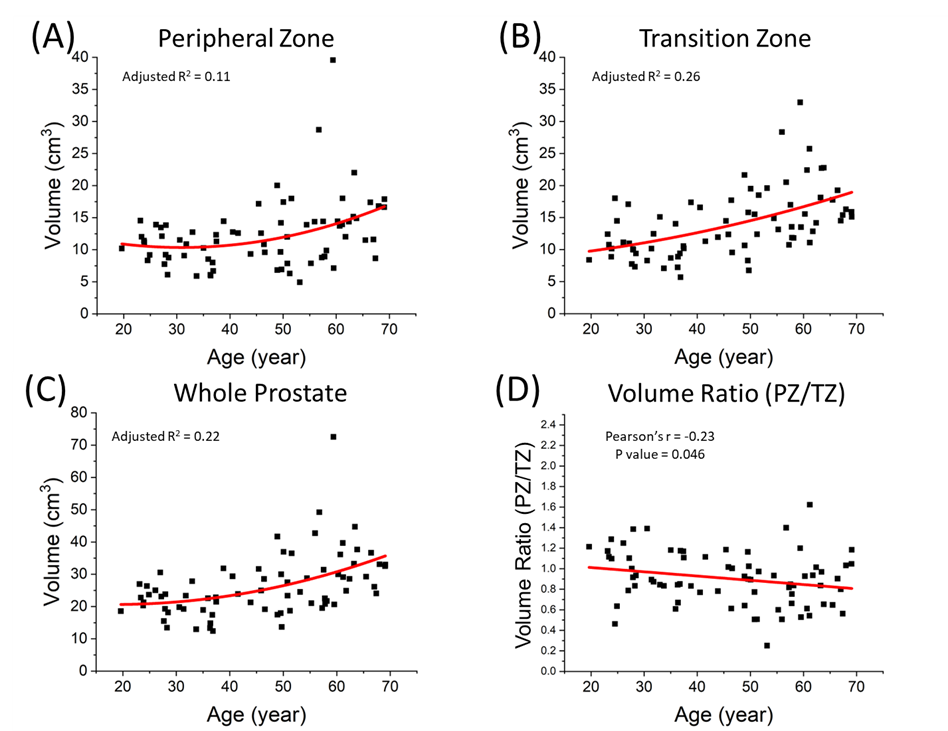
High-quality prostate images and maps are shown for a representative younger (19 years) and older (69 years) participant demonstrating larger overall volume and elevated T2 and MD in the PZ, but not the TZ in the older person (Figure 1). Table 1 details age group means and standard deviations, with T1, T2, MD in PZ being significantly higher and more variable in >45-year-olds but not in TZ, and PZ has higher values than TZ in both age groups. Volume for PZ and TZ were significantly larger in >45-year-olds. T1, T2, and MD in the PZ exhibited a positive quadratic association with age being constant over ~19-45 years followed by increases after ~45 years (Figure 2A,C,E). However, the older age group is heterogeneous with about half showing elevated values (T1, T2 or MD) and the other half showing similar values to the younger individuals. In contrast to PZ, there were no such age relationships in TZ (Figure 2B,D,F). The volume of PZ, TZ and whole prostate showed a positive quadratic association with age with a similar inflection point as above. (Figure 3). The PZ and TZ volumes are 45% and 80% larger, respectively, at 69 years relative to 19 years.Discussion
Our T1 and T2 values align with previous studies, despite different acquisition strategies (e.g., MR fingerprinting for T1 and T2, MOLLI for T1, and multi-echo spin-echo for T2)2–4 and their changes, as well as MD, in the PZ with typical aging suggest the importance of age considerations in defining prostate cancer detection thresholds (in addition to the region). Despite a more pronounced volume change with age in TZ than PZ, no age-related changes were observed for T1, T2, or MD values in TZ. This suggests that the tissue micro-composition within the TZ remains consistent throughout the aging process, as opposed to the PZ that shows marked elevations of all three metrics after the age of 45 years, albeit not in everyone. Quantitative mapping of T1, T2, and MD can provide insight into prostate changes with typical aging and may be relevant for understanding prostate cancer risk/evolution in addition to providing an age-relevant baseline for establishing quantitative thresholds for the identification of abnormal tissue, including prostate cancer.Acknowledgements
No acknowledgement found.References
- Padhani AR, Weinreb J, Rosenkrantz AB, Villeirs G, Turkbey B, Barentsz J. Prostate Imaging-Reporting and Data System Steering Committee: PI-RADS v2 Status Update and Future Directions. Eur Urol. 2019;75(3):385-396. doi:10.1016/j.eururo.2018.05.035
- Klingebiel M, Schimmöller L, Weiland E, et al. Value of T2 Mapping MRI for Prostate Cancer Detection and Classification. Journal of Magnetic Resonance Imaging. 2022;56(2):413-422. doi:10.1002/jmri.28061
- Baur ADJ, Hansen CM, Rogasch J, et al. Evaluation of T1 relaxation time in prostate cancer and benign prostate tissue using a Modified Look-Locker inversion recovery sequence. Sci Rep. 2020;10(1). doi:10.1038/s41598-020-59942-z
- Yu AC, Badve C, Ponsky LE, et al. Development of a combined Mr Fingerprinting and Diffusion examination for Prostate cancer. Radiology. 2017;283(3):729-738. doi:10.1148/radiol.2017161599
- Tamada T, Sone T, Toshimitsu S, et al. Age-related and zonal anatomical changes of apparent diffusion coefficient values in normal human prostatic tissues. Journal of Magnetic Resonance Imaging. 2008;27(3):552-556. doi:10.1002/jmri.21117
- Turkbey B, Huang R, Vourganti S, et al. Age-related changes in prostate zonal volumes as measured by high-resolution magnetic resonance imaging (MRI): A cross-sectional study in over 500 patients. BJU Int. 2012;110(11):1642-1647. doi:10.1111/j.1464-410X.2012.11469.x
- McPhee KC, Wilman AH. Transverse relaxation and flip angle mapping: Evaluation of simultaneous and independent methods using multiple spin echoes. Magn Reson Med. 2017;77(5):2057-2065. doi:10.1002/mrm.26285
Figures