5086
Comparative Quantitative Analysis in Ultrafast DCE Breast MRI: Population-Based Versus Individual Arterial Input Functions1Radiology, Fudan University Shanghai Cancer Center, Shanghai, China, 2Oncology, Shanghai Medical College, Fudan University, Shanghai, China, 3Radiology, Longhua Hospital, Shanghai University of Traditional Chinese Medicine, Shanghai, China, 4MR Applications Development, Siemens Shenzhen Magnetic Resonance Ltd., Shenzhen, China, 5MR Application Predevelopment, Siemens Healthineers AG, Erlangen, Germany
Synopsis
Keywords: Breast, Breast, Cancer
Motivation: CAIPIRINHA-Dixon-TWIST-VIBE (CDTV) ultrafast dynamic contrast-enhanced MRI helps in characterizing breast cancer.
Goal(s): However, no study has compared the accuracies of quantitative analysis using population-based arterial input function (P-AIF) and individual AIF (I-AIF) for diagnosing breast cancer.
Approach: This study aimed to evaluate and compare the diagnostic accuracies of the inline quantitative analysis with P-AIF and I-AIF in diagnosing breast cancer.
Results: It demonstrated a similarity in the quantitative analysis using P-AIF from CDTV and I-AIF in characterizing breast lesions.
Impact: This study transforms breast cancer diagnosis by validating P-AIF's efficiency in CDTV MRI, offering prospects for streamlined, faster clinical application. It encourages exploration into broader adaptations, aiming to provide the accurate diagnosis and prognosis through expedited, accessible testing methodologies.
Keywords
Arterial input function, breast cancer, CAIPIRINHA-Dixon-TWIST-VIBE, dynamic contrast-enhanced MRI, individual AIF, population-based AIF, quantitative analysisIntroduction
Recently, CAIPIRINHA-Dixon-TWIST-VIBE (CDTV) with a high acceleration factor and k-space view-sharing technique has been used for its high spatial–temporal resolution in quantitative dynamic contrast-enhanced (DCE) MRI for breast cancer diagnosis1. Furthermore, using an average population-based arterial input function (P-AIF) and inline quantitative mapping can eliminate the need for time-consuming manual post-processing by physicians2. However, a consensus on the preference for AIFs has not yet been established—whether they should be based on average population metrics or specified individually. This study aimed to investigate the consistency between quantitative parameters produced inline using P-AIF and those generated offline using individual AIFs (I-AIF), and evaluate and compare the diagnostic accuracies of these parameters derived from both methodologies.Methods
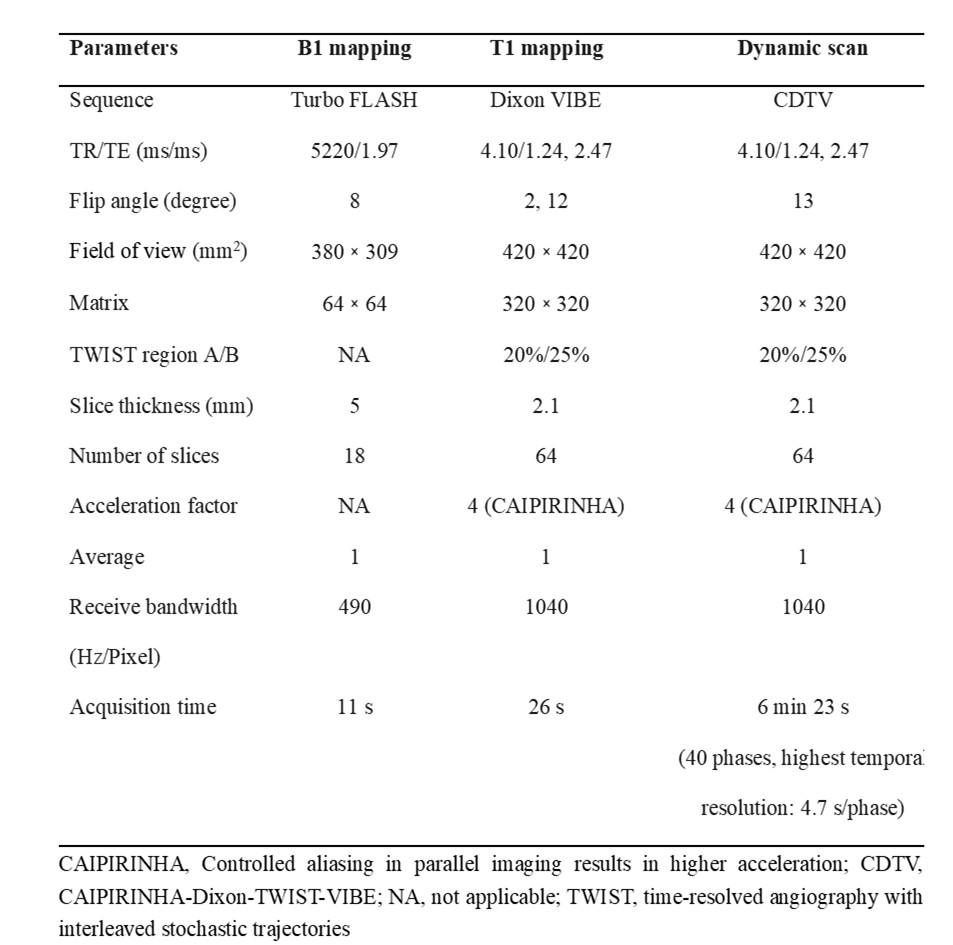
This study prospectively enrolled 99 women (mean age, 50 years; age range, 22-76 years) presenting 109 breast lesions (85 malignant and 24 benign) from Fudan University Shanghai Cancer Center between June 2019 and October 2019. Patients with problem solving in cases of dense breast tissue or equivocal findings on ultrasound or mammography, pre-operative staging and nipple discharge were included. Diagnosis was confirmed by either ultrasound-guided core biopsy (n = 21) or surgical resection (n = 88). Breast MRI examinations were performed using a 3T MRI scanner (MAGNETOM Skyra, Siemens Healthineers, Erlangen, Germany). The DCE protocols included B1 mapping with TurboFLASH sequence, T1 mapping with the Dixon VIBE sequence, and multiple-phase dynamic scan with the research CDTV sequence (Table 1). The multiple-phase CDTV-DCE duration was 6 minutes 23 seconds (40 phases). After acquiring 3 phases of dynamic scans, we injected a rapid bolus of gadolinium contrast agent (Magnevist, Bayer Healthcare Pharmaceuticals Inc., NJ, USA) at a dose of 0.1 mmol per kilogram of body weight and a rate of 2 mL/s, followed by a 20-mL saline flush using an automatic injector (OptiStar® Elite, Liebel-Flarsheim). The T1 mapping and quantitative parametric maps based on P-AIF3 were generated inline after acquisition. These DCE-derived pharmacokinetic parameters, including Ktrans, kep, and ve, were calculated based on the two-compartment Tofts model4. The quantitative parametric maps with I-AIF were generated using a research application MR DCE software (Siemens Healthineers, Erlangen, Germany). The ROIs for AIF were positioned in the descending aorta. Quantitative maps obtained using the 2 methods, as well as the 1-minute postcontrast images, were imported into syngo.via software (Siemens Healthineers, Erlangen, Germany) for data analysis. Two-dimensional (2D) regions of interest (ROIs) were manually drawn in the slices with the largest extent of the lesion in the 1-minute postcontrast phase. The ROIs were subsequently propagated to the corresponding quantitative maps. The mean value of the parameters within the ROIs was automatically calculated and displayed. Statistical analyses employed Mann–Whitney U tests, binary logistic regression tests, Bland–Altman test, and receiver operating characteristic curves.Results
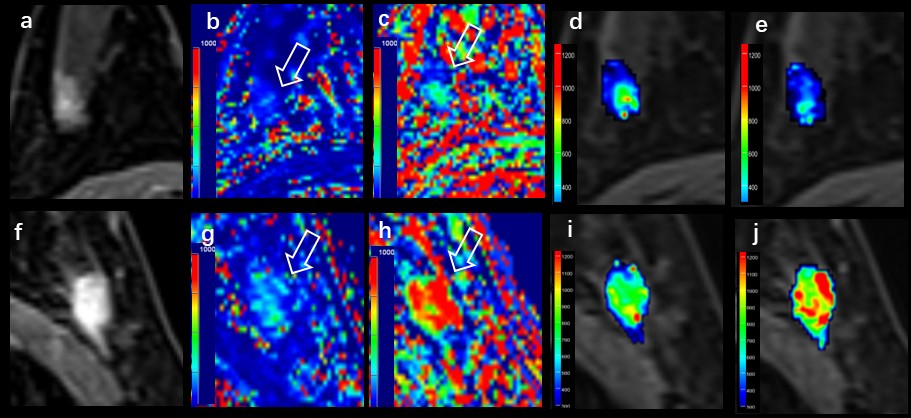
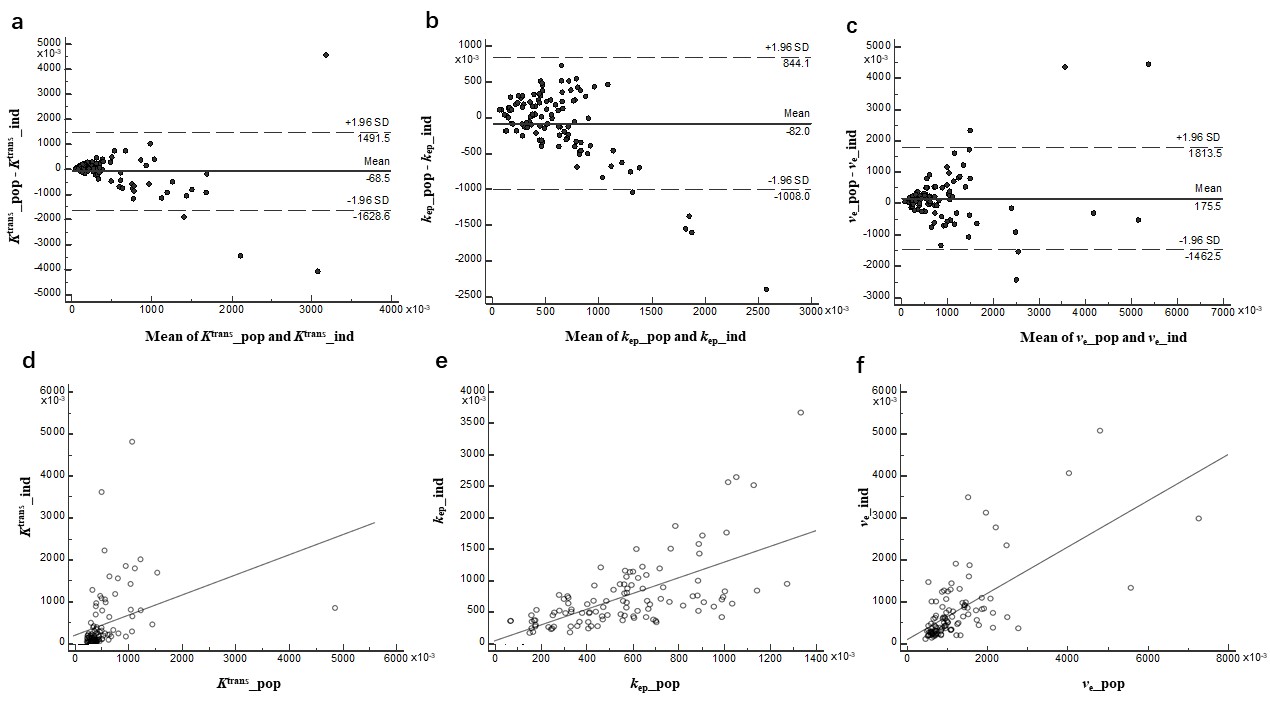
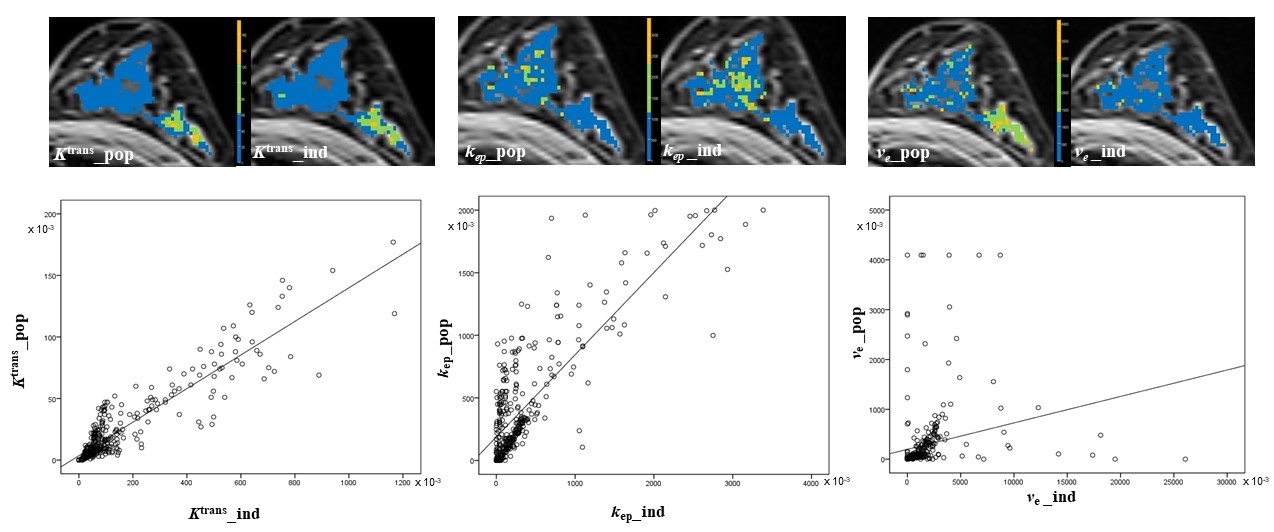
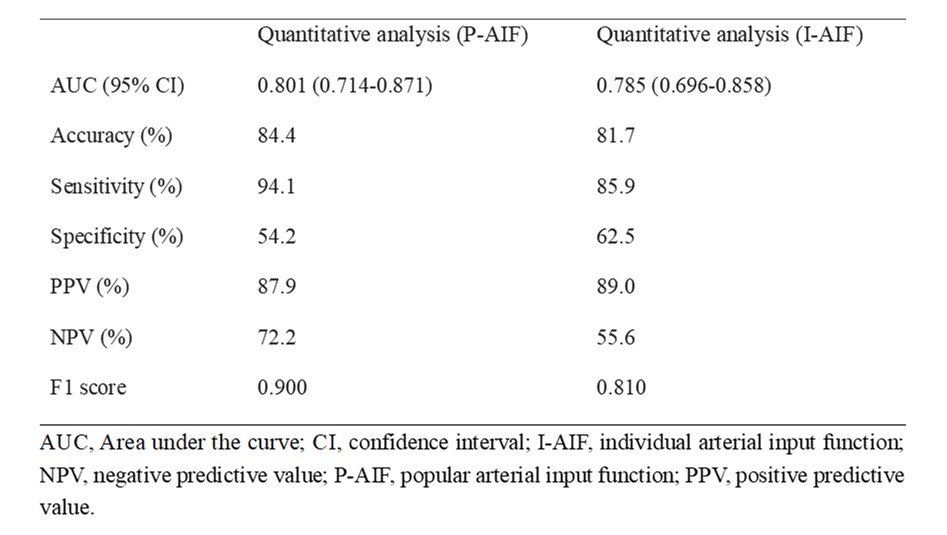
The kep from the inline quantitative analysis with P-AIF for diagnosing breast cancer provided an area under the curve similar to that generated offline with I-AIF (0.801 vs 0.785, P =.642) (Table 2). Furthermore, the kep with P-AIF achieved the larger F1 score (0.900) compared with kep with I-AIF (0.810). Representative parametric images of a malignant and a benign lesion are illustrated in Figure 1. No statistically significant biases were observed for Ktrans and kep values between the 2 quantitative analysis approaches (P =.373 and .072, respectively) (Fig. 2). Figure 3 displays parametric maps from 1 patient data set.Discussion
The ultrafast DCE-MRI provided 2 analysis methods, semi-quantitative and quantitative, each capable of assessing metrics indicative of tissue perfusion. Our results demonstrated no considerable variation in diagnosing breast lesions using P-AIF compared with I-AIF. We also demonstrated that Ktrans and kep values obtained using P-AIF and I-AIF were highly consistent. Thus, our results suggested that if I-AIF was not available or reliable, Ktrans and kep values achieved using P-AIF from the CDTV sequence might be sufficient in pharmacokinetic modeling.Conclusions
Our results indicated a similarity in the inline quantitative analysis with a population-average AIF and I-AIF for discriminating benign from malignant lesions. Hence, using inline quantitative parameters from CDTV to characterize breast lesions is of practical value.Summary of Main Findings
This study demonstrated a remarkable consistency in the Ktrans and kep values obtained using an individual AIF and a population-based AIF from CDTV-DCE-MRI.Acknowledgements
No.References
1. Sun K, Zhu H, Chai W et al (2020) Whole-lesion histogram and texture analyses of breast lesions on inline quantitative DCE mapping with CAIPIRINHA-Dixon-TWIST-VIBE. Eur Radiol 30:57-65
2. Xie T, Jiang T, Zhao Q et al (2023) Model-Free and Model-based Parameters Derived From CAIPIRINHA-Dixon-TWIST-VIBE DCE-MRI: Associations With Prognostic Factors and Molecular Subtypes of Invasive Ductal Breast Cancer. J Magn Reson Imaging 58:81-92
3. Fritz-Hansen T, Rostrup E, Larsson HB et al (1996) Measurement of the arterial concentration of Gd-DTPA using MRI: a step toward quantitative perfusion imaging. Magn Reson Med 36: 225-31.
4. Parker GJ, Roberts C, Macdonald A et al (2006) Experimentally-derived functional form for a population-averaged high-temporal-resolution arterial input function for dynamic contrast-enhanced MRI. Magn Reson Med 56:993-1000
Figures