5083
Robustness of Fitting Frequency-Domain Phased 129Xe Magnetic Resonance Spectra versus Unphased Temporal Domain Free Induction Decays1Medical Physics Graduate Program, Duke University, Durham, NC, United States, 2Department of Radiology, Duke University, Durham, NC, United States
Synopsis
Keywords: Hyperpolarized MR (Gas), Hyperpolarized MR (Gas)
Motivation: Hyperpolarized (HP) 129Xe magnetic resonance (MR) spectroscopy provides useful biomarkers of gas exchange. Some groups analyze phased spectra in the frequency domain, while others employ time-domain fitting. However, these two approaches have never been compared to determine the reliability of the metrics resulting from each approach.
Goal(s): This study compares the feasibility, sensitivity, and repeatability of these two methodologies.
Approach: 129Xe MRS acquired at 3 Tesla from 242 scans–include 55 repeated measurements of 110 scans–was evaluated using both methods.
Results: Time-domain fitting was applicable to all scans, yielded more physiologically plausible chemical shifts and were more repeatable.
Impact: Fitting 129Xe spectra acquired at 3 Tesla in the temporal domain outperforms phase correcting and fitting spectra in the frequency domain.
Introduction
Hyperpolarized (HP) 129Xe MR spectroscopy (MRS) provides useful biomarkers of pulmonary gas exchange, including the ratio of 129Xe signals in red blood cells to membrane tissues (RBC/M) as well as RBC chemical shift and RBC amplitude oscillations1,2. Historically, these values were derived from spectra that were Fourier transformed, phased and fit to two Lorentzian peaks3,4. However, given the broad and overlapping nature of the membrane and RBC resonances, more recent work has employed time-domain fitting and proposes a Voigt profile for the membrane resonance5. This study compares the feasibility, sensitivity, and repeatability of these two methodologies.Methods
HP 129Xe MRS from 242 scans (129 distinct subjects), including 55 repeated scan pairs, was evaluated using both the time-domain and Fourier transformation/phasing fitting approaches. The data set included a range of age, sex, and disease groups, but we focused additional analysis on 47 healthy subjects and 43 patients with idiopathic pulmonary fibrosis (IPF). Spectra (n=500) were acquired on a 3.0 T Siemens Prisma scanner using a quadrature 129Xe vest coil as per consortium recommendations6 with a 0.67 ms windowed sinc RF pulse, centered on the 218ppm RBC resonance with 20˚ flip, repetition time (TR) = 15 ms, echo time (TE) = 0.45 ms, dwell time = 19.5 μs, 512 points. The spectroscopy analysis used 1-sec of averaged data (67 FIDs) acquired 2 seconds into the breath-hold to ensure steady state magnetization.Time-domain fitting employed a Voigt profile for membrane signal and Lorentzian profiles for both the RBC and gas signals5. Spectral domain fitting began with first-order phase adjustments followed by zero-order adjustments. These spectra were fit in the chemical shift domain with a linear combination of two Lorentzians. However, only 65 scans could be reliably phase-corrected.
For these 65 scans, key biomarkers were evaluated, including the RBC/M, chemical shifts, and linewidths of both RBC and Mem signals. T-tests were then utilized to compare biomarker distributions and their physiological plausibility derived using both methods in the healthy vs. IPF cohorts.
For 65 scans amenable to both procedures, 36 were repeated measurements of 18 pairs of scans. The corresponding Bland Altman plots for each biomarker, using both methodologies, are illustrated, with CR, CV, and ICC metrics for each marker.
Results
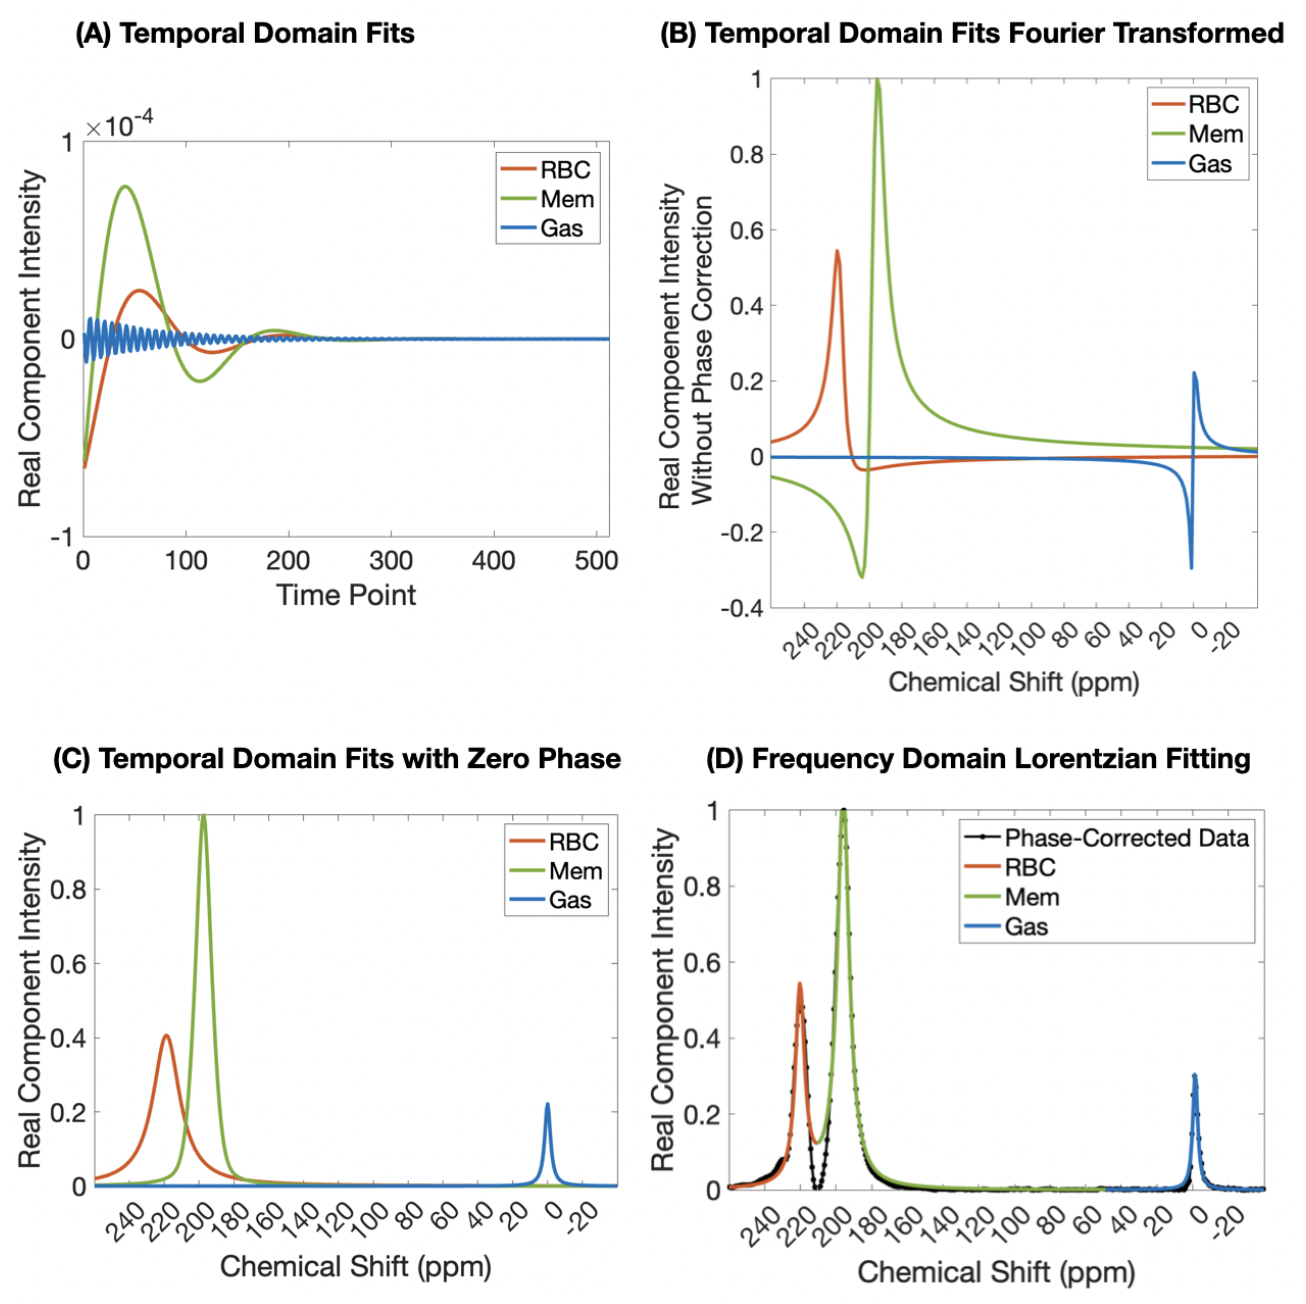
All 242 scans were amenable to time-domain fitting, but only 65 could be reliably phase-corrected. The structure of the 129Xe signal is depicted in Figure 1 showing (A) the time domain fitting and (B) the Fourier domain representation with the phase of each resonance as acquired. Figure 1C, shows those same components, but each as though with zero phase. The alternative approach of first Fourier transforming and then phase correcting and fitting to Lorentzian functions is shown in Figure 1D. Note the relatively poor fit between the resonances. Figure 2 shows the distributions of each derived biomarker using both methods for both the healthy and IPF cohorts. The phase-corrected spectra show greater dispersion for all derived markers in all cohorts. Notably, the RBC shift is higher in IPF patients than healthy volunteers when processed with this approach, which runs counter to their expected lower level of oxygenation. Figure 3 shows time-domain fitting (p-values < 0.05) differentiated the cohorts on all 5 markers, whereas phasing failed on membrane chemical shift. Figure 4 shows Bland-Altman plots of the repeatability for 5 of the key markers derived from 129Xe spectroscopy. For all 5 markers the coefficient of repeatability is higher for the phase-corrected spectral fitting method. This variability is particularly prominent for the membrane shift and FWHM. These values are quantitatively reported (Figure 5).Discussion
Temporal domain fitting is preferable over the frequency domain phase-corrected fitting approach as evidenced by its superior feasibility, enhanced repeatability, and improved ability to differentiate IPF patients and healthy cohorts. The difficulty in phase-correcting the spectra may stem from spectra having been acquired at 3T. Most literature using the frequency domain method has focused on 1.5T subjects scans or in vitro 3T scans3,4. Higher-field in vivo scans amplify the effects of inhomogeneities in the pulmonary region’s chemical environment and magnetic field on phase distortions. The lower phase correction success could also arise from the broad and overlapping nature of these resonances. Moreover, they undergo significant phase evolution during the RF pulse.The tighter data clusters of the temporal domain fitting method across cohorts (Figure 2) also suggest that this method may be more robust and reliable. Both methods yield relatively consistent sensitivity and repeatability of RBC/M, validating the fact that this is the robust and consistent biomarker that has been most frequently reported across institutions.
Acknowledgements
No acknowledgement found.References
1. Wang, Z., Bier, E. A., Swaminathan, A., Parikh, K., Nouls, J., He, M., Mammarappallil, J. G., Luo, S., Driehuys, B., & Rajagopal, S. (2019). Diverse cardiopulmonary diseases are associated with distinct xenon magnetic resonance imaging signatures. European Respiratory Journal, 54(6). https://doi.org/10.1183/13993003.00831-2019
2. Bier EA, Alenezi F, Lu J, Wang Z, Mammarappallil JG, O’Sullivan-Murphy B, Erkanli A, Driehuys B, Rajagopal S. Noninvasive diagnosis of pulmonary hypertension with hyperpolarized 129Xe magnetic resonance imaging and spectroscopy. European Respiratory Journal Open Research 2022
3. Kern, A. L., Biller, H., Klimeš, F., Voskrebenzev, A., Gutberlet, M., Renne, J., Müller, M., Holz, O., Wacker, F., Hohlfeld, J. M., & Vogel-Claussen, J. (2020). Noninvasive Monitoring of the Response of Human Lungs to Low-Dose Lipopolysaccharide Inhalation Challenge Using MRI: A Feasibility Study. Journal of Magnetic Resonance Imaging, 51(6). https://doi.org/10.1002/jmri.27000
4. Norquay, G., Leung, G., Stewart, N. J., Wolber, J., & Wild, J. M. (2017). 129Xe chemical shift in human blood and pulmonary blood oxygenation measurement in humans using hyperpolarized 129Xe NMR. Magnetic Resonance in Medicine, 77(4). https://doi.org/10.1002/mrm.26225
5. Bier, E. A., Robertson, S. H., Schrank, G. M., Rackley, C., Mammarappallil, J. G., Rajagopal, S., McAdams, H. P., & Driehuys, B. (2019). A protocol for quantifying cardiogenic oscillations in dynamic 129 Xe gas exchange spectroscopy: The effects of idiopathic pulmonary fibrosis. NMR in Biomedicine, 32(1). https://doi.org/10.1002/nbm.4029
6. Niedbalski, P. J., Hall, C. S., Castro, M., Eddy, R. L., Rayment, J. H., Svenningsen, S., Parraga, G., Zanette, B., Santyr, G. E., Thomen, R. P., Stewart, N. J., Collier, G. J., Chan, H. F., Wild, J. M., Fain, S. B., Miller, G. W., Mata, J. F., Mugler, J. P., Driehuys, B., … Woods, J. C. (2021). Protocols for multi-site trials using hyperpolarized 129Xe MRI for imaging of ventilation, alveolar-airspace size, and gas exchange: A position paper from the 129Xe MRI clinical trials consortium. Magnetic Resonance in Medicine, 86(6). https://doi.org/10.1002/mrm.28985
Figures
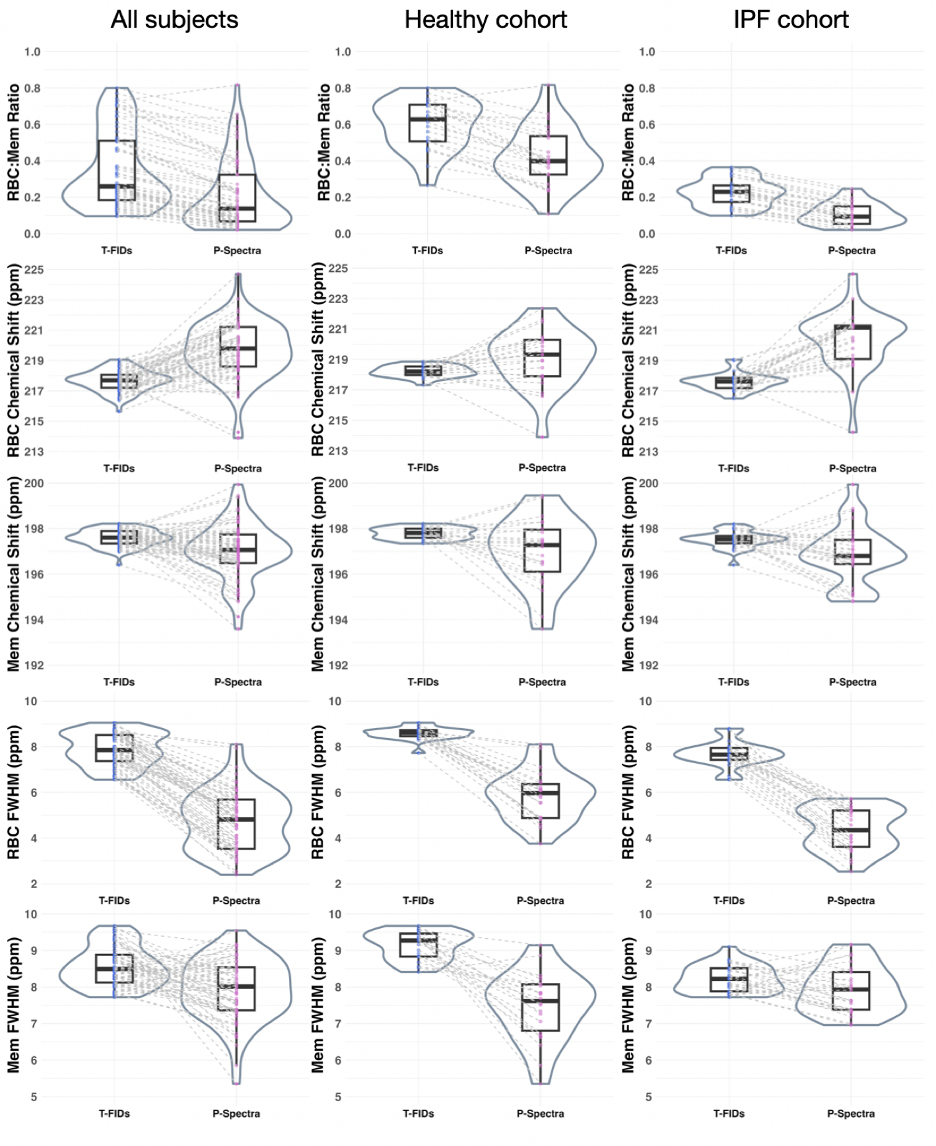
Comparison between the temporal (T-FID) vs phase-corrected frequency domain (P-Spectra) fitting approaches for each of the dissolved-phase markers across all cohorts as well as comparisons in healthy subjects and those with IPF. The P-Spectra show greater dispersion for all derived markers in all cohorts. Notably, the RBC shift is higher in IPF patients processed with P-Spectra which runs counter to their expected lower level of oxygenation.
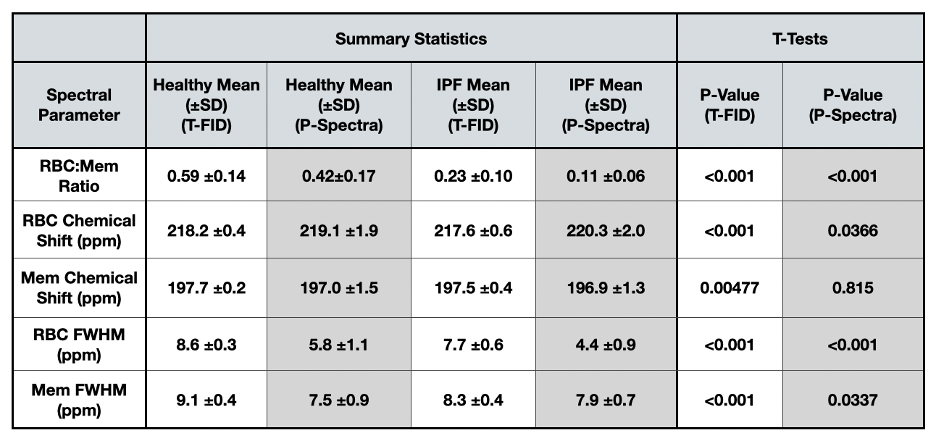
Comparison of key metrics derived using temporal-domain (T-FID) vs phase-corrected frequency domain (P-Spectra) fitting for both healthy and IPF cohorts. Time-domain fitting differentiated the cohorts on all 5 markers, whereas phasing failed on membrane chemical shift.
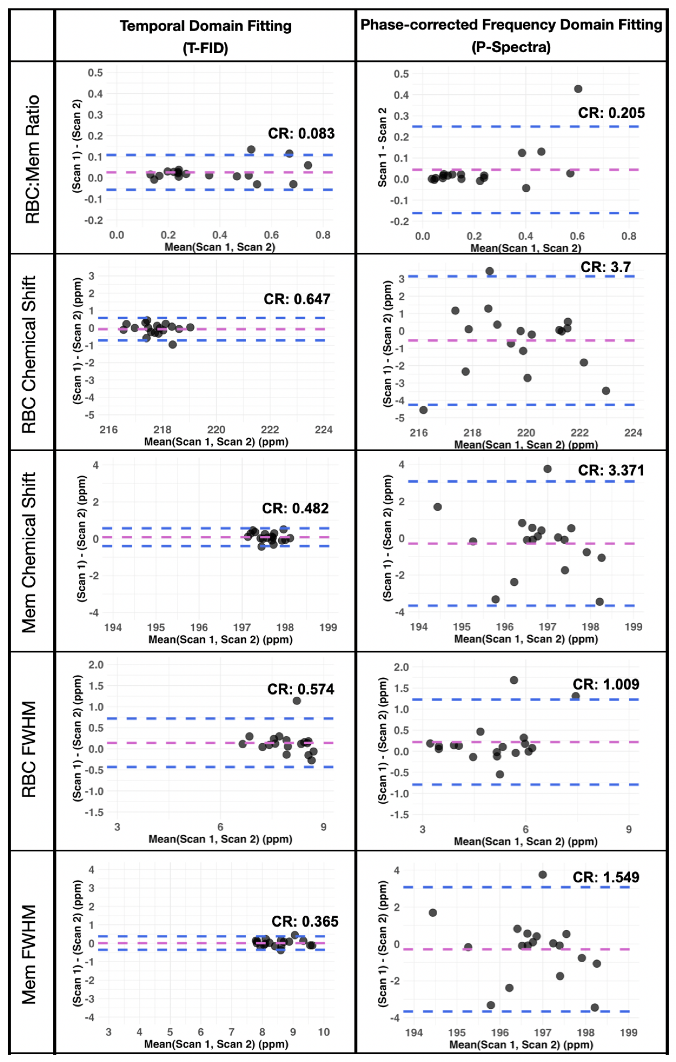
Bland-Altman plots showing the repeatability of spectral features derived using both the T-FID and P-Spectra methods. Data points correspond to the difference between 18 pairs of repeated scans and are plotted as a function of the mean of repeated scans. For each of the 5 spectral markers the coefficient of repeatability is higher for the phase-corrected spectral fitting method (P-spectra).
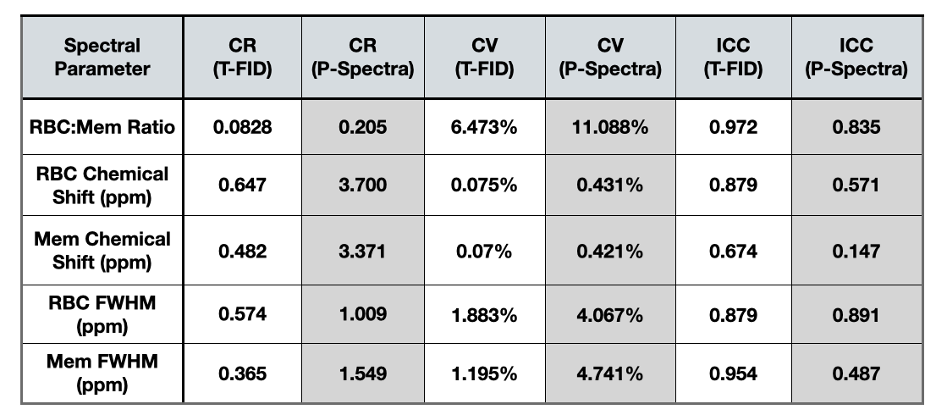
Coefficient of Repeatability (CR), Coefficient of Variation (CV), and Intraclass Correlation Coefficient (ICC) Metrics for Biomarkers Derived from Two Methods. Temporal domain fitting (T-FID) method consistently yielded lower CR, CV values and stronger ICC, suggesting its higher repeatability compared to phase-corrected frequency domain fitting spectra (P-Spectra).