5081
31P MRSI in Pediatric Low Grade Gliomas During Treatment at 7T1Department of Neurosurgery, Medical University of Vienna, Vienna, Austria, 2Department of Biomedical Imaging and Image-guided Therapy, Medical University of Vienna, Vienna, Austria, 3Department of Radiology, University Medical Center Utrecht, Utrecht, Netherlands, 4Princess Máxima Center for Pediatric Oncology, Utrecht, Netherlands, 5Department of Ophthalmology, University Medical Center Utrecht, Utrecht, Netherlands
Synopsis
Keywords: Non-Proton, Pediatric, Brain tumor, 7T, Neuro, 31P
Motivation: Treatment monitoring in pediatric brain tumors is often challenging. Non-invasive tools are needed to assess tumor activity accurately.
Goal(s): To monitor changes in phospholipid metabolism (i.e., phosphomonoesters/phosphodiesters [PME/PDE]) in pediatric low grade gliomas.
Approach: Eleven pediatric brain tumor patients underwent 31P-MRSI at 7T. PME/PDE in the tumor was compared to a normal-appearing brain voxel. Clinical outcomes were assessed, and results were compared between treatment and wait-and-scan groups.
Results: Tumors selected for treatment showed higher PME/PDE ratios at baseline, hinting at potential aggressiveness. These ratios decreased during treatment but remained stable in the wait-and-scan group.
Impact: Treatment monitoring in pediatric brain tumors is often challenging. Using 31P-MRSI we showed that tumors selected for treatment exhibited higher PME/PDE, signifying potential tumor aggressiveness. PME/PDE levels decreased during treatment, indicating potential for non-invasive assessment of treatment effects.
Introduction
Pediatric low-grade gliomas, the most common CNS tumors in children1, often require adjuvant chemotherapy or radiation due to incomplete surgical removal. MR imaging may not reliably reflect tumor behavior, posing challenges in monitoring treatment effects (e.g., pseudoprogression). The absence of non-invasive tools for assessing tumor activity can result in ambiguous radiological interpretations.Phosphorus magnetic resonance spectroscopic imaging (31P-MRSI) is a powerful technique for studying tissue metabolism, particularly of phospholipid metabolism-related compounds. Metabolites such as phosphocholine (PC), glycerophosphocholine (GPC), phosphoethanolamine (PE) and glycerophosphoethanolamine (GPE) are linked to cell proliferation; PE and PC are building blocks of the cell membrane, whereas GPE and GPC are their catabolites. We hypothesize that by imaging these metabolites, we can assess early effects of treatment in pediatric gliomas.
Methods
After gaining approval by the IRB and informed consent from all patients and/or their parents, 11 pediatric patients with low-grade gliomas underwent an initial MRI examination (“baseline”, BL) at 7 Tesla (Achieva, Philips Healthcare, The Netherlands), followed by 1-2 follow-up examinations (FU1, FU2) in intervals of 3-7 months.For each session, a 31P-MRSI datasets was acquired using a home-built quadrature TxRx 1H/31P head coil and a 3D pulse-acquire CSI sequence (flip angle=11.4°, TR/TE=100/0.42 ms, matrix size=11×11×9, nominal voxel size=2×2×2 cm, NSA=28, hamming filtered k-space, TA=7:16 min). Afterwards, FLAIR and T1w anatomical images were obtained with a 8Tx/32Rx head coil (Nova Medical, Wilmington, USA).
Based on FLAIR imaging, the tumor was manually segmented and registered onto the 31P-MRSI coordinate system using linear registration in Elastix (figure 1)2. For each data set, the relative tumor content in the nominal MRSI voxels was calculated; the voxel with the highest tumor content (“TU”) and a control (“CTRL”) were selected for analysis.
31P-MRSI data was reconstructed using an in-house developed MATLAB software, including PCA-based denoising. Phosphomonoesters (PC, PE), and phosphodiesters (GPE, GPC), as well as the main metabolites involved in the energy metabolism, were quantified using a MATLAB implementation of AMARES3. The phosphomonoester/phosphodiester ratio (PME/PDE) was calculated as (PE+PC)/(GPE+GPC) for all scans. We then calculated the ratio of the PME/PDE between TU and CTRL voxels (PME/PDEratio).
The PME/PDEratio was compared to the clinical outcomes, categorized as ‘progressive’, ‘stable’ or ‘responsive’ according to the neuro-oncological (i.e., consensus in multi-disciplinary board), radiological (i.e., RAPNO)4 and ophthalmological (i.e., vision, visual field, OCT) reports. If either one determined a tumor as ‘progressive’, the patient was considered to be in progression.
Results
Overall, compliance was good, with all patients completing their MR examinations. Clinically, patients 2, 6 and 8 were classified as progressive; the others were deemed stable (table 1).Regarding the MRSI, all but one spectrum was of sufficient spectral quality (example dataset in figure 2). For patient 3 BL, a tumor voxel was reselected.
When comparing wait-and-scan and treatment cohorts, we can see that their PME/PDEratio differ substantially, with the treatment group having a much higher PME/PDEratio at BL (figure 3). This difference disappeared by FU1.
Lastly, figure 4 displays a comparison of the PME/PDEratio for all three scan sessions, normalized to BL. In patients undergoing treatment, the PME/PDEratio tends to decrease in FU scans. Patient 2’s response was determined to be pseudoprogression, matching our results. In the wait-and-scan group, patients 1 and 4 were stable, with the FU PME/PDEratio being close to BL. While patient 10 was classified as stable according to RAPNO (growth<25%), the radiologist described some growth. In accordance, PME/PDEratio increased in this patient. Patients 6 and 8 showed ophthalmological progression. This is not reflected in increasing PME/PDEratio.
Discussion and Conclusion
The heterogeneity of the cohort, with tumors differing in classification, size, and location, combined with the limited cohort size, allowed only a qualitative analysis. The investigated tumors tended to be small, which, together with the relatively large nominal voxel size of the 31P-MRSI, resulted in many voxels with low tumor content. Future work should remedy this by regridding the MRSI and applying a partial volume correction.Overall, we found a higher PME/PDEratio at baseline in tumors of patients that were selected for treatment than for tumors of patients in the wait and scan follow-up. This is in line with previous research on adult brain tumors5,6, suggesting that a higher PME/PDEratio (i.e. >1) may indicate more aggressive tumors. The PME/PDEratio levels decreased during treatment, whereas they remained rather stable in the wait and scan follow-up.
Acknowledgements
We gratefully acknowledge the support from the Wilhelmina Kinderziekenhuisfonds 2018, the Austrian Science Fund grant KLI 1089, as well as the EU COST Action “Glioma MR Imaging 2.0”, grant CA18206.References
[1] P. de Blank, P. Bandopadhayay, D. Haas-Kogan, M. Fouladi, J. Fangusaro (2019) Management of pediatric low-grade glioma, Current Opinion in Pediatrics. DOI: 10.1097/MOP.0000000000000717.
[2] S. Klein, M. Staring, K. Murphy, M.A. Viergever, J.P.W. Pluim (2010) elastix: A Toolbox for Intensity-Based Medical Image Registration, IEEE Transactions on Medical Imaging. DOI: 10.1109/TMI.2009.2035616.
[3] L. Vanhamme, A. van den Boogaart, S. Van Huffel (1997) Improved Method for Accurate and Efficient Quantification of MRS Data with Use of Prior Knowledge, Journal of Magnetic Resonance. DOI: 10.1006/jmre.1997.1244.
[4] J. Fangusaro, O. Witt, P. Hernáiz Driever, et al. (2020) Response assessment in paediatric low-grade glioma: recommendations from the Response Assessment in Pediatric Neuro-Oncology (RAPNO) working group, Lancet Oncol. DOI: 10.1016/S1470-2045(20)30064-4.
[5] J.P. Wijnen, T.W.J. Scheenen, D.W.J. Klomp, A. Heerschap (2010) 31P magnetic resonance spectroscopic imaging with polarisation transfer of phosphomono- and diesters at 3 T in the human brain: relation with age and spatial differences, NMR Biomed. DOI: 10.1002/nbm.1523.
[6] A. Korzowski, N. Weckesser, V.L. Franke, et al. (2021) Mapping an Extended Metabolic Profile of Gliomas Using High-Resolution 31P MRSI at 7T, Front Neurol. DOI: 10.3389/fneur.2021.735071.
Figures
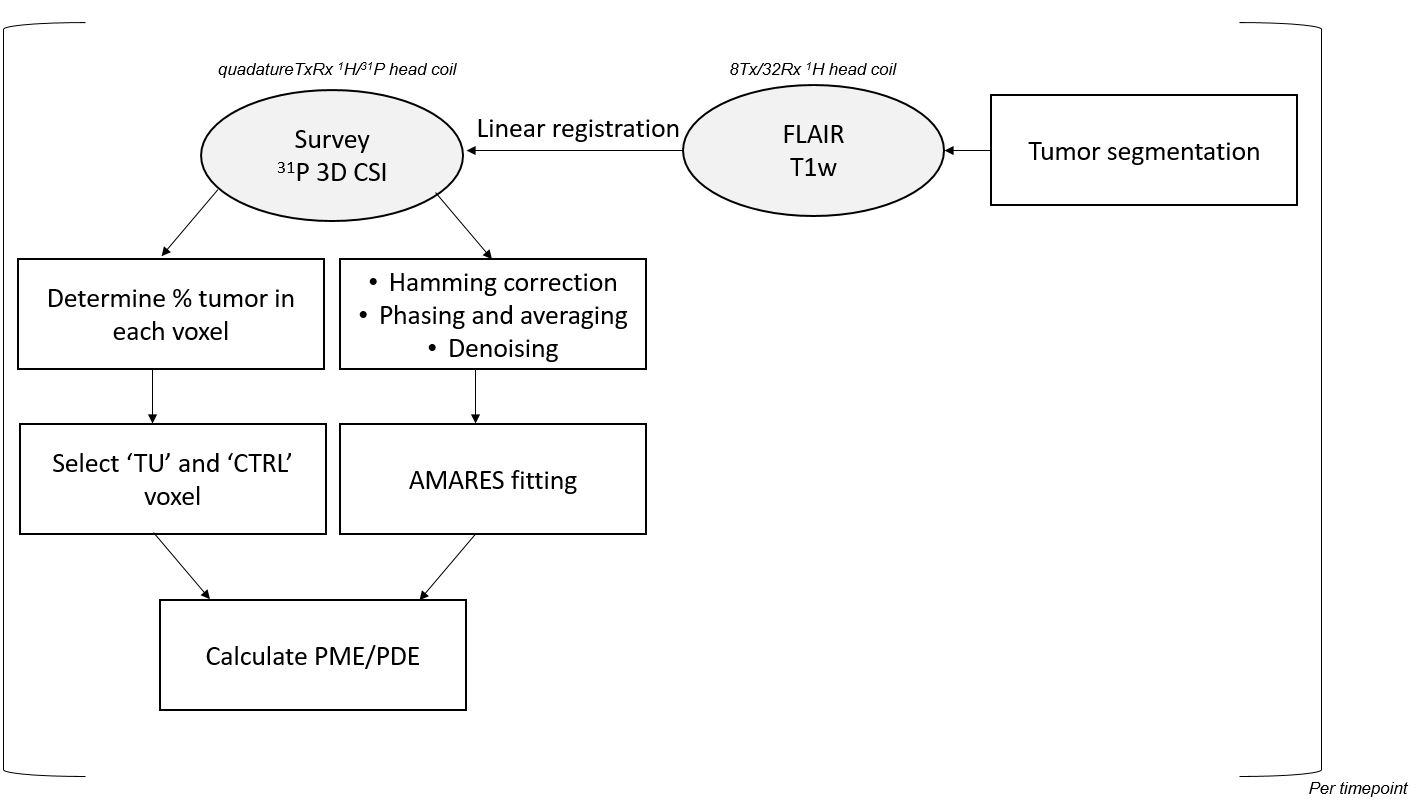
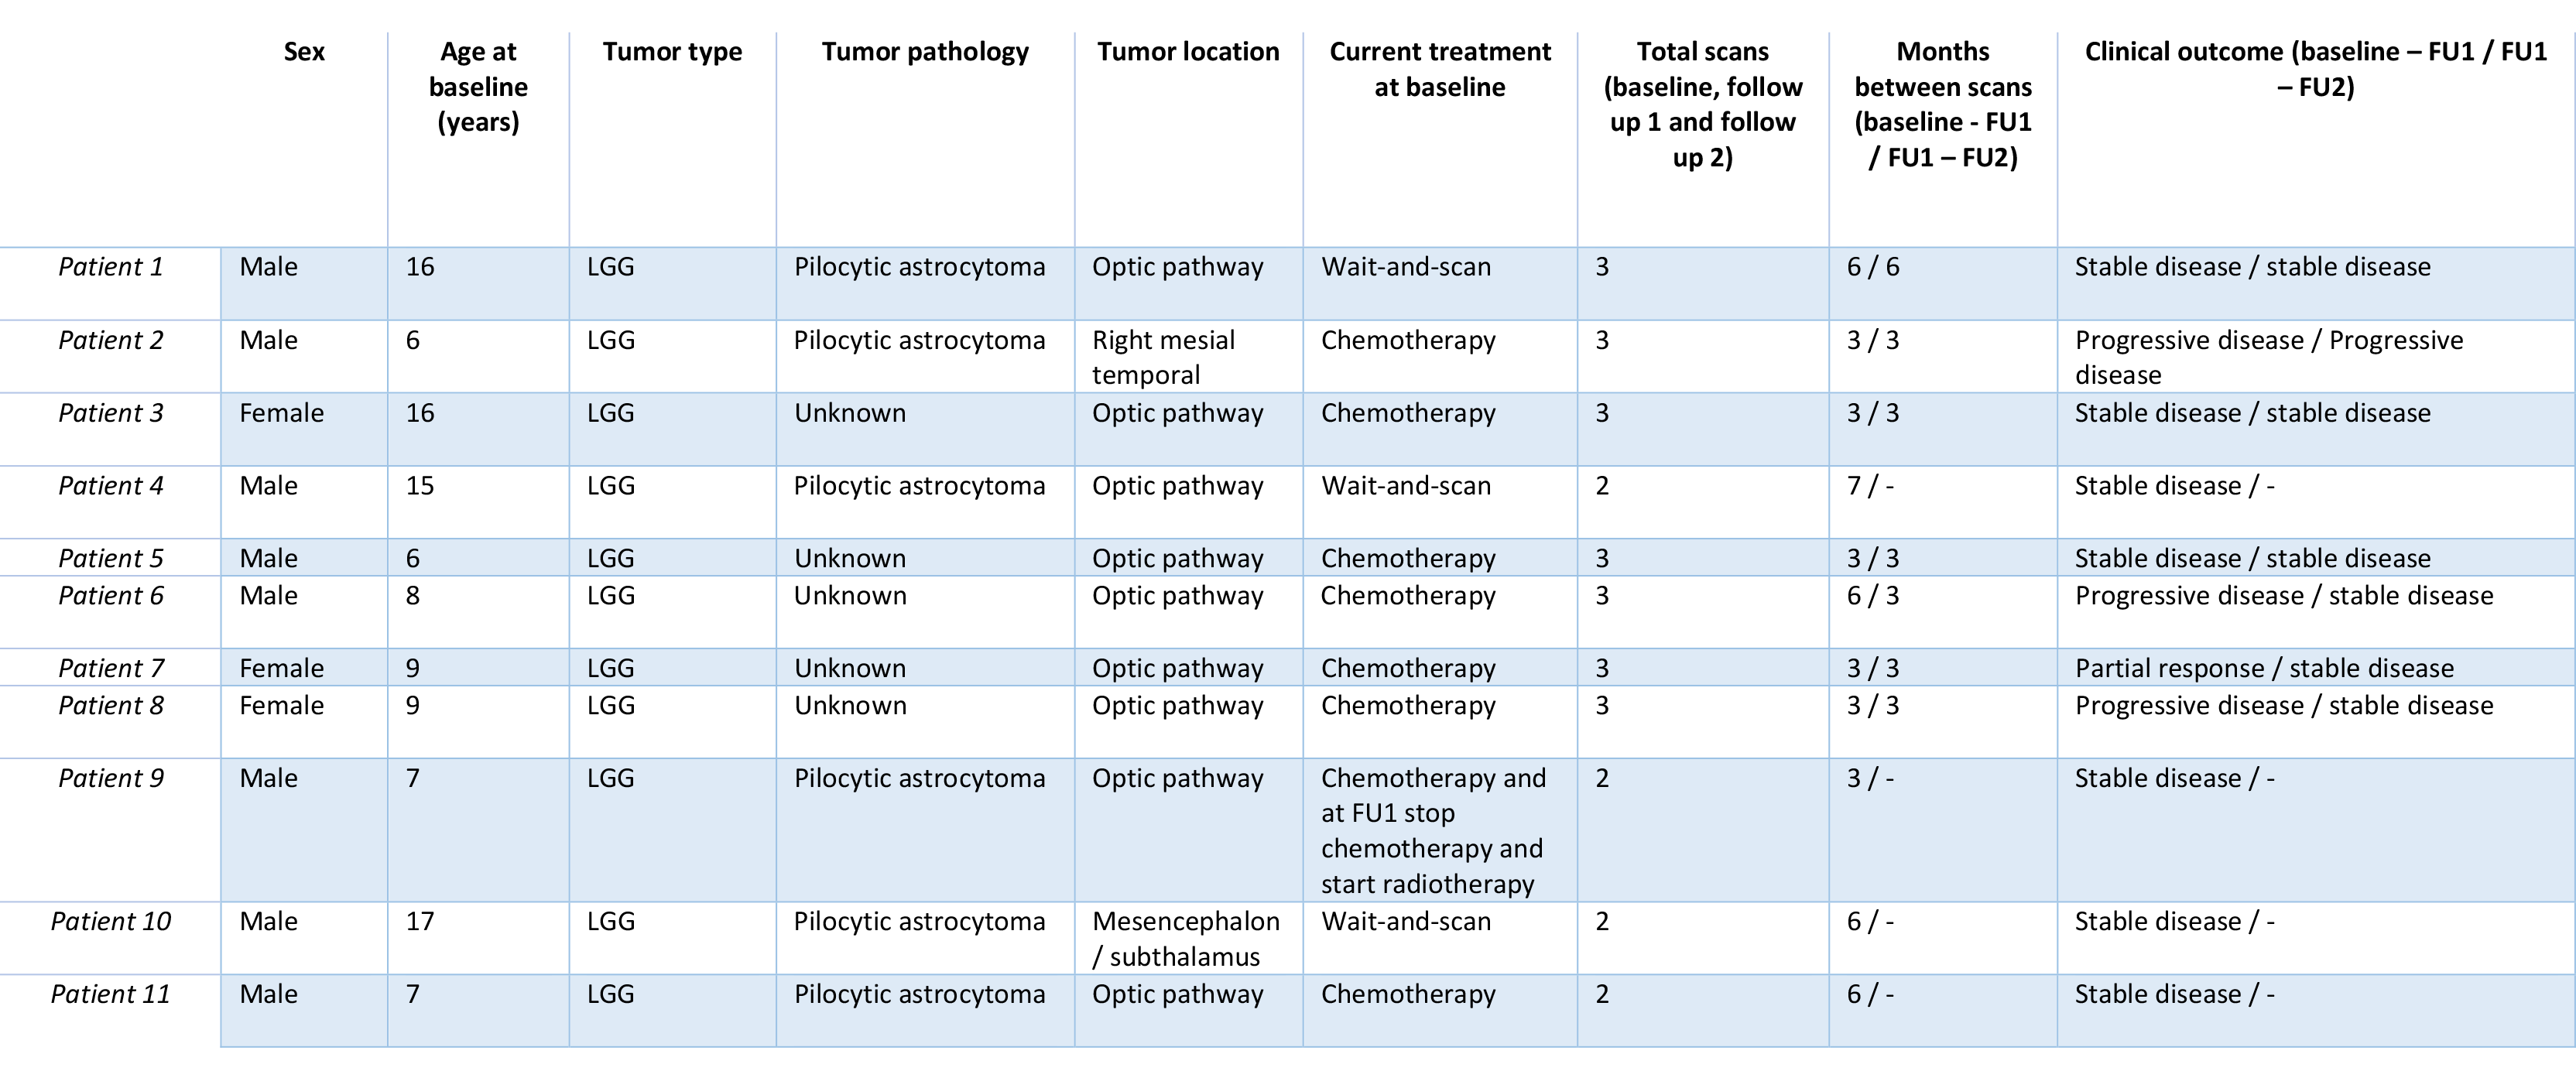
Table 1: An overview of the patient cohort, with sex, age, tumor pathology and location, treatment, the number of conducted scans, the time between scans and the clinical outcomes.
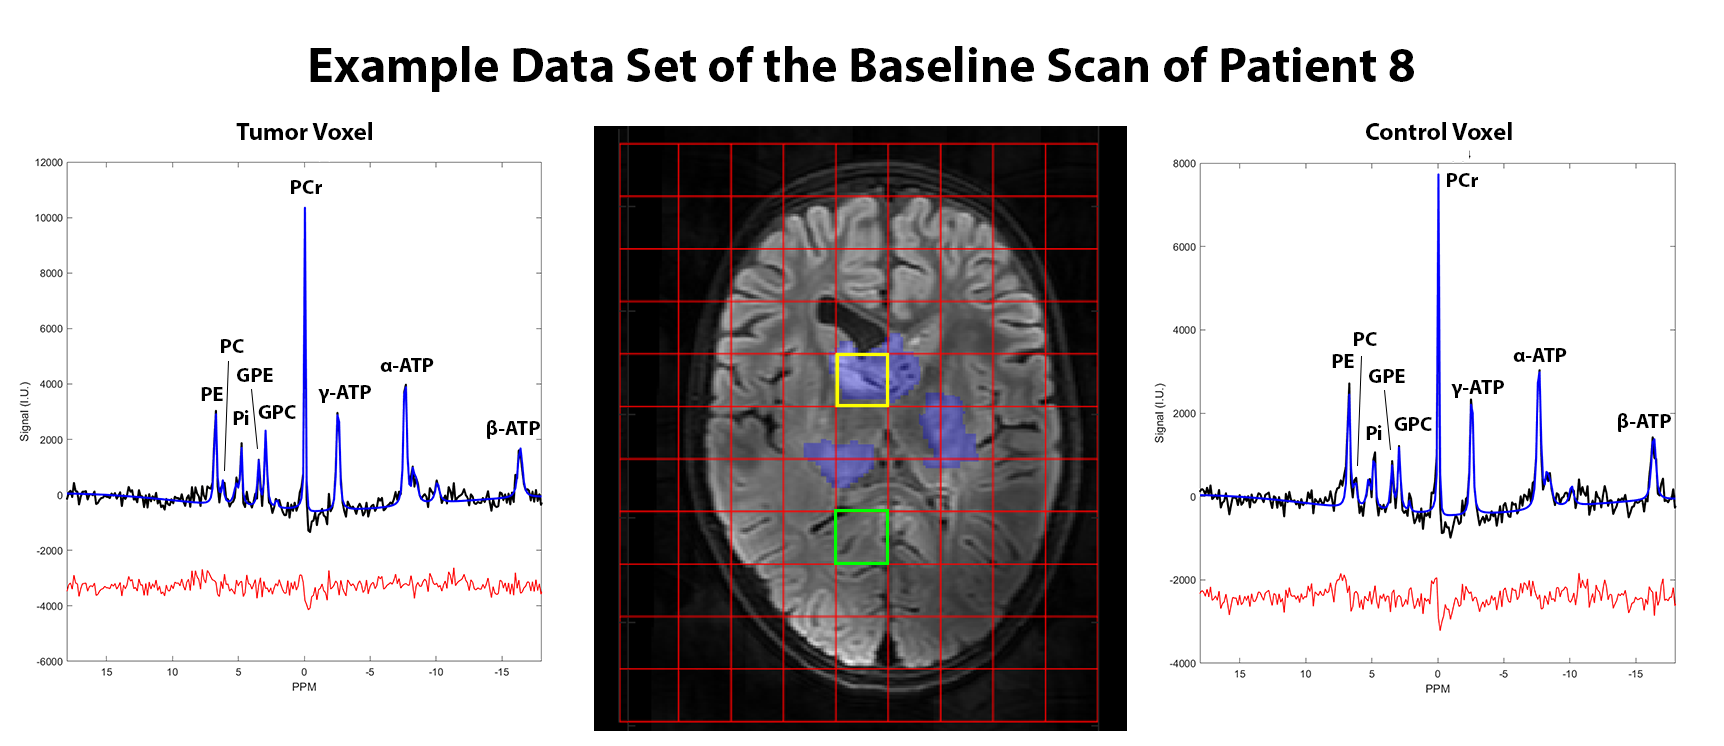
Figure 2: Example data set of the baseline scan of patient 8 with the tumor voxel (yellow, left spectrum) and the control voxel (green, right spectrum), as well as the tumor segmentation (blue overlay). A 7T FLAIR was chosen as anatomical reference. In the spectra, the acquired signal in institutional units is shown in black, the AMARES fit is shown in blue and the residual is shown in red. The nominal 31P tumor voxel had a tumor content of 82% based on the segmentation.
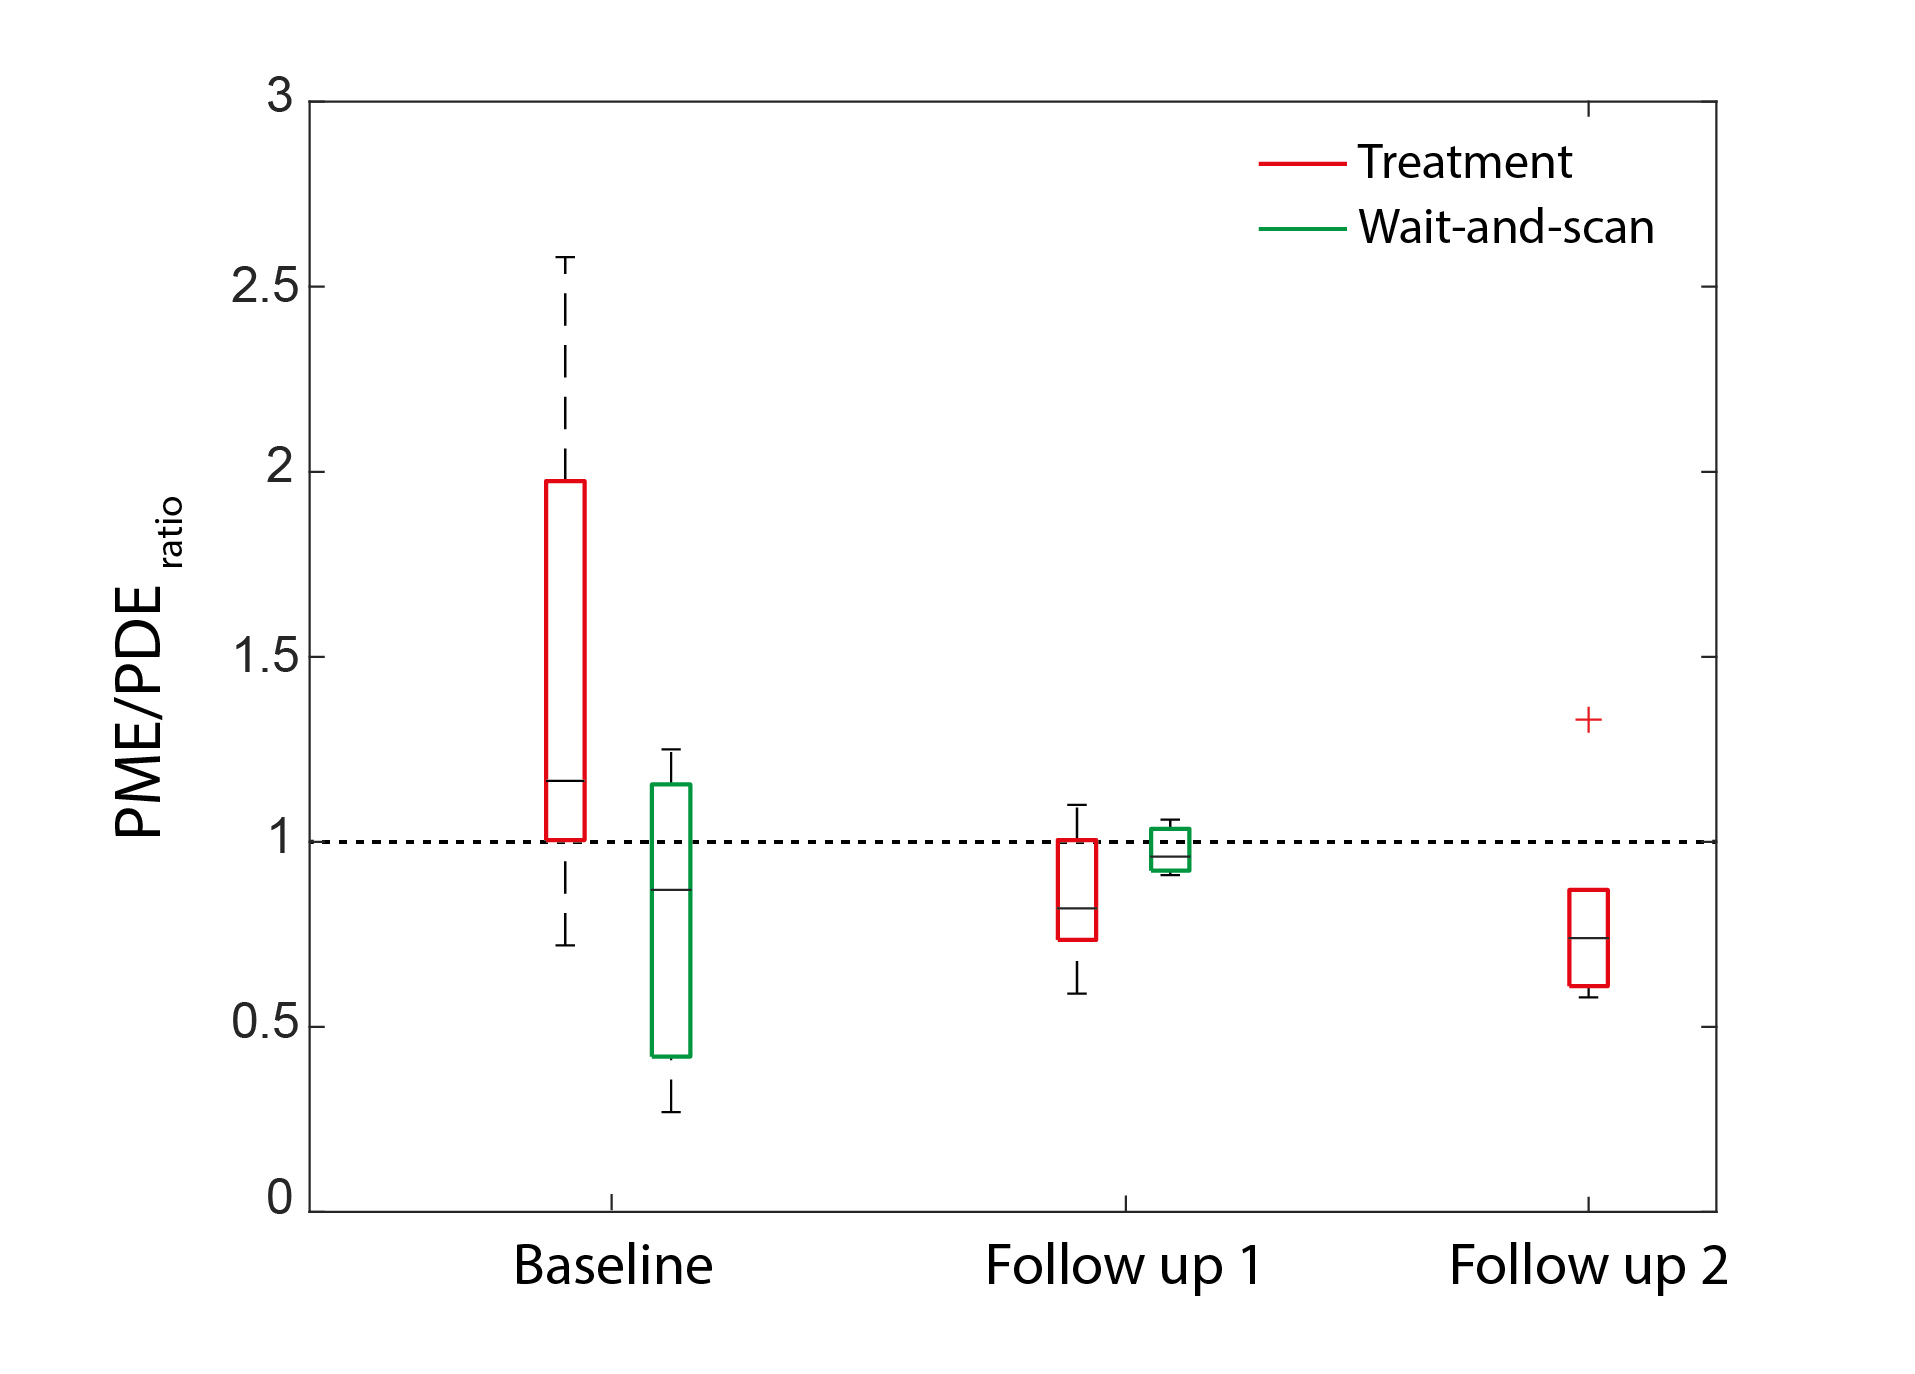
Figure 3: PME/PDE between tumor and control (PME/PDEratio) at three time points for the wait-and-scan as well as the treatment group. Notably, there have not been any FU2 sessions for the wait-and-scan cohort.
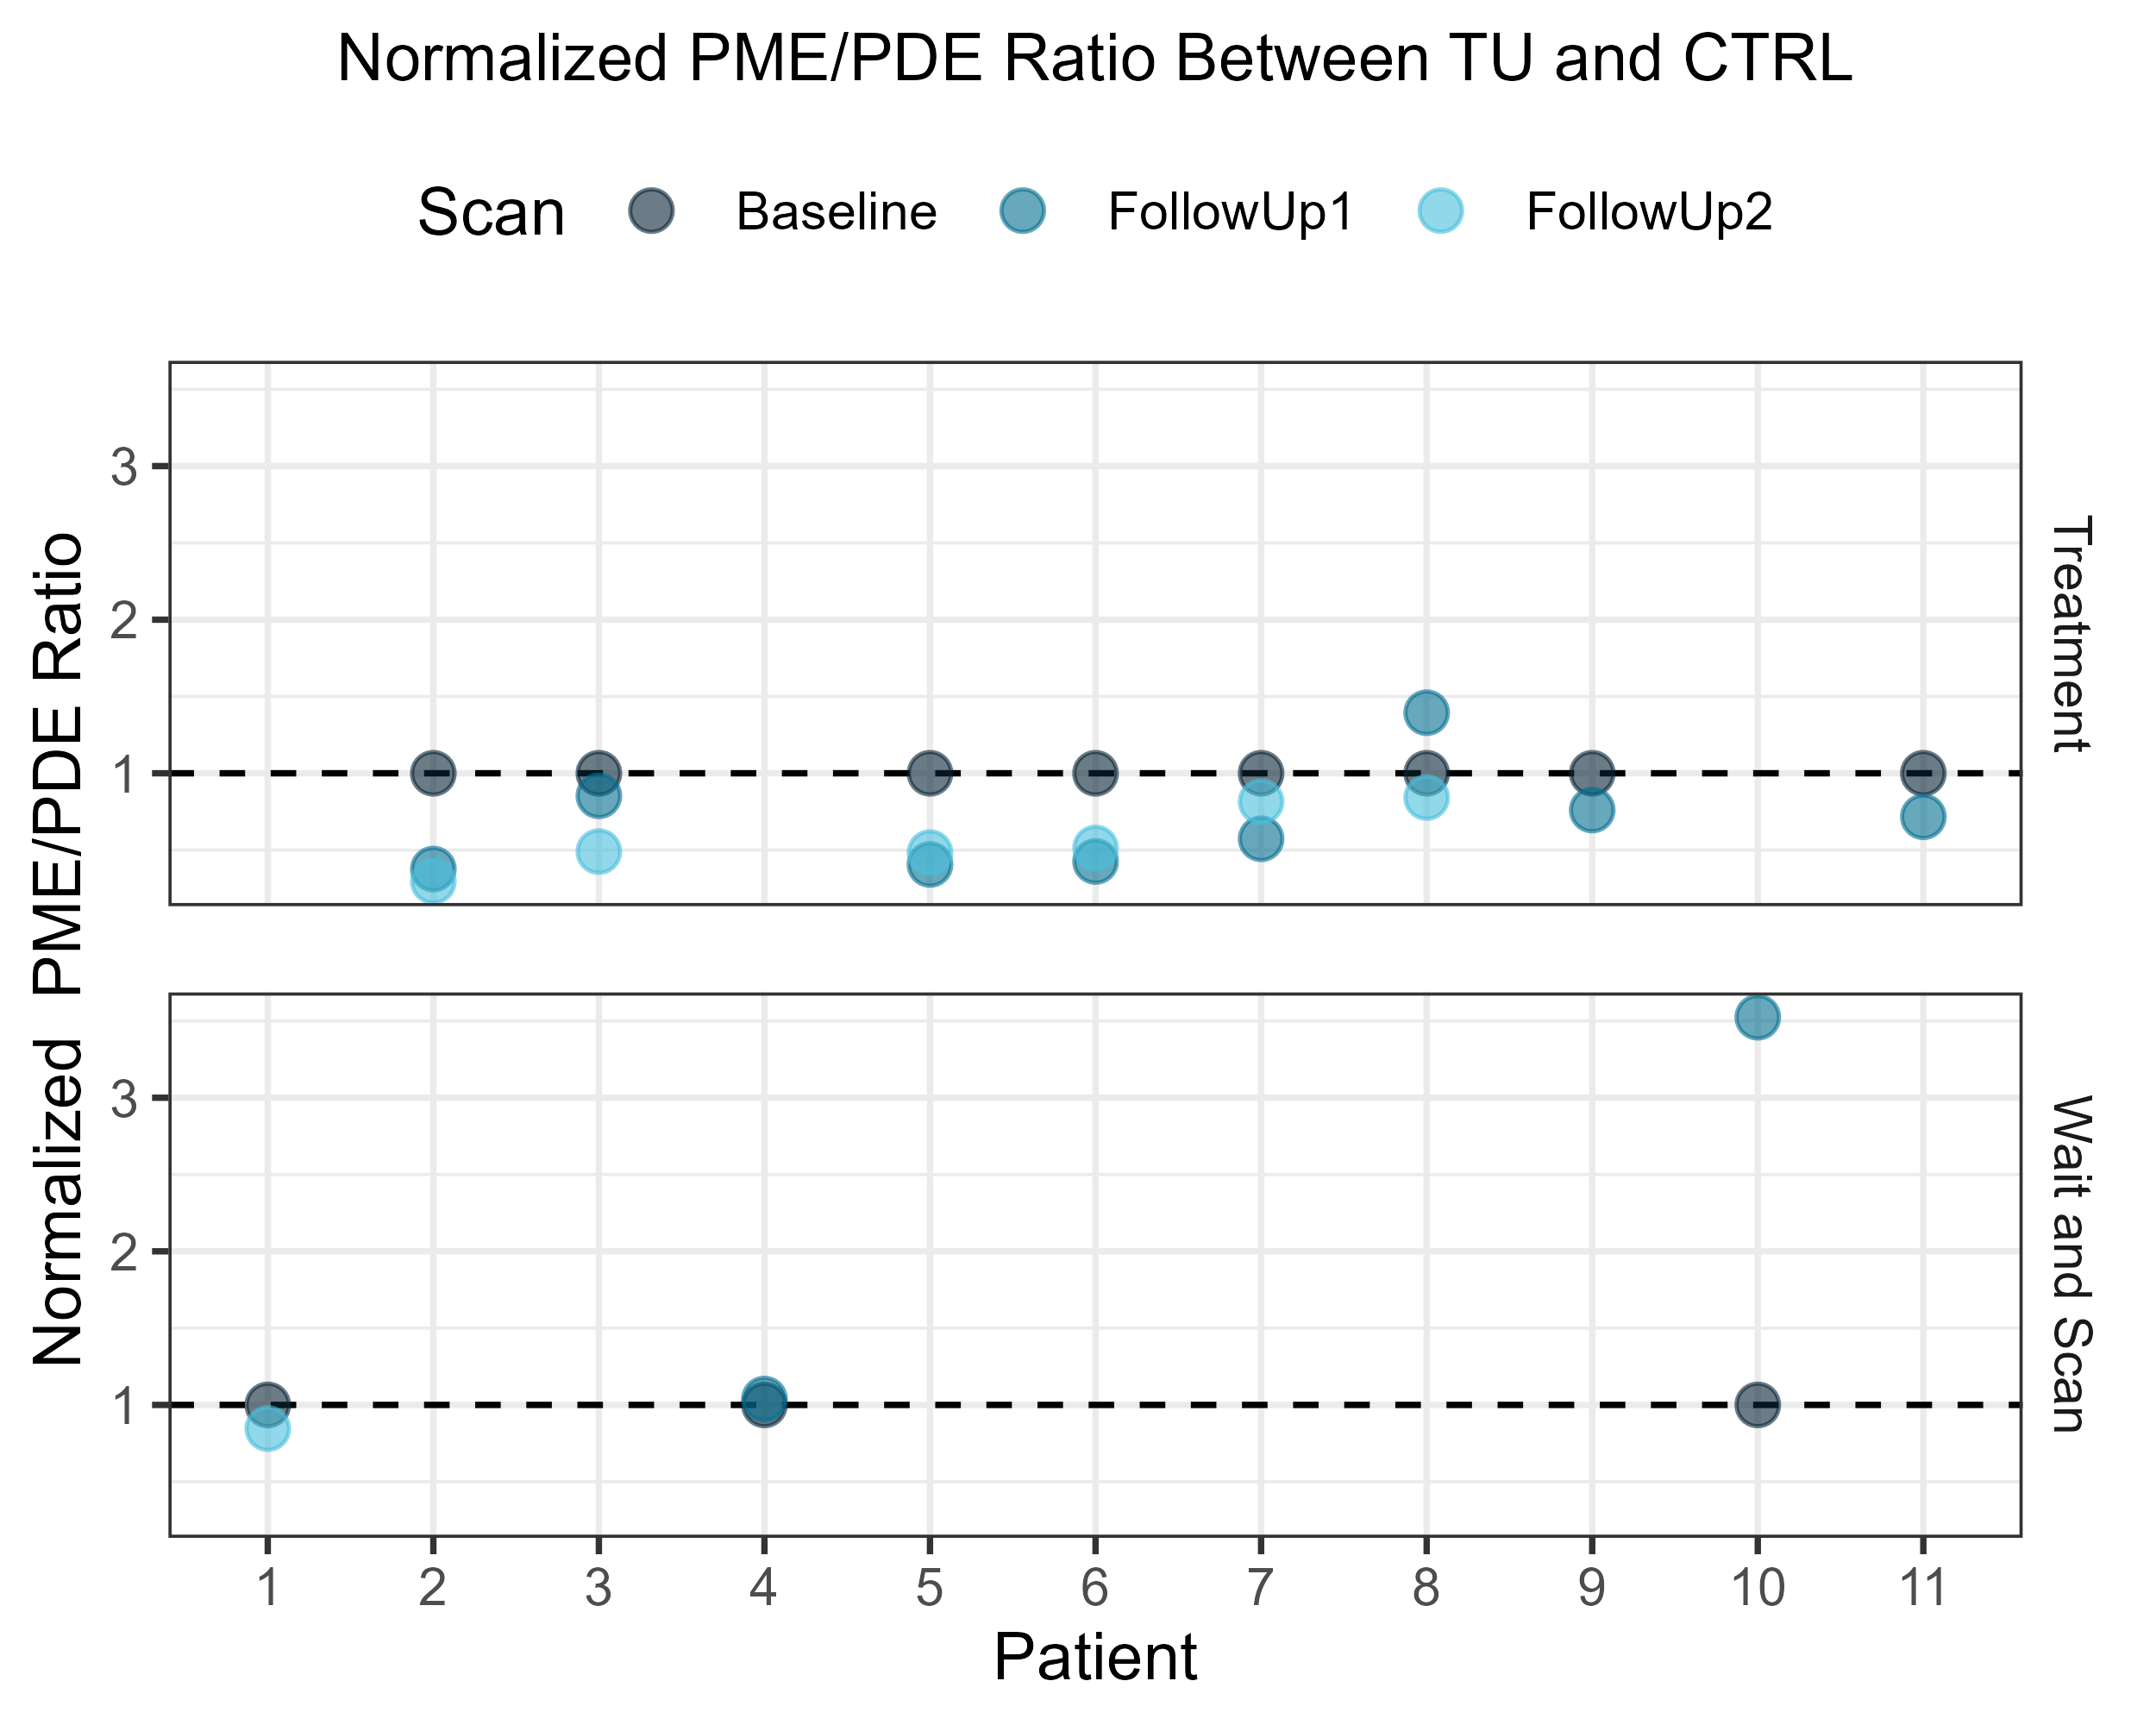
Figure 4: The PME/PDEratio between tumor and control voxel in all patients, normalized to the BL scan. Patients undergoing treatment are shown at the top, and patients in the wait-and-scan cohort are shown at the bottom. One can see a clear trend of the PME/PDEratio to decrease relative to baseline in the treatment group. For the wait-and-scan group, the PME/PDEratio ratio remained close to baseline in two patients and increased in the third patient.