5079
Physiological Interpretation of the AUC Ratio for Hyperpolarized [1-13C]-Pyruvate1Imaging Physics, University of Texas MD Anderson Cancer Center, Houston, TX, United States, 2Department of Physics, University of Houston, Houston, TX, United States, 3UTHealth Graduate School of Biomedical Sciences, University of Texas MD Anderson Cancer Center, Houston, TX, United States
Synopsis
Keywords: Hyperpolarized MR (Non-Gas), Modelling
Motivation: The prevalence of the use of AUC ratio as a metric of anaerobic respiration in hyperpolarized pyruvate studies motivates a careful examination of its physiological interpretation.
Goal(s): We seek to characterize the lactate to pyruvate AUC ratio as a surrogate for aerobic glycolysis in cancer cells.
Approach: A simplified three-compartment kinetic model is proposed and analyzed. The AUC ratio is found from the model for interpretation.
Results: The simplified three-compartment model is shown to produce equivalent time curves to the full model. The AUC ratio, parametrized by the simplified model, varies non-linearly with the rate of intracellular lactate production.
Impact: The efficacy of hyperpolarized pyruvate as a probe of tumor metabolism relies on an accurate and reproducible quantification and interpretation of acquired signal. We critically examine one of the most commonly used methods of signal interpretation in hyperpolarized pyruvate studies.
Introduction
Hyperpolarized (HP) pyruvate is commonly used to probe aerobic glycolysis and has shown promise as an early quantifier of tumor response to treatment1. Due to the complexity of the target biology, pharmacokinetic (PK) modeling is essential to understand the source of signals, as nuisance parameters may confound the measurement of intracellular metabolism2. Most common PK models consider only one or two physical compartments, but currently no model is universally accepted3-5.Model-free metrics such as the area under the curve (AUC) ratio and lactate time-to-peak (TTP) are frequently used in place of a PK model for their simplicity and easy standardization4. The AUC ratio in particular is broadly used as a surrogate for $$$ k_{pl} $$$, the apparent rate of lactate production from HP pyruvate6-7.
The ubiquity of the AUC ratio motivates an understanding of its physiological interpretation. In this work, we found that a three-compartment PK model predicts a non-linear relationship between the AUC ratio and $$$ k_{pl} $$$.
Methods
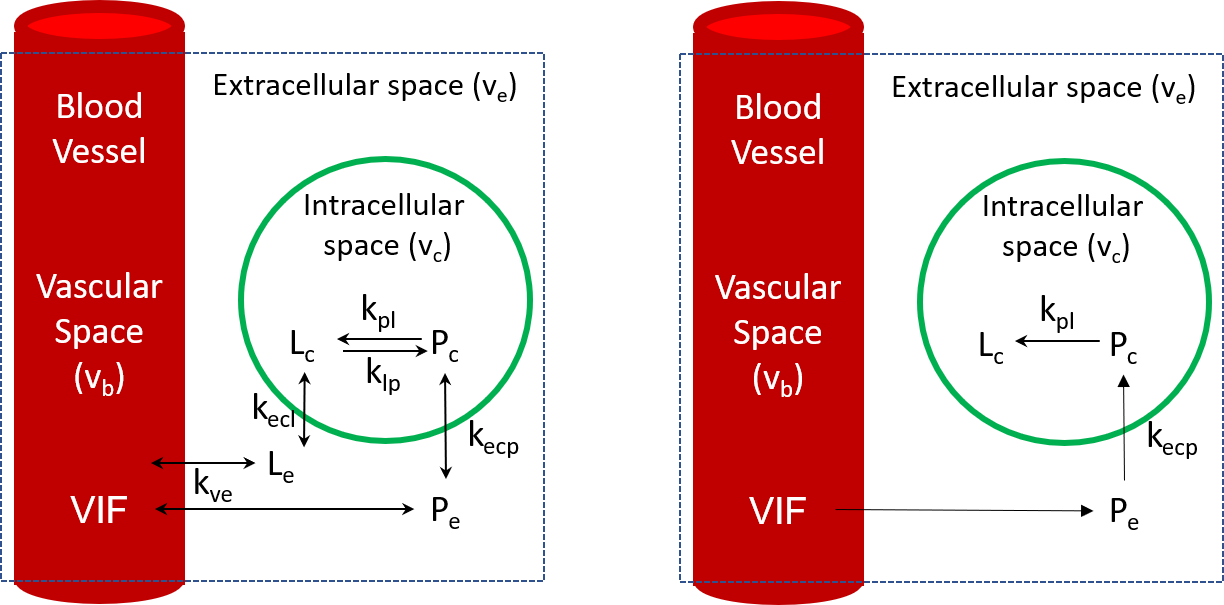
Previously, we compared several multi-compartmental models. The three-compartment two-site model consists of signal from pyruvate and lactate localized in vascular space (b), intracellular space (c), and exterior to both in extracellular space (e)8. HP pyruvate is transported to the voxel through vasculature, described by the vascular input function (VIF) (Figure 1, left).Simplifying the system facilitates an interpretable analytical solution for the AUC ratio. Assuming metabolites only traverse the physical compartments in the forward direction from the vasculature into the cell, the system dynamics are described by the following differential equations where P and L denote pyruvate and lactate and their subscripts denote the intravascular (c) and extracellular (e) compartments (Figure 1, right).
$$ \frac{\partial}{\partial t}P_e(t)=-\left(frac{k_{ecp}}{v_c}+R_{1,pyr}+\frac{1-cos\theta_p}{TR}+r_p\right) P_e(t)+\frac{k_{ve}}{v_e}VIF(t)=-\alpha_{pe}P_e(t)+\frac{k_{ve}}{v_e}VIF(t)\tag1$$
$$ \frac{\partial}{\partial t}P_c(t)=-\left(k_{pl}+R_{1,pyr}+\frac{1-cos\theta_p}{TR}+r_p\right) P_c(t)+\frac{k_{ecp}}{v_c}VIF(t)=-\alpha_{pc}P_c(t)+\frac{k_{ecp}}{v_c}P_e(t)\tag2 $$
$$ \frac{\partial}{\partial t}L_c(t)=-\left(R_{1,lac}+\frac{1-cos\theta_l}{TR}+r_l\right)L_c(t)+k_{pl} P_c(t)=-\alpha_{lc}L_c(t)+k_{pl}P_c(t)\tag3 $$
Here, $$$v_e$$$ and $$$v_c$$$ represent the volume fractions of the extracellular and intracellular spaces, $$$k_{ecp}$$$ and $$$k_{ve}$$$ denote the rates of metabolite transfer across the cell membrane and out of vascular tissue, and $$$R_{1,pyr}$$$ and $$$R_{1,lac}$$$ reflect signal losses due to $$$T_1$$$ relaxation. $$$\theta_x$$$ are the excitation angles for pyruvate and lactate, and TR is the repetition time. $$$\alpha_{xy}$$$ represent the rate of signal loss for x metabolite in compartment y, reflecting $$$T_1$$$ losses, excitation losses, and other losses ($$$r_p$$$,$$$r_l$$$ ) that compensate for simplifying assumptions.
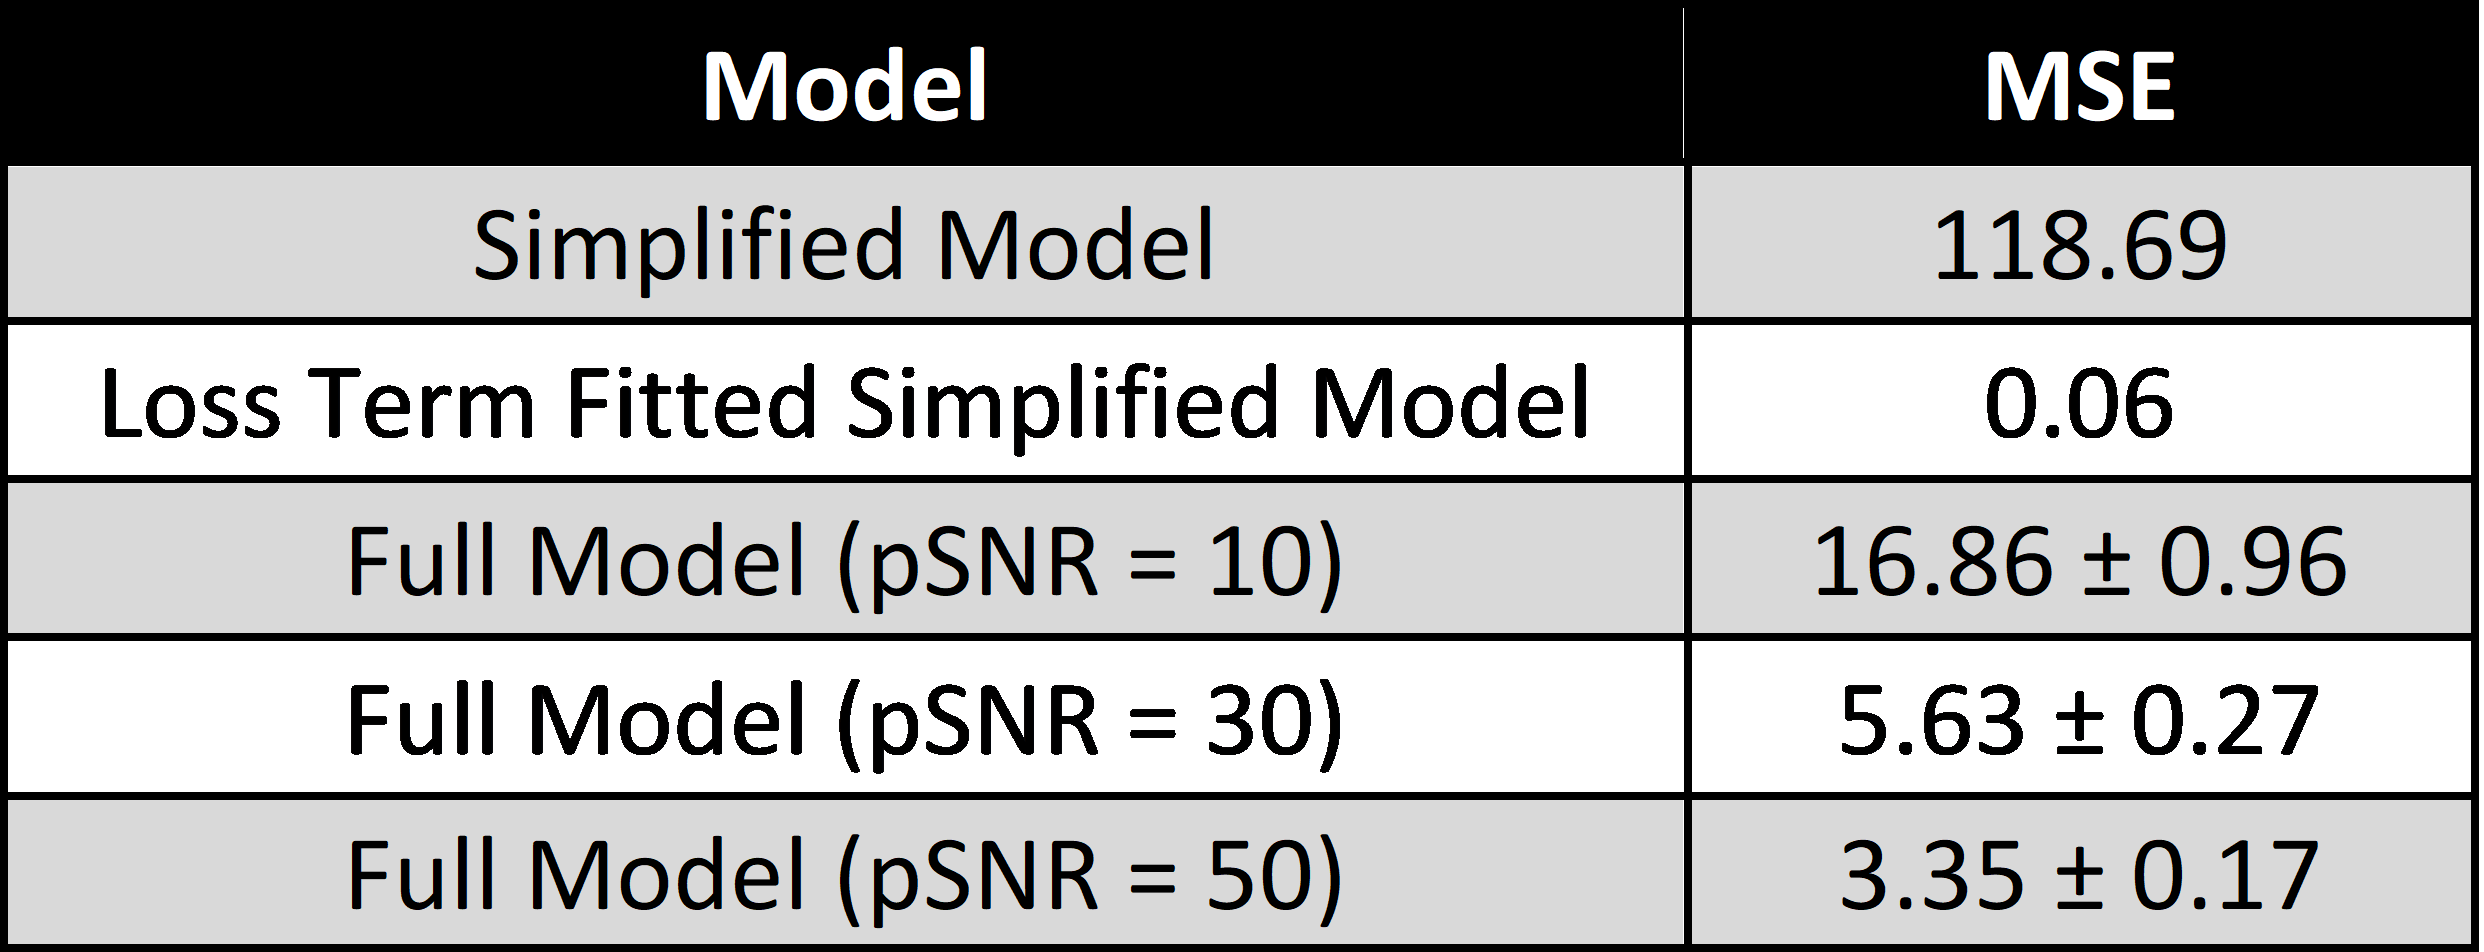
The simplified model was compared to the full three-compartment model. Since the PK parameters in the simplified model may not correspond to their counterparts in the full model, the simplified model was fitted to full model signal vs. time curves. The mean square error (MSE) of the simplified model was compared to normally distributed simulated noise.
Since the kinetics are first order, the signal curves for each compartment are found algebraically in Laplace space in terms of $$$\bar{VIF}(s=0)$$$. Taking the ratio of the volume weighted AUCs yields an expression that is independent of the VIF but depends on all other model parameters:
$$\frac{AUC_{lac}}{AUC_{pyr}} = \frac{sin\theta_l}{sin\theta_p}\cdot\frac{k_{pl}\frac{k_{ecp}k_{ve}}{v_e \alpha_{pe}\alpha_{pc}\alpha_{lc}}}{\frac{k_{ecp}k_{ve}}{v_e\alpha_{pe}\alpha_{pc}}-\frac{k_{ve}}{\alpha_{pe}}+v_b}\tag4$$
Results
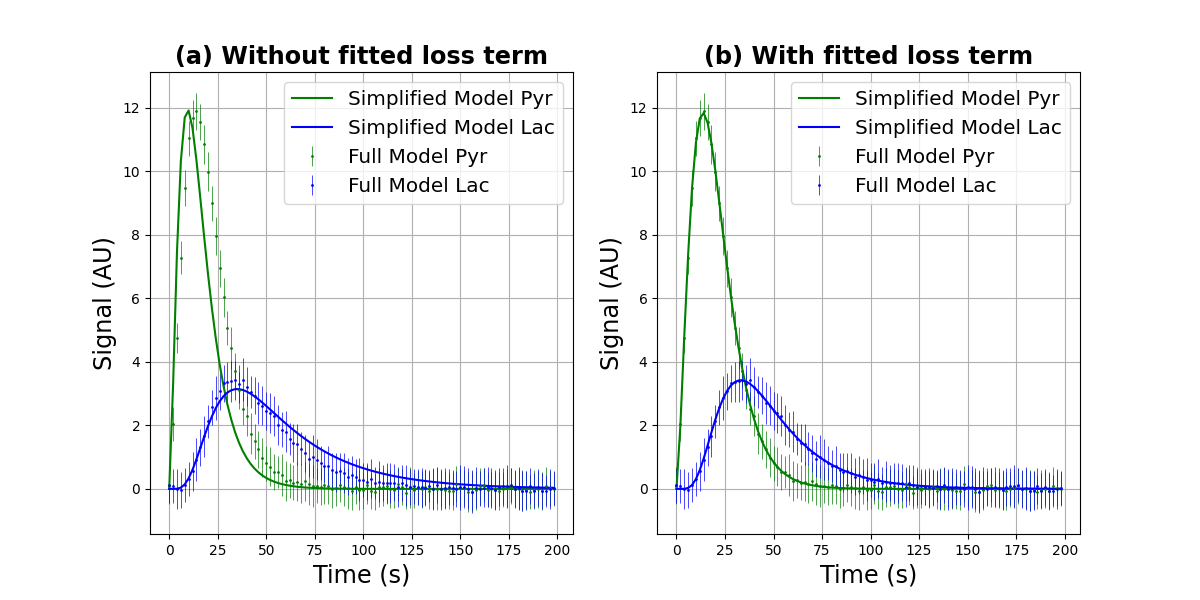
The fits of the simplified model to the full model are shown in Figure 2. When only the rate constants and VIF amplitude are fit, the pyruvate signal curve decays faster than predicted by the full model, resulting in a poor fit. The error from the lactate curve did not exceed a standard deviation of random noise with a peak SNR (pSNR) of 50, defined as the max pyruvate signal divided by the standard deviation of the noise.Fitting an additional signal loss factor inside each $$$\alpha_{xy}$$$ significantly improved the fit. When the loss terms are fit, the errors for all signal curves never exceed a standard deviation of the random noise. Even at relatively high pSNR as shown in Figure 1, the simplified model with fitted loss terms causes significantly less error than noise.
Discussion and Conclusion
We propose a simplified three-compartment model, which we have shown to be indistinguishable from the full model in the presence of noise. The simplified model breaks down acquired signal into different compartments, allowing an easy interpretation of the AUC ratio. A physiological interpretation of the AUC ratio in terms of PK parameters allows researchers to predict the relationship between the AUC ratio and $$$k_{pl}$$$ for a given experiment.To be useful, a model-free metric must be easy to compute and standardize, and accurately predict changes in $$$k_{pl}$$$. Our results show that the AUC ratio may not be linear with when signal comes from multiple compartments. In complex biological systems, the AUC ratio alone should be used with caution as a surrogate for aerobic glycolysis as it may not be a linear relationship.
Acknowledgements
This research was supported in part by funding from the National Cancer Institute of the National Institutes of Health (R01CA211150, R01CA280980). The content is solely the responsibility of the authors and does not necessarily represent the official views of the sponsors.References
1. Chen AP, Chu W, Gu YP, Cunningham CH. Probing early tumor response to radiation therapy using hyperpolarized [1-¹³C]pyruvate in MDA-MB-231 xenografts [published correction appears in PLoS One. 2013; 8(2):e56551.
2. Rao Y, Gammon S, Zacharias NM, et al. Hyperpolarized [1-13C]pyruvate-to-[1-13C]lactate conversion is rate-limited by monocarboxylate transporter-1 in the plasma membrane. Proc Natl Acad Sci USA 2020;117(36):22378-22389.
3. Daniels CJ, McLean MA, Schulte RF, et al. A comparison of quantitative methods for clinical imaging with hyperpolarized (13)C-pyruvate. NMR Biomed 2016;29(4):387-399. 4. Larson PEZ, Chen HY, Gordon JW, et al. Investigation of analysis methods for hyperpolarized 13C-pyruvate metabolic MRI in prostate cancer patients. NMR Biomed 2018;31(11):e3997.
5. Harrison C, Yang C, Jindal A, et al. Comparison of kinetic models for analysis of pyruvate-to-lactate exchange by hyperpolarized 13 C NMR. NMR Biomed 2012;25(11):1286-1294.
6. Hill DK, Orton MR, Mariotti E, et al. Model free approach to kinetic analysis of real-time hyperpolarized 13C magnetic resonance spectroscopy data. PLoS One 2013;8(9):e71996. Published 2013 Sep 4.
7. Larson PEZ, Bernard JML, Bankson JA, Bogh N, Bok RA, Chen AP, Cunningham CH, Gordon J, Hovener JB, Laustsen C, Mayer D, McLean MA, Schilling F, Slater J, Vanderheyden JL, von Morze C, Vigneron DB, Xu D. Current methods for hyperpolarized [1-13C]pyruvate MRI human studies. Magn Reson Med, forthcoming. DOI: 10.1002/mrm.29875
8. Bankson JA, Walker CM, Ramirez MS, et al. Kinetic Modeling and Constrained Reconstruction of Hyperpolarized [1-13C]-Pyruvate Offers Improved Metabolic Imaging of Tumors. Cancer Res 2015;75(22):4708-4717.
Figures