5078
Comparison of Deuterium Metabolic Imaging and FDG-PET in Alzheimer’s Disease1Aarhus University, Aarhus, Denmark, 2Aarhus University Hospital, Aarhus, Denmark, 3Aalborg University Hospital, Aalborg, Denmark, 4GE Healthcare, Munich, Germany
Synopsis
Keywords: Deuterium, Deuterium
Motivation: Distinguishing Alzheimer’s Disease form other dementias is becoming increasingly important with the development of amyloid-targeting therapies. This requires extensive clinical and paraclinical work-up, often including structural and molecular brain imaging.
Goal(s): To compare deuterium metabolic imaging (DMI) with routinely used clinical imaging technologies for the detection of Alzheimer’s Disease.
Approach: We performed a prospective clinical trial of 5 healthy age-matched controls compared with 10 patients Alzheimer’s dementia.
Results: Deuterium metabolic imaging showed decreased metabolism in temporal and parietal brain regions in patients with Alzheimer’s disease compared with healthy controls. This hypometabolic pattern correlated well with FDG-PET.
Impact: This preliminary study suggests that metabolic imaging in suspected dementia may be performed with DMI. This would allow simultaneous imaging of structural, vascular, and metabolic changes at a cost comparable to FDG-PET.
Alzheimer’s Disease is the most common cause of dementia. Identifying the contribution of Alzheimer’s pathology to dementia in the individual patient is becoming more important as amyloid-targeting treatments become available. Structural brain imaging and metabolic FDG-PET imaging are essential tools in this evaluation. DMI is emerging as a biomarker of pathway-specific glucose metabolism which can be combined with routine MRI of the brain [1]. DMI potentially enables simultaneous state-of-the-art assessment of brain structure and vasculature as well as metabolism.
Methods
In a prospective clinical study approved by the Ethics Committee of Central Denmark, 9 patients with Alzheimer’s dementia and 5 age-matched controls were recruited from April to October 2023. The participants consumed 75g of [6,6′-2H2]glucose in 200 ml of water, the equivalent of an oral glucose tolerance test, and underwent DMI after 90 minutes. Scanning was performed on a 3T clinical system (MR 750, GE HealthCare) equipped with a dual-tuned (1H/2H) quadrature Tx/Rx volume coil (PulseTeq, UK). DMI was acquired using four averages of 3D density-weighted magnetic resonance spectroscopy imaging employing a soft pulse (flip angle = 70°, TR = 155.8 ms) and a density-weighted spiral readout (matrix size = 10×10×10, field of view = 24×24×24 cm3, spectral points = 700, bandwidth = 5000 Hz). Total scan time was 17 minutes and 25 seconds. T1-weighted images were acquired using a 3D inversion-recovery prepped fast spoiled gradient echo sequence (2×2×2 mm3 resolution, TR/TE = 5.5/1.7 ms, flip angle = 12°, TI = 450 ms, 2 averages).The DMI data were fitted to yield maps of deuterated glucose, lactate, water, and glutamine+glutamate (Glx). FDG-PET images of glucose uptake were obtained from the patient’ medical records. Using FSL, the DMI and FDG data were co-registered to the T1-weighted images and normalized to standard space. The mean signals of FDG and the DMI metabolites were estimated in series of temporoparietal regions of interest known to be involved in Alzheimer’s Disease [2]. In both cases, the data were internally normalized to the cerebellum.
Results
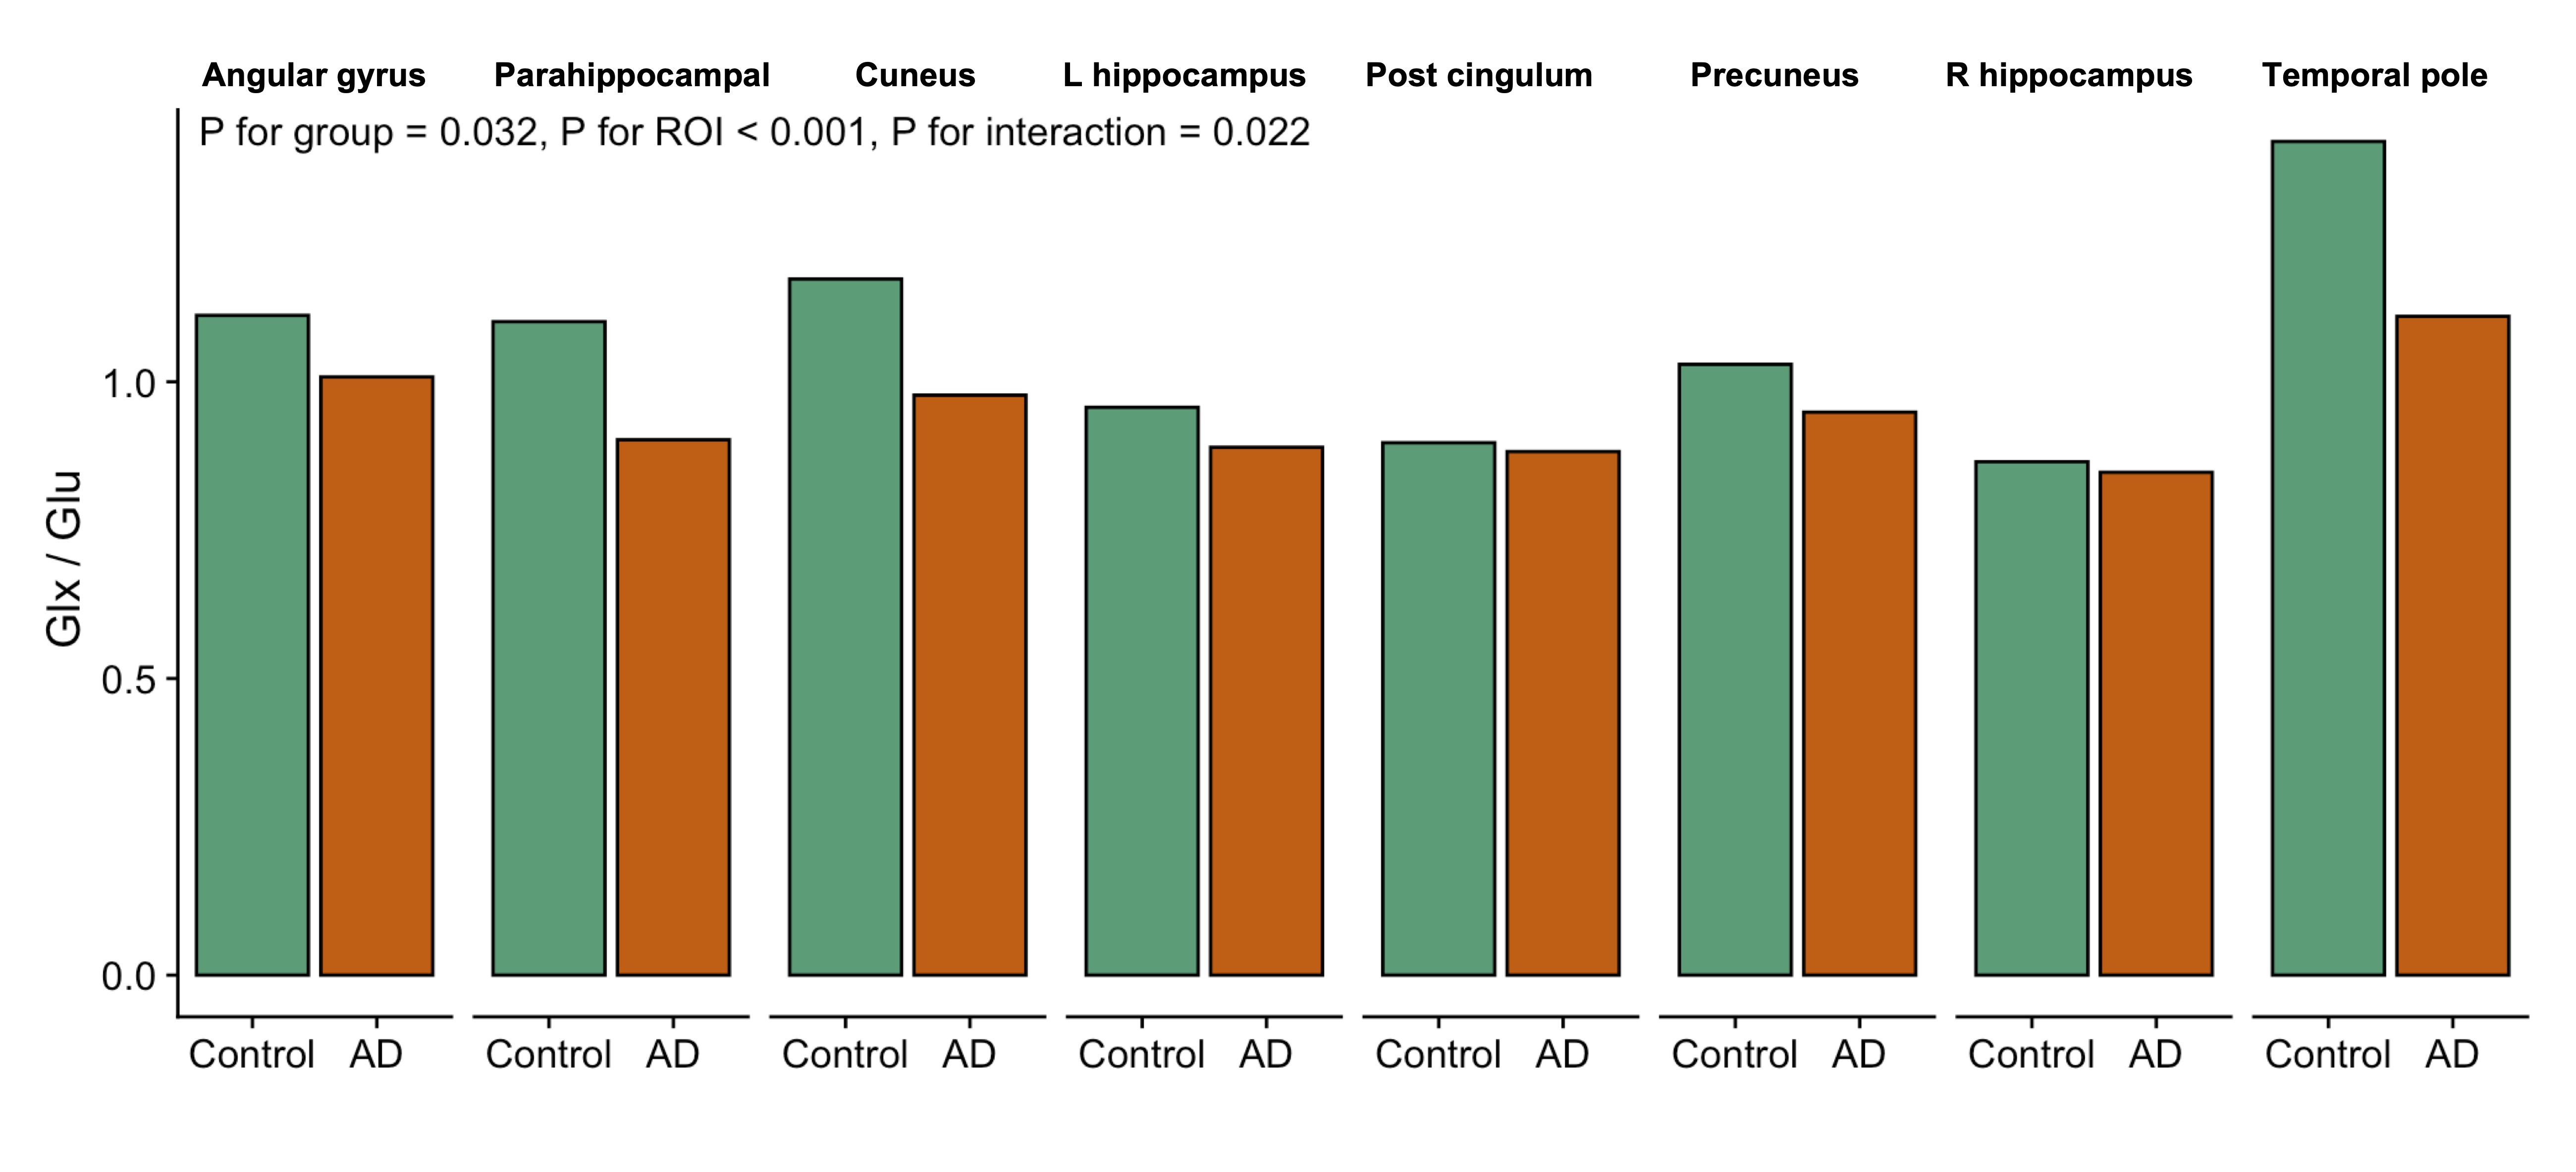
The patients with Alzheimer’s dementia (6/9 female) were a mean of 70.9 ± 6 years versus 68 ± 7 years in the control group (1/5 female). The mean time from glucose consumption to imaging was 115 ± 16 versus 95 ± 18 minutes. All examinations yielded spectra of sufficient quality to be included in the analysis (Figure 1), several of them showing hypometabolic patterns consistent with the FDG-PET images (Figure 2). We compared DMI to FDG-PET. There was a good correlation (r = 0.71) between normalized signal intensities of FDG and Glx (Figure 3). The correlations between FDG and 2H-glucose, 2H-lactate, and 2H-water were 0.67, 0.45, and 0.7, respectively. When comparing DMI of age-matched controls and patients, we observed a decreased Glx/glucose ratio across the defined regions of interest (Figure 4; P = 0.03). This difference was more pronounced in larger than smaller regions. A similar trend was observed for lactate, however insignificant (P = 0.12) and seemingly largest for temporal regions (not shown).
Discussion
The present study suggests that DMI yields metabolic information comparable to FDG-PET. Opposed to PET, DMI uses a stable isotope that is consumed orally, somewhat simplifying the examination. Moreover, only smaller additions are required to 3T systems to enable DMI, promising relatively good accessibility of the technology. In addition, DMI yields information not only on glucose uptake, but also its anaerobic conversion to lactate or aerobic conversion to Glx. As such, a deeper level of metabolism is imaged. While we show a decrease in glucose to Glx conversion, our data does not support a change in conversion to lactate. Therefore, the usefulness of detangling anaerobic from aerobic metabolism remains for future studies to address. As DMI was reinvented recently [1], more work is warranted to improve the acquisition. The spatial resolution is poor compared to FDG-PET, albeit much better at higher field strengths [3]. The scan time is long compared to many other MRI sequences, which possibly can be improved by advanced acquisition schemes or thorough interleaving the proton and deuterium acquisitions [4]. As DMI is young, we believe many of these drawbacks to be mitigated. As a first step, this study compares a cohort of patients with Alzheimer’s dementia to controls. However, future studies should seek to test the diagnostic capabilities of the technology in cohorts of patients with various and mixed causes of dementia.
Conclusion
DMI seems capable of imaging the well-known hypometabolic pattern in Alzheimer’s Disease and as thus represents a combined modality to the conventional structural and metabolic exams.
Acknowledgements
This study was supported by grants from the Lundbeck FoundationReferences
References
1. De Feyter, H. M. et al. Deuterium metabolic imaging (DMI) for MRI-based 3D mapping of metabolism in vivo. Sci Adv 4, eaat7314 (2018).
2. Herholz, K., Carter, S. F. & Jones, M. Positron emission tomography imaging in dementia. Br J Radiol 80 Spec No 2, S160-167 (2007).
3. de Graaf, R. A. et al. On the magnetic field dependence of deuterium metabolic imaging (DMI). NMR Biomed 33, e4235 (2020).
4. Yanning Liu et al. Parallel detection of multi-contrast MRI and Deuterium Metabolic Imaging (DMI) for time-efficient characterization of neurological diseases. medRxiv 2023.10.02.23296408 (2023) doi:10.1101/2023.10.02.23296408.
Figures
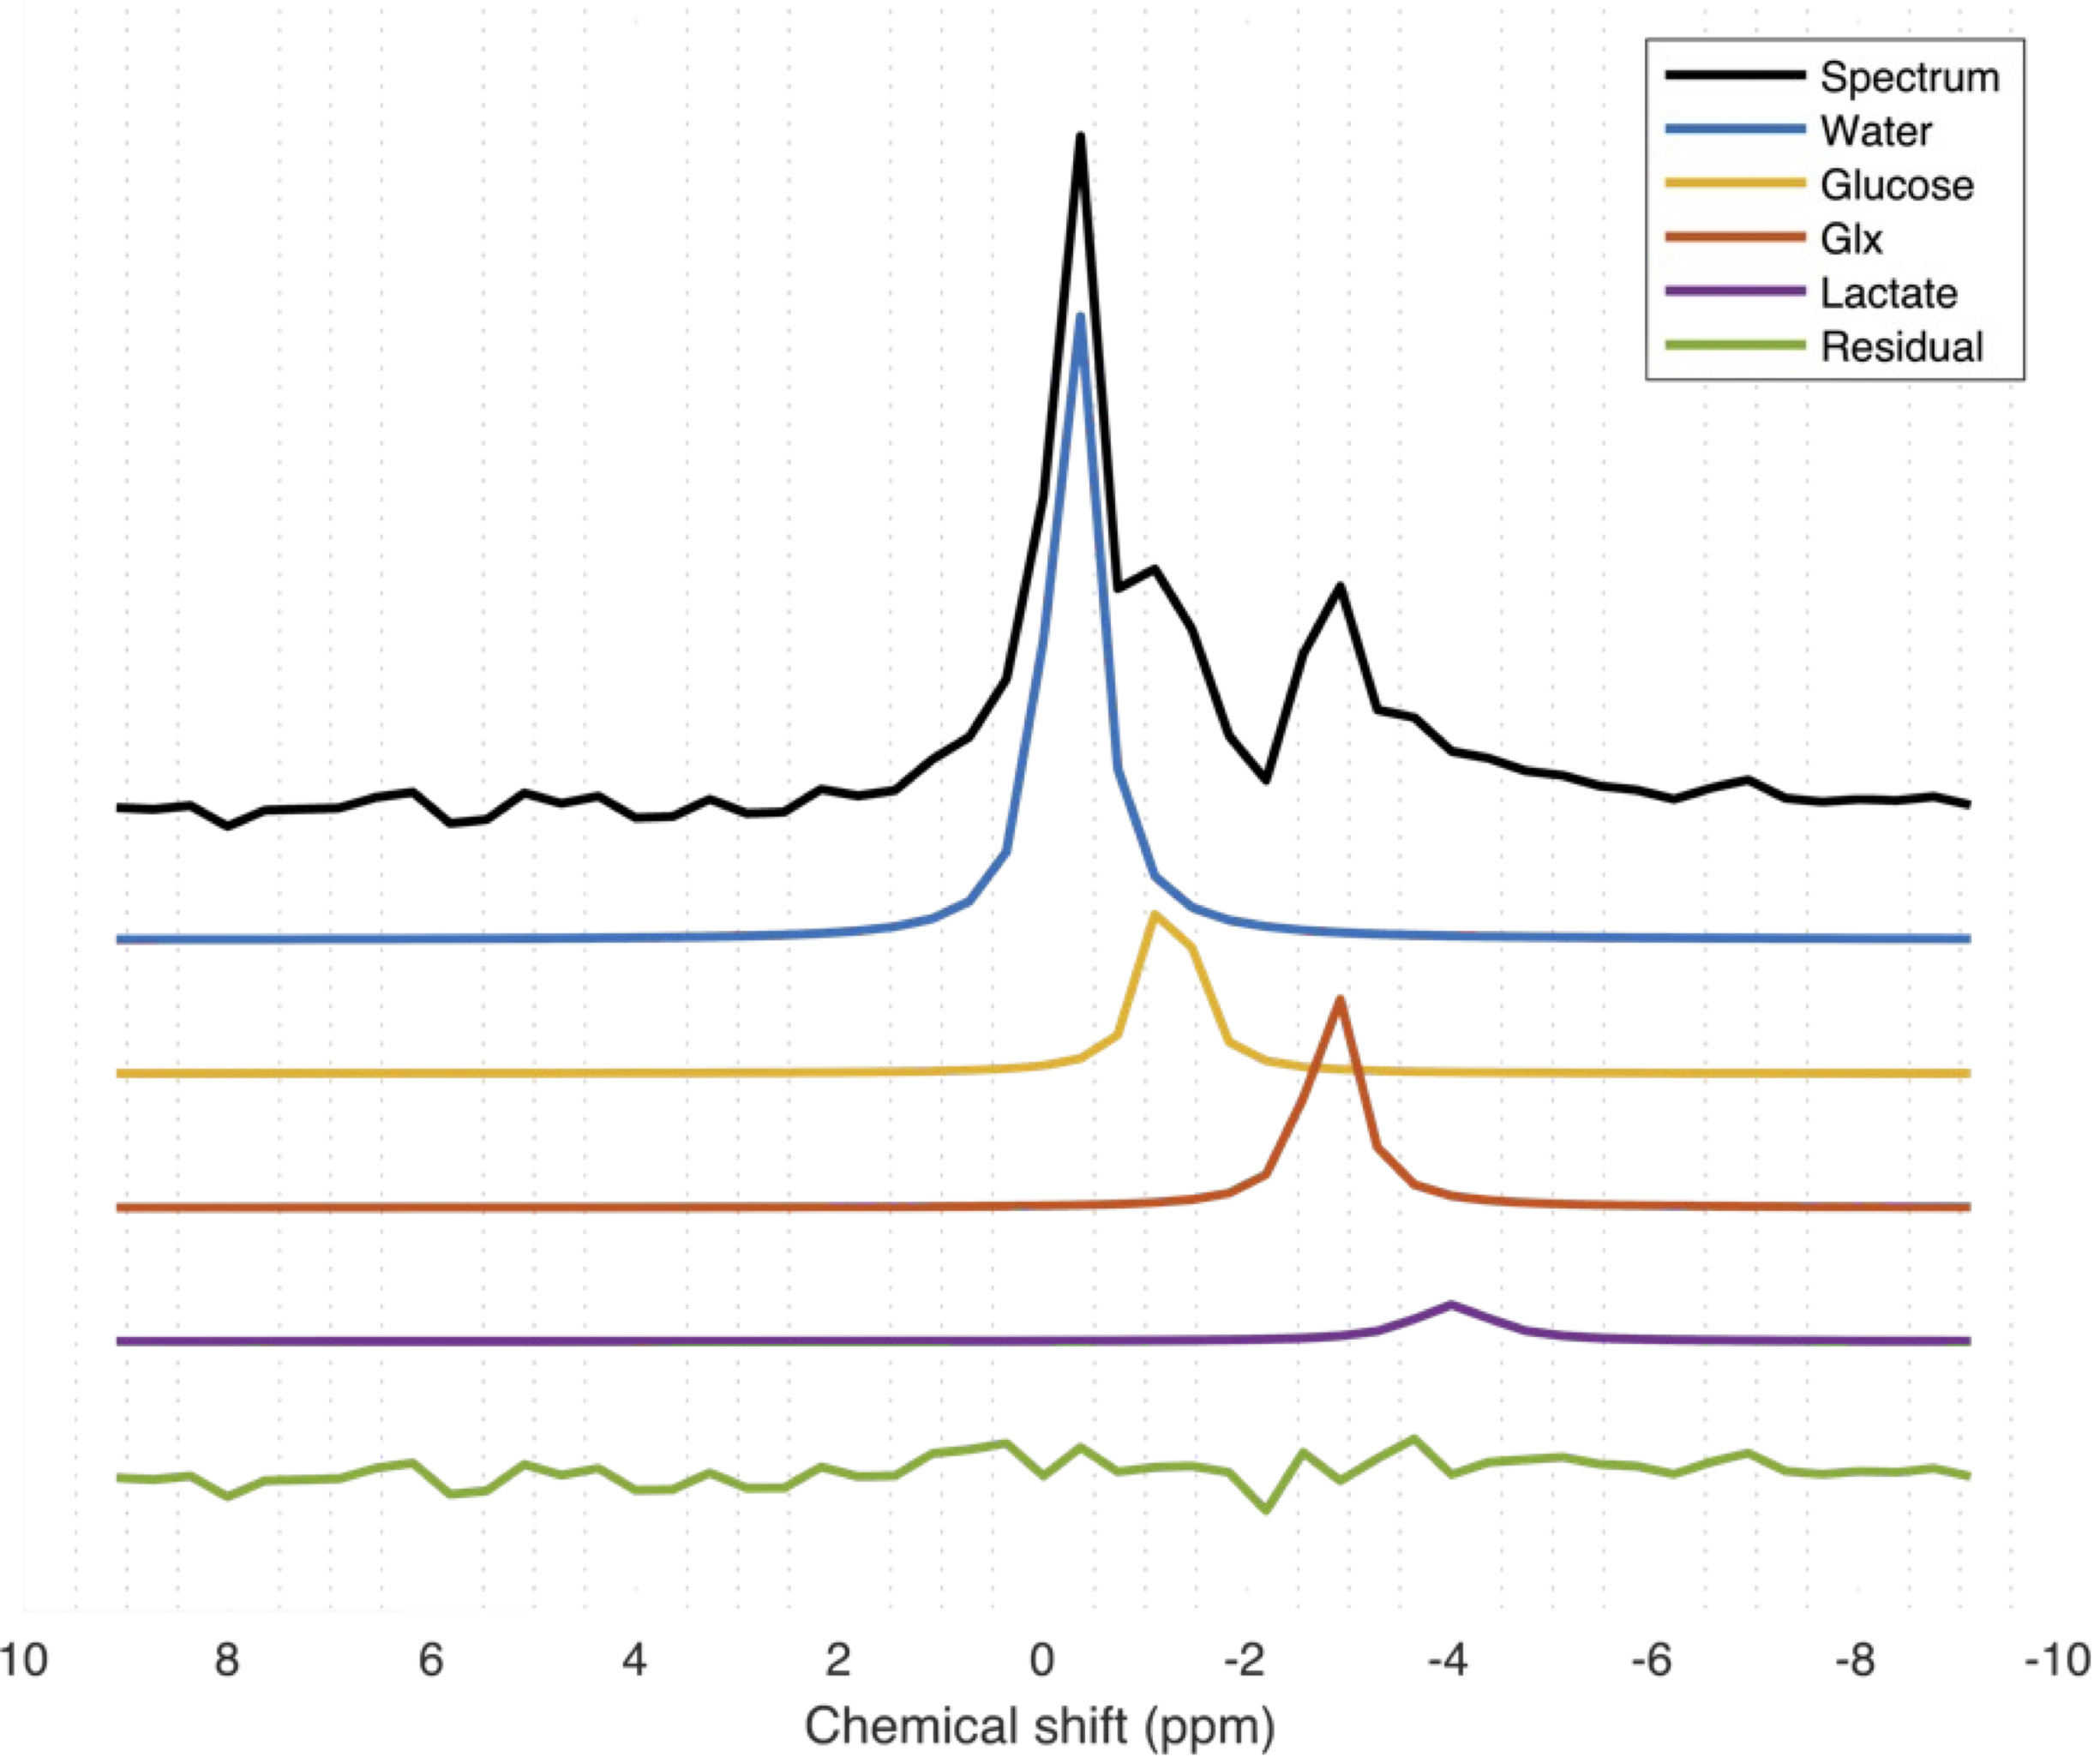
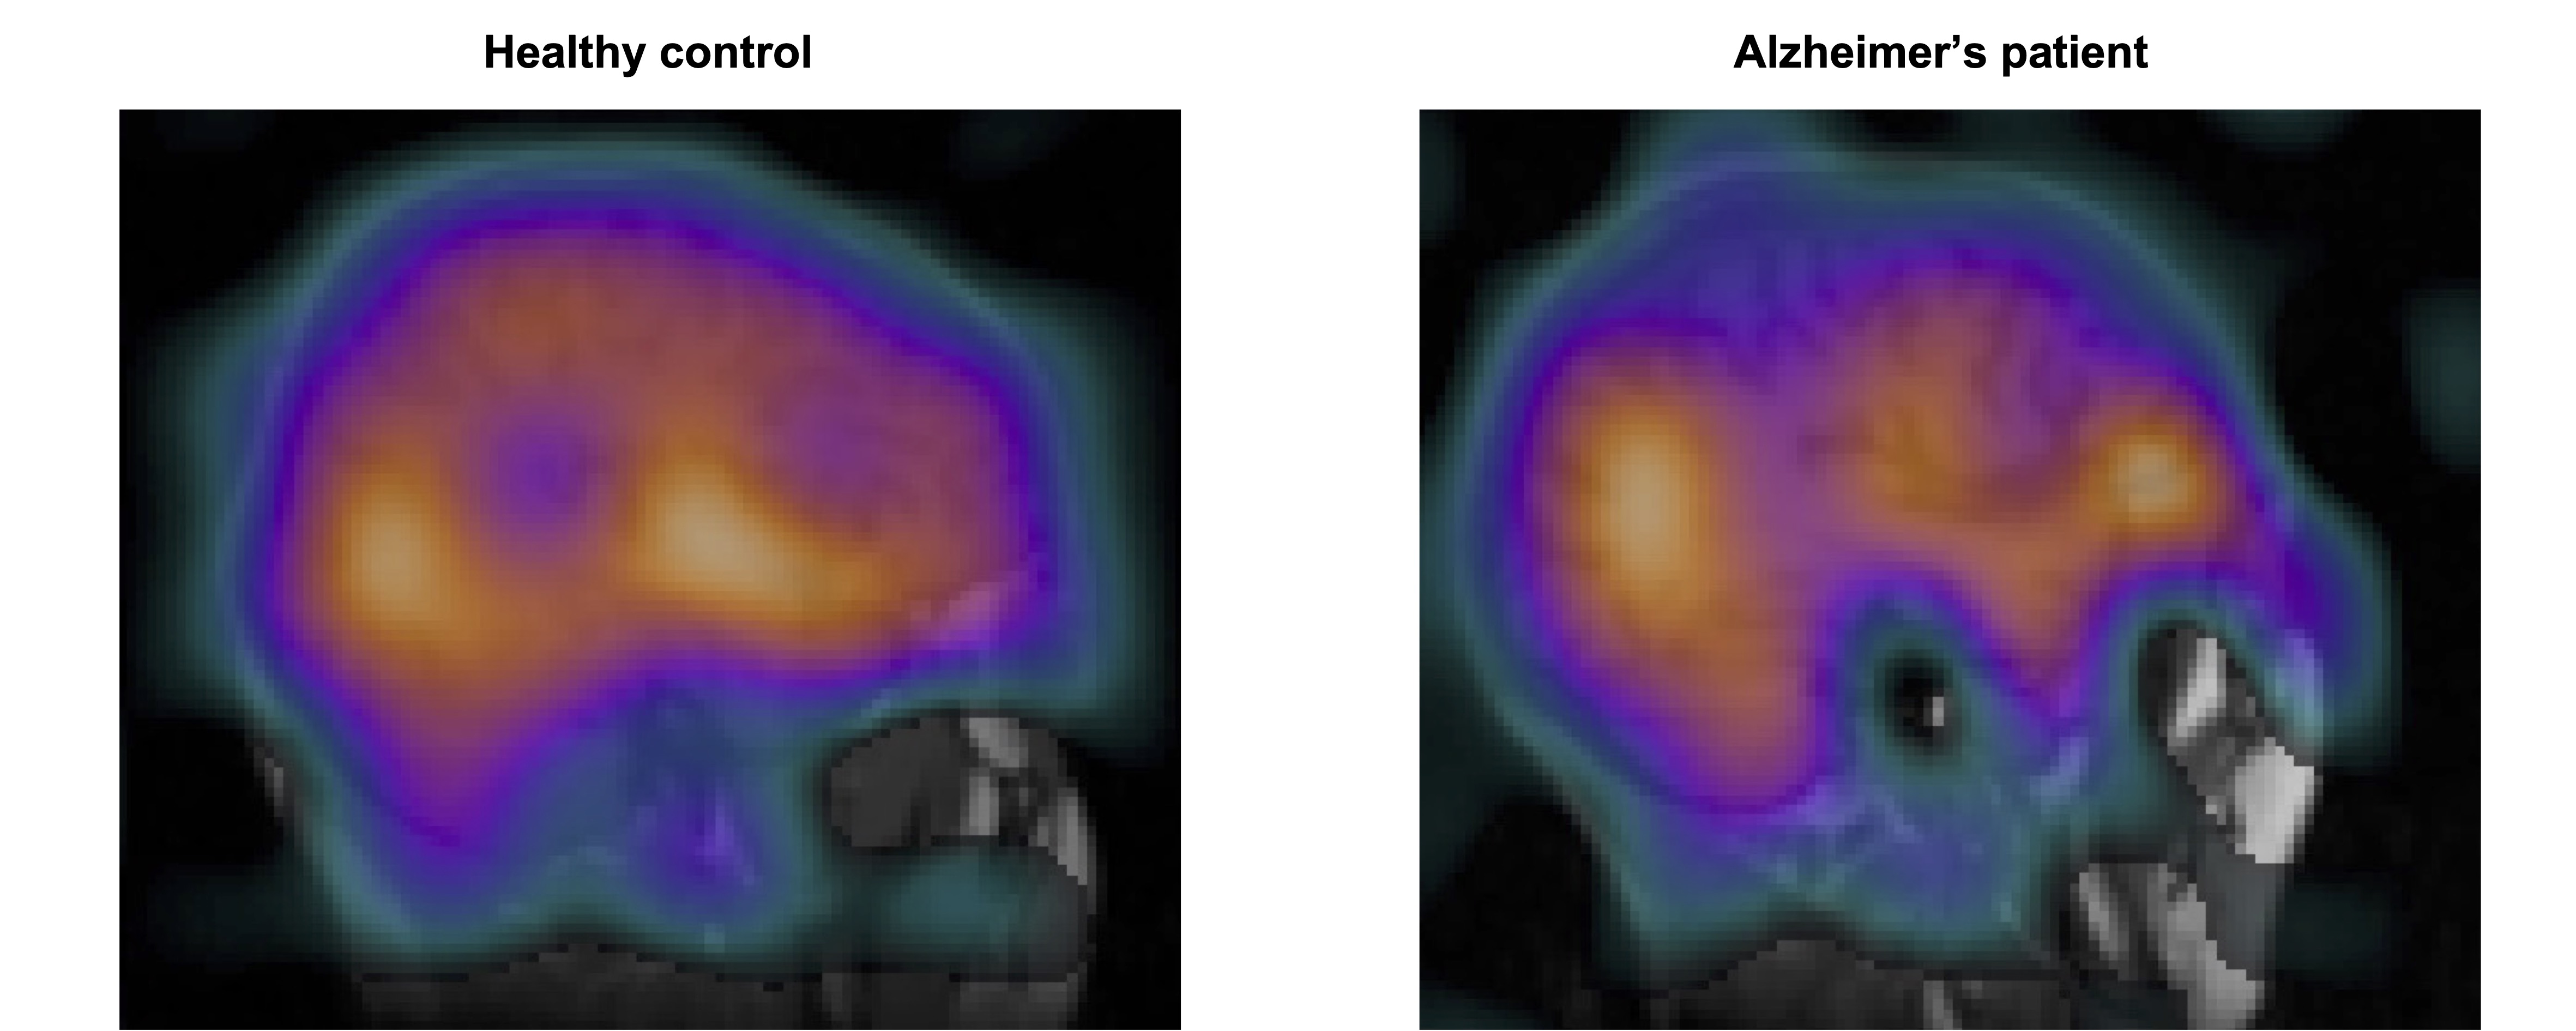
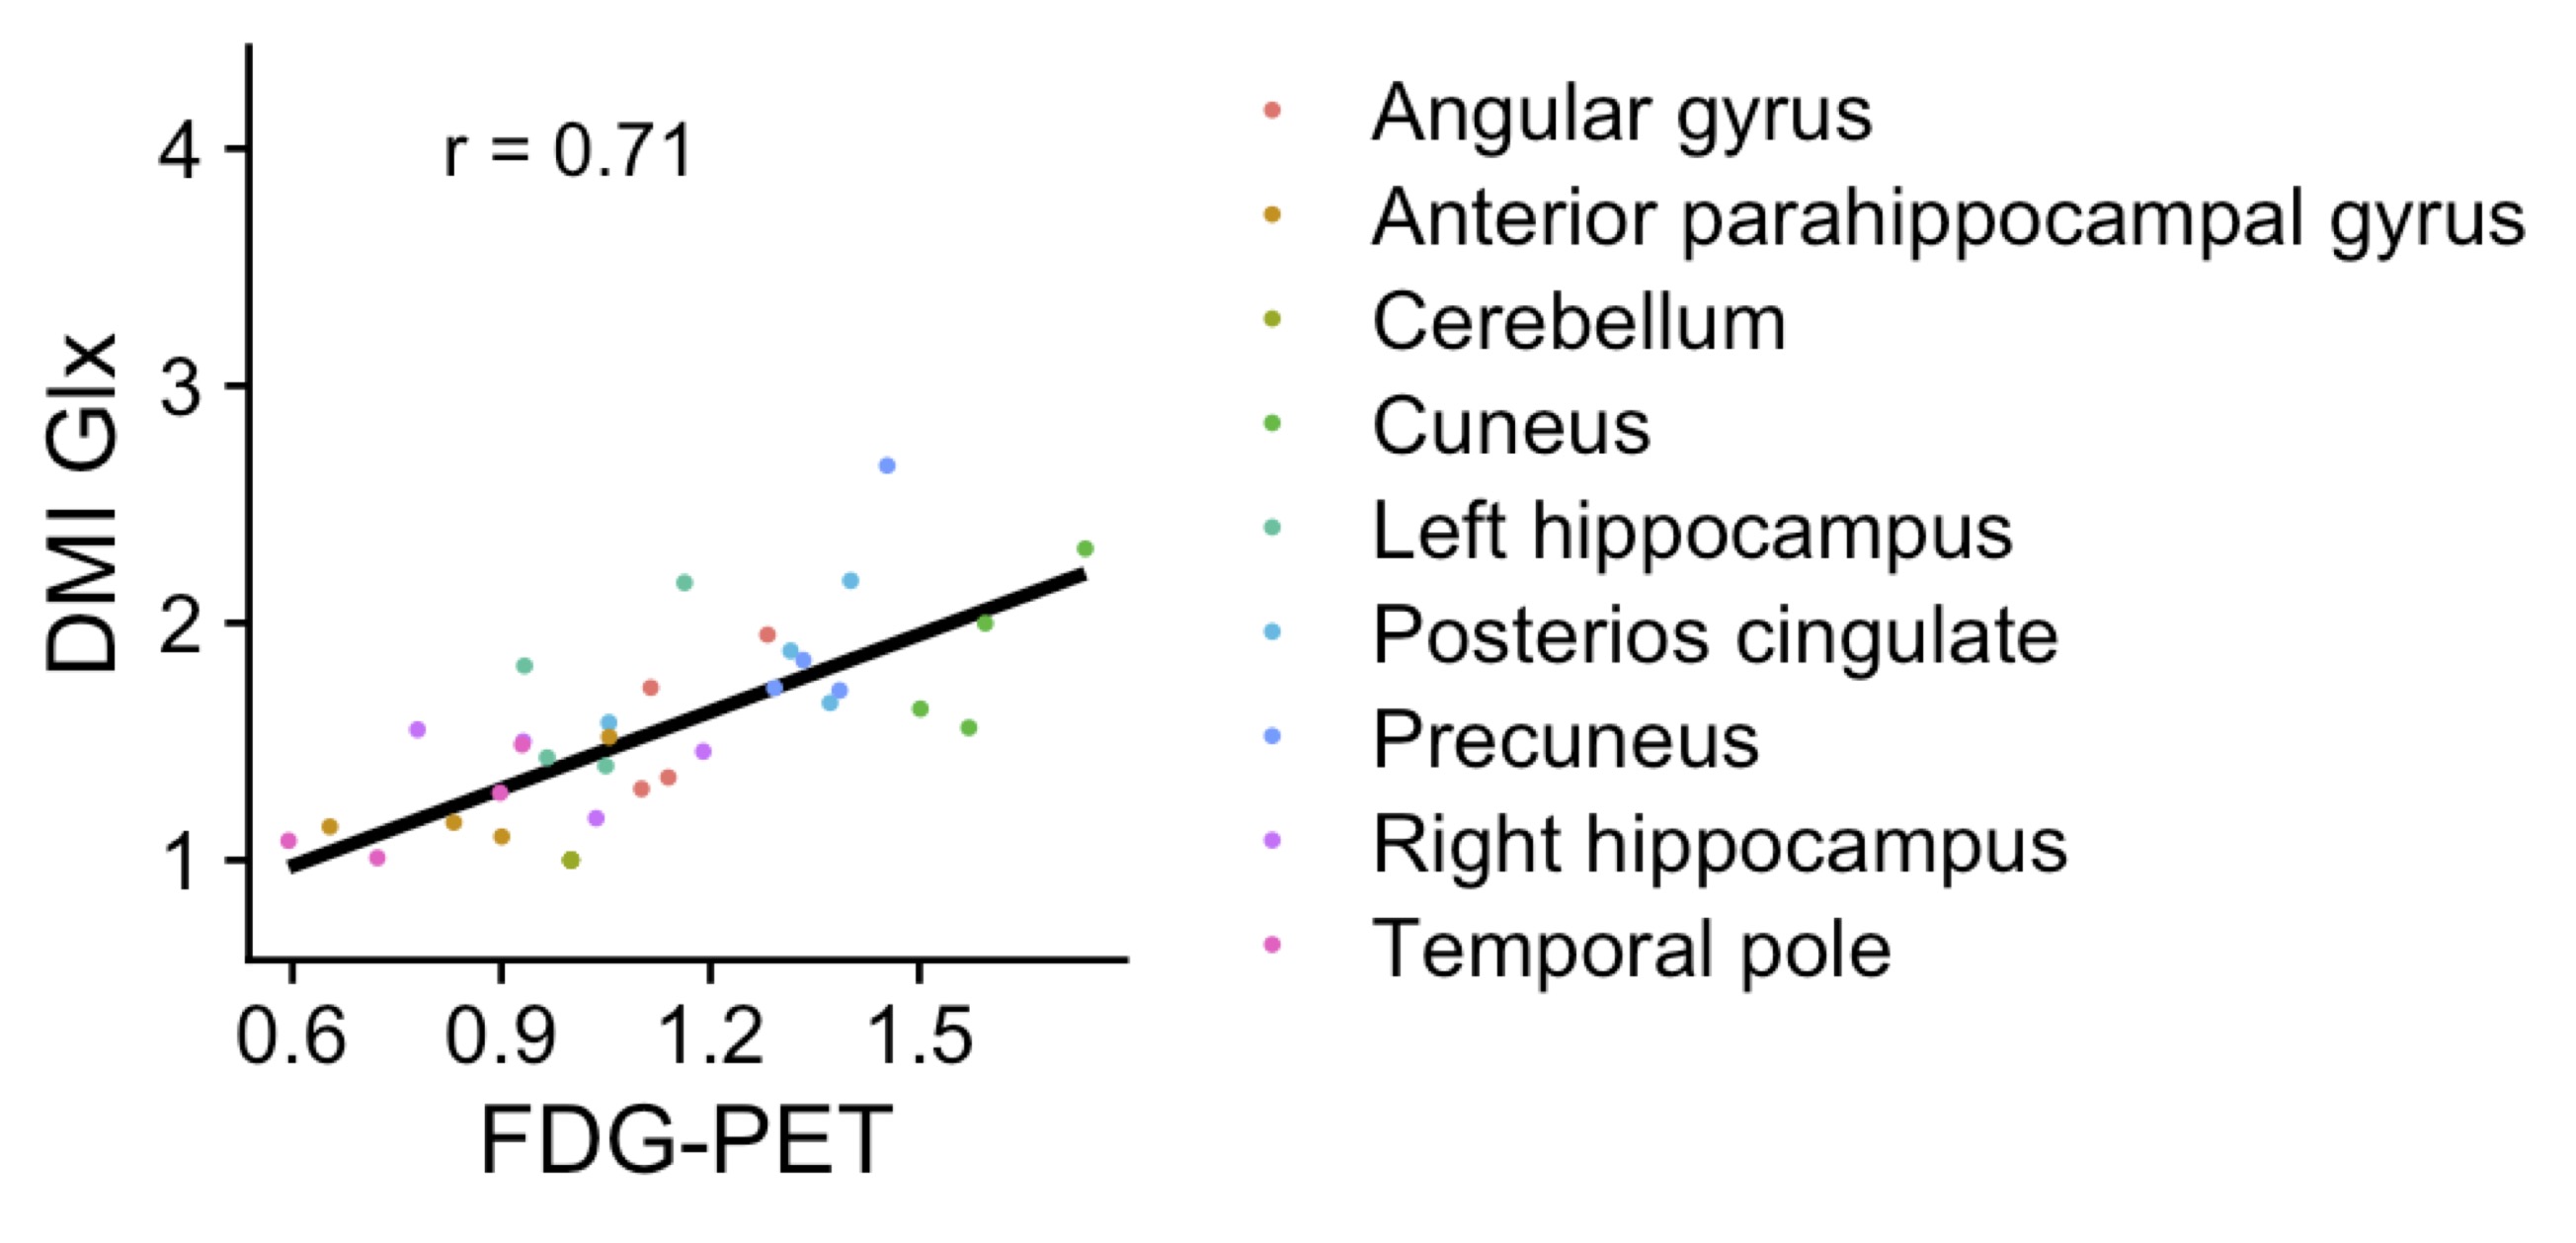
Figure 3: Correlation between FDG-PET, the metabolic imaging modality routinely used for dementia diagnostics today, and deuterium metabolic imaging of the glutamine+glutamate (Glx) pool. In both cases, the signal intensity was internally normalized.