5077
The effect of [6,6'-2H2]glucose dose on human brain deuterium metabolic imaging at 7T1Radiology and Neurosurgery, UMC Utrecht, Utrecht, Netherlands, 2Radiology, University Medical Center Utrecht, Utrecht, Netherlands, 3CTI Lab support, University Medical Center Utrecht, Utrecht, Netherlands, 4Neurosurgery, University Medical Center Utrecht, Utrecht, Netherlands
Synopsis
Keywords: Deuterium, Spectroscopy
Motivation: Deuterium metabolic imaging (DMI) is used to study metabolic processes, but the effect of varying substrate doses on DMI data in the brain is not yet known
Goal(s): Comparing different doses aims to reduce cost, while still achieving sufficient sensitivity for DMI
Approach: Three healthy participants received different doses of [6,6'-2H2]glucose on two occasions and underwent dynamic 7T DMI scans
Results: In 120-minutes after ingesting [6,6'-2H2]glucose , there is no clear difference in the signal of 2H-glucose/2H-Glx in the brain between the 0. 50-0.75g/kg doses. However, there was an earlier decrease in the signal when using the 0.25g/kg dose in one subject.
Impact: We compared three different doses [6,6'-2H2]glucose for Deuterium Metabolic Imaging of the brain, at 7T. Metabolite signals were comparable for the 0.50g/kg and 0.75g/kg doses, making 0.50g/kg a potential cost-saving alternative for clinical translation.
Introduction
Deuterium metabolic imaging (DMI) is a novel, non-invasive metabolic imaging technique typically undertaken with oral intake of 2H-labeled substrates, such as [6,6'-2H2]glucose, to acquire three-dimensional metabolic maps1. DMI can be used to dynamically monitor glycolytic and oxidative glucose metabolism in the brain3,4 , or can be used to generate metabolic maps at a single time point for imaging regional metabolic alterations, such as those found in tumors2-4.In most human studies, [6,6'-2H2]glucose is administered at 0.75-0.80 g/kg body weight5-8. It is however unknown how the [6,6'-2H2]glucose dose affects the various metabolite signals in dynamic DMI data of the brain. The objective of this study was therefore to compare three different doses of [6,6'-2H2]glucose necessary for signal detection in the human brain during dynamic DMI at 7T.
Methods
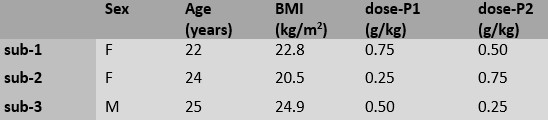
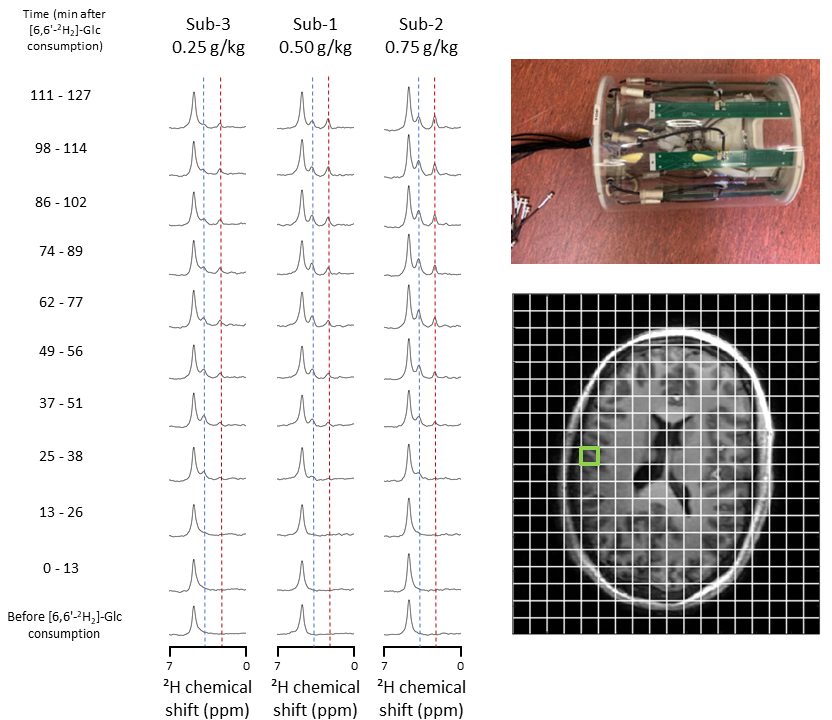
Experimental protocolThree healthy subjects underwent two scanning sessions with at least a 2-week interval, receiving different doses of [6,6'-2H2]glucose dissolved in water (0.2g/ml) (Table-1). Subjects fasted overnight and were scanned in the morning. Subjects received an intravenous catheter for blood sampling at 10-minute intervals. They were placed in a 7T MR scanner (Philips, Best, NL), using a custom-built 2H transmit bore coil and a head coil equipped with 8 2H-receive loops and 8 1H-transmit/receive dipole antennas (Figure-3)9.
Prior to [6,6'-2H2]glucose administration, B0-shimming was performed and T1-weighted images were acquired. A baseline DMI scan was conducted, followed by oral administration of [6,6'-2H2]glucose through a 1.5 m tube, while subjects remained in the MR system. DMI data acquisition lasted ~120 minutes.
The DMI data was acquired using a 3D FID-MRSI sequence: voxel size:12x12x12 mm3, field of view: 240x180x216 mm3, repetition time (TR): 100 ms, echo time (TE): 1.82 ms, spectral bandwidth: 2800 Hz, 256 data points, 4 sample averages at the center of k-space, and an acquisition time of 11:44 minutes/scan.
Post-processing
The data were processed with an in-house MATLAB script (Matlab R2021a, MathWorks, USA) and included spatial Fourier transformation, phase correction. Signal from the 8 2H receive channels was combined using whitened singular-value decomposition (WSVD). Deuterated water (HDO), glucose (2H-Glc), and glutamate/glutamine (2H-Glx) signals were fitted with AMARES, using Lorentzian line shapes10. To quantify, the signals were normalized to the baseline HDO signal amplitude in the same voxel and adjusted for label loss11. The T1-weighted image was processed with a SPM12 algorithm for gray matter, white matter, and cerebrospinal fluid segmentation, to account for a voxel-wise fractional water content12. For visualization, PCA-denoising, spectral zero-filling, and apodization with a 5-Hz exponential function were applied13.
Plasma glucose levels were measured using a YSI glucose analyzer (2500 series, YSI, USA). The atom percent excess (APE) of deuterium in plasma glucose was determined through gas chromatography-mass spectrometry14-16.
The linear correlation between plasma and brain 2H glucose was determined through curve-fitting in MATLAB using paired data points collected at the closest time intervals.
Results
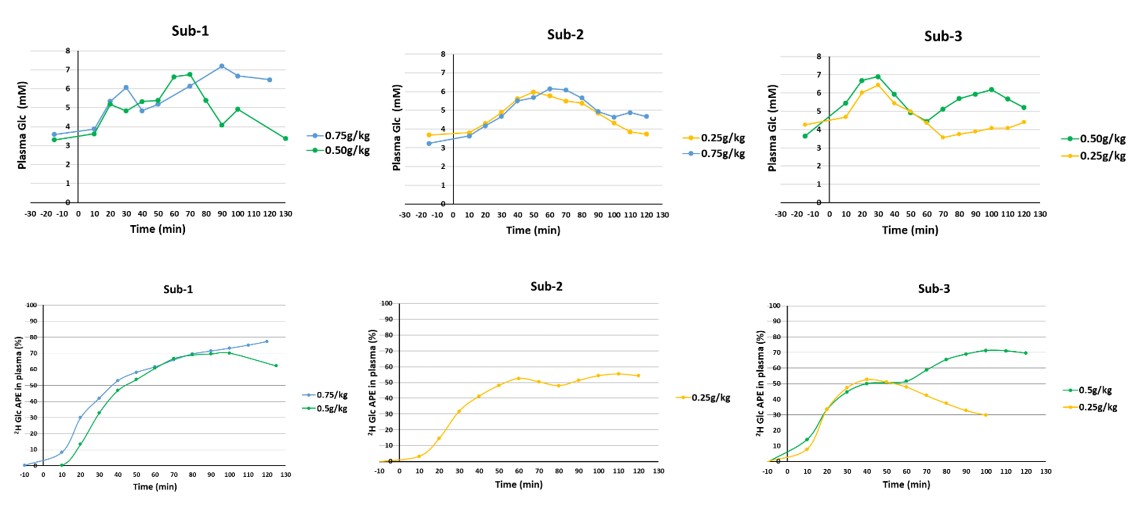
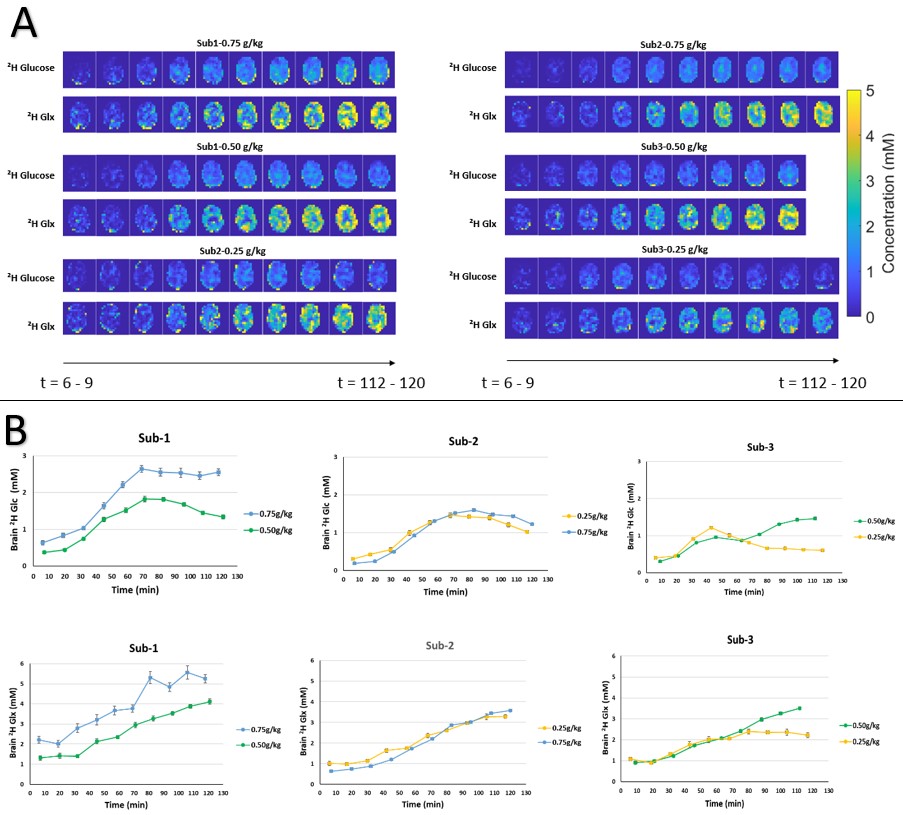
For all three doses, plasma glucose APE rapidly increased in the initial 30 minutes following [6,6'-2H2]glucose ingestion (Figure-2). After 60 minutes, no APE difference was observed between the 0.50g/kg and 0.75g/kg doses, but a lower APE was seen at 0.25g/kg. Blood glucose levels, per subject, seem dose independent in the first ~40 minutes.In Figure-3, 2H MR spectra show temporal changes for three scans with varying [6,6'-2H2]glucose doses in different subjects. Figure-4A displays quantified 2H-Glc and 2H-Glx concentrations, while Figure-4B shows concentration time curves averaged across the entire brain. Average brain 2H-Glc concentrations reached a plateau for all doses, with the lowest plateau in subject 3 (0.25g/kg) and the highest in subject 1 (0.75g/kg), This plateau was not always maintained until the end of the study. Subject 2 showed no apparent difference in brain 2H-Glc concentrations between the 0.25g/kg and 0.75g/kg doses (Figure-4A,B). Average brain 2H-Glx concentrations increased linearly over 120 minutes following glucose administration, except for subject 3 (0.25g/kg), where it plateaued after 95 minutes (Figure-4A,B).
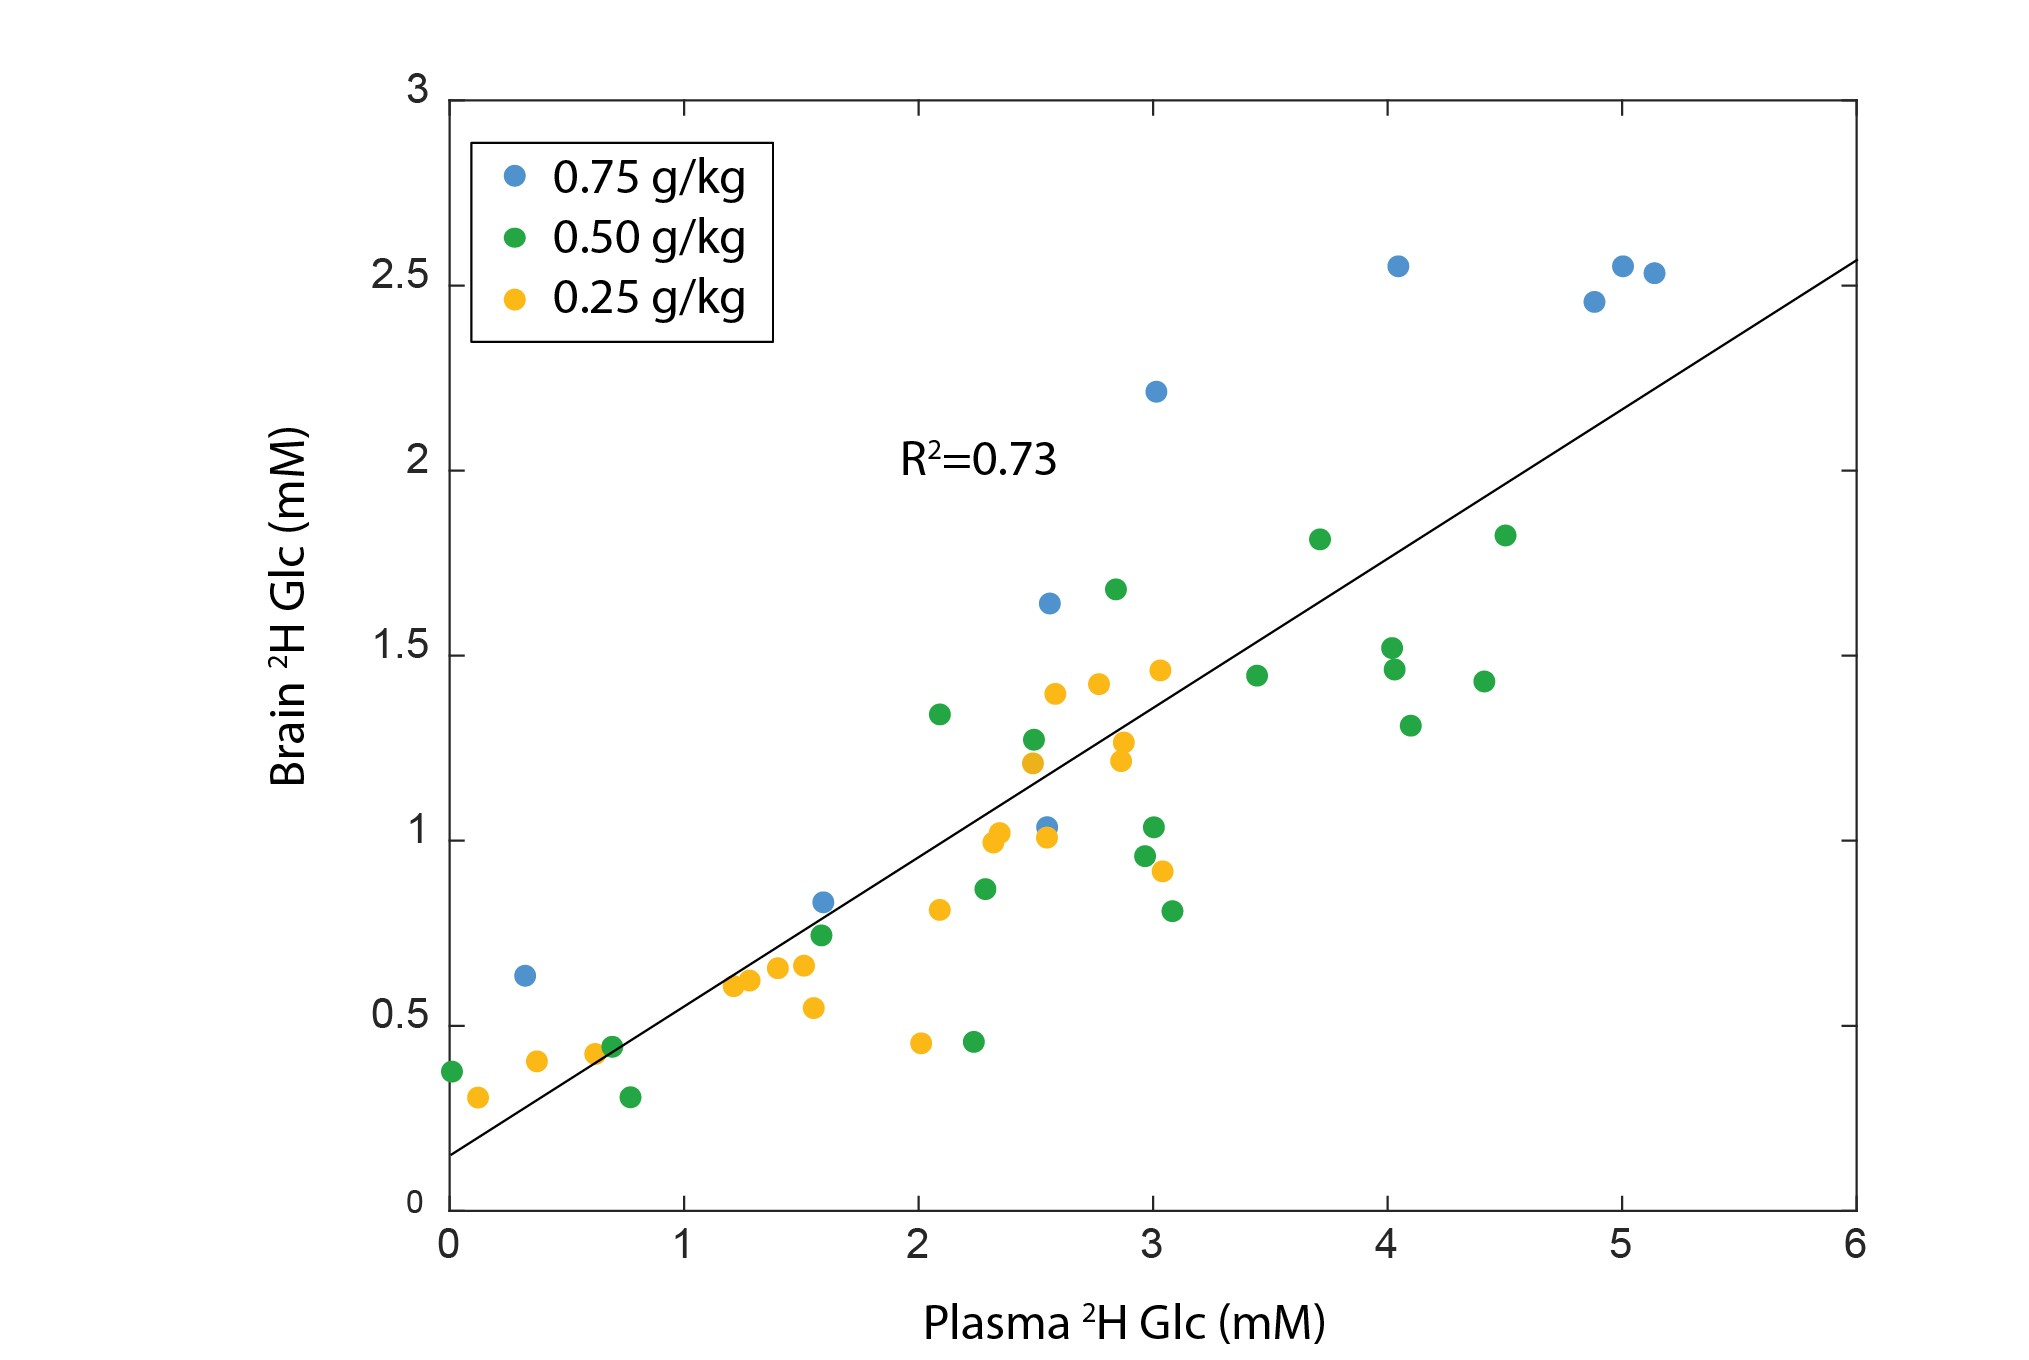
Figure-5 shows a positive linear correlation between plasma 2H glucose and brain 2H glucose (R2=0.75).
Discussion and conclusion
We compared three [6,6'-2H2]glucose doses on plasma glucose 2H APE and brain DMI data. As expected, our data showed a linear relationship between plasma and brain glucose17. APE and brain 2H-Glc and 2H-Glx concentrations were similar for 0.50-0.75g/kg doses. At 0.25g/kg, there was more variability, with one subject showing lower plasma glucose 2H APE and brain 2H-Glc and 2H-Glx concentrations toward the end of the experiment. Our findings suggest a potential reduction in dose from 0.75g/kg to 0.50g/kg for cost savings in future studies, at least at 7T. However, the variability at 0.25g/kg calls for further investigation with a larger subject group.Acknowledgements
We gratefully acknowledge funding of NWO-VENI 18144-WiegersReferences
1. de Feyter, H. M., Behar, K. L., Corbin, Z. A., Fulbright, R. K., Brown, P. B., McIntyre, S., Nixon, T. W., Rothman, D. L., & de Graaf, R. A. (2018). Deuterium metabolic imaging (DMI) for MRI-based 3D mapping of metabolism in vivo. Science Advances, 4(8), 7314–7336.
2.Dienel,G.A.,2012. Fueling and imaging brain activation. ASN Neuro 4AN20120021. Gasparovic,C., Song,T., Devier,D.,etal., 2006. Use of tissue water as a concentration reference for proton spectroscopic imaging. Magn.Reson.Med.55,1219–1226
3. Kaggie JD, Khan AS, Matys T, et al. Deuterium metabolic imaging and hyperpolarized13C-MRI of the normal human brain atclinical field strength reveals differential cerebral metabolism. Neuroimage. 2022;257:119284.
4. Loreen Ruhm, Nikolai Avdievich, Theresia Ziegs,mArmin M. Nagel,Henk M. De Feyter, Robin A. de Graaf and Anke Henninga. Deuterium metabolic imaging in the human brain at 9.4 Tesla with high spatial and temporal resolution. Neuroimage. 2021 Dec 1; 244: 118639.
5. de Graaf RA, Hendriks AD, Klomp DWJ, Kumaragamage C, Welting D, Arteaga de Castro CS, Brown PB, McIntyre S, Nixon TW, Prompers JJ, De Feyter HM. On the magnetic field dependence of deuterium metabolic imaging. NMR Biomed. 2020 Mar;33(3):e4235. doi: 10.1002/nbm.4235. Epub 2019 Dec 26. PMID: 31879985; PMCID: PMC7141779.
6. De Feyter HM, de Graaf RA. Deuterium metabolic imaging -Back to the future. JMagnReson. 2021;326:106932.
7. Serés Roig E, De Feyter H, Nixon T,Ruhm L, Nikulin A, Scheffler K, Avdievich N, Henning A, de Graaf R. Deuterium metabolic imaging of the human brain in vivo at 7 T. Magn Reson Med. 2023;89:29–39
8. Niess F, Hinger l L, Strasser B, Bednarik P, Goranovic D, Niess E, Hangel G, Krššák M, Spurny-Dworak B, Scherer T, Lanzenberger R, Bogner W. Noninvasive 3-Dimensional 1H-Magnetic Resonance Spectroscopic Imaging of Human Brain Glucose and Neurotransmitter Metabolism Using Deuterium Labeling at 3T. Investigative Radiology (2023), 431-437, 58(6)
9. Ayhan Gursan, Mark Gosselink, Dimitri Welting, Martijn Froeling, Hans Hoogduin, Evita Wiegers, Dennis W.J. Klomp, and Jeanine J. Prompers. Development of a double tuned 2H/31P whole-body birdcage transmit coil for 2H and 31P MR applications from head to toe at 7T. Proceedings of the Joint ISMRM-ESMRMB 32st Annual Meeting
10. Vanhamme L, Van Den Boogaart A, Van Huffel S. Improved Method for Accurate and Efficient Quantification of MRS Data with Use of Prior Knowledge. J Magn Reson. 1997;129(1):35-43. doi:10.1006/jmre.1997.1244
11. Robin A de Graaf, Monique A Thomas, Kevin L Behar, Henk M De Feyter. Characterization of Kinetic Isotope Effects and Label Loss in Deuterium-Based Isotopic Labeling Studies. ACS Chem Neurosci. 2021 Jan 6;12(1):234-243. Epub 2020 Dec 15.
12. Penny, W. , Friston, K. , Ashburner, J. , et al. , 2006. Statistical Parameter Mapping: The Analysis of Functional Brain Images, 1st Edition Academic Press .
13. Froeling, M., Prompers, J. J., Klomp, D. W., & van der Velden, T. A. (2021). PCA denoising and Wiener deconvolution of 31P 3D CSI data to enhance effective SNR and improve point spread function. Magnetic resonance in medicine, 85(6), 2992-3009.
14. Macallan, D., Asquith, B., Zhang, Y. et al. Measurement of proliferation and disappearance of rapid turnover cell populations in human studies using deuterium-labeled glucose. Nat Protoc 4, 1313–1327 (2009). https://doi.org/10.1038/nprot.2009.117.
15. V. Sauvinet, L. Gabert, Du Qin, C. Louche-Pelissier et al. Validation of pentaacetylaldonitrile derivative for dual 2H gas chromatography/mass spectrometry and 13 C gas chromatography/combustion/isotope ratio mass spectrometry analysis of glucose
16. H. Reinauer, F.A. Gries, A. Hübinger e al. Determination of glucose turnover and glucose oxidation rates in man with stable istope tracers. J. Clin. Chem. . Clin. Biochem. 1990 (28) 505-511 (LitStil nr. 216). 17. Gruetter R, Ugurbil K, Seaquist ER. Steady-state cerebral glucose concentrations and transport in the human brain. J Neurochem 1998;70:397–408
Figures