5075
Diffusion-relaxation correlation spectroscopic imaging for evaluating change of white matter of X‑linked adrenoleukodystrophy1Army Medical University (Third Military Medical University), Chongqing, China, 2United Imaging Research Institute of Intelligent Imaging, Beijing, China, 3United Imaging Healthcare Group, Shanghai, China
Synopsis
Keywords: Diffusion Analysis & Visualization, Diffusion/other diffusion imaging techniques
Motivation: Diffusion-relaxation correlation spectroscopic imaging (DR-CSI) may be a useful tool for advancing our understanding of X-linked adrenoleukodystrophy (ALD) and its impact on white matter.
Goal(s): To measure the changes in white matter composition and microenvironment in ALD patients using DR-CSI.
Approach: Recruited four groups of participants. DR-CSI was utilized with a multi-parametric approach, considering both diffusion and relaxation properties to provide a comprehensive view of the tissue microenvironment. Data analysis was performed to quantify changes in white matter composition.
Results: In the context of ALD, DR-CSI can effectively differentiate between the diverse tissue compartments by examining diffusion and relaxation characteristics.
Impact: This is of significant relevance for the diagnosis and treatment strategies of this rare disease. Moreover, the study results offer information regarding differences among ALD phenotypes, which holds potential value for individualized treatment and management development.
INTRODUCTION
X-linked adrenoleukodystrophy (ALD) is a rare genetic disorder that is caused by mutations in the ABCD1 gene. The ABCD1 gene encodes a protein called ALDP, which is located on the peroxisomal membrane and plays a role in the metabolism of very long chain fatty acids (VLCFAs). VLCFAs are toxic to adrenal cortex, oligodendrocytes, and astrocytes. They induce oxidative stress and/or antioxidant defense impairment in oligodendrocytes, which could initiate myelin and axonal damage in ALD(1). Diffusionrelaxation correlation spectrum imaging (DR-CSI) resolves the effect of both diffusion and T2 relaxation on signal changes simultaneously. In DR-CSI, spectral information about tissue microenvironment becomes available(2). Spectral information from DR-CSI might have association with the change of white matter in components during the progression of ALD. Against this background, the purpose of this study was to evaluate the change of white matter of ALD by DR-CSI.METHODS
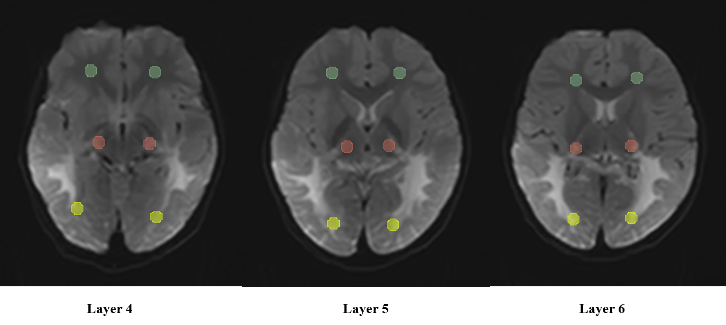
A total of 8 participants with 4 groups including health control(HC), Cerebral ALD(CALD), AMN, and Carrier (each group has 2 participants) were enrolled in this study. Examinations of all participants were performed on a 3.0 Tesla MRI scanner (uMR 780; United Imaging Healthcare, Shanghai, China) using a 32-channel Head coil. The DR-CSI was acquired using an axial singleshot spin-echo echo-planar-imaging (SE-EPI)-based DWI sequence, with 36 acquisitions of six different TEs (85, 100, 115, 130, 145 msec) combined with six b-values (0, 100, 200, 400, 800,1200,1500 sec/mm2). The subscripts denote the number of averages. Other DR-CSI protocol parameters were as follows: TR = 2100 msec, FOV = 240*240 mm, slice number = 11, slice thickness = 4.5 mm, slice gap = 1.4 mm, matrix = 128 *128. Imaging by DR-CSI is basically a two-dimensional correlation MRI method, simultaneously considering the signal attenuation caused by both the diffusion and the relaxation time of multiple components. For quantitative analysis, the spectra were segmented into three compartments, labeled by A (higher diffusivity, shorter T2), B (higher diffusivity, longer T2), and C (lower diffusivity). Boundaries of different compartments were decided case-by-case according to the principle that each compartment separately contain the three main peaks observed from spectral observations. The DR-CSI compartment volume fractions Vi (i = A, B, C) were calculated for each voxel by spectral integration, and then averaged for each patient. The ROIs were manually delineated on axial DWI with a short TE (50 msec), and were chosen to include the anterior, medial, posterior of white matter (Figure 1).RESULTS
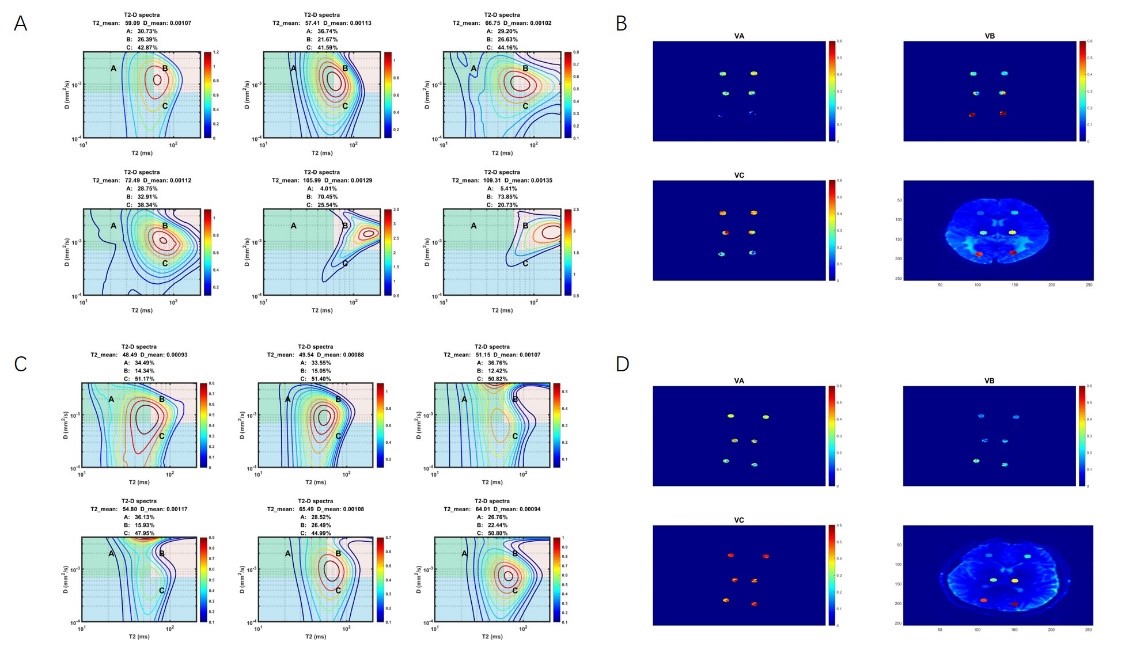
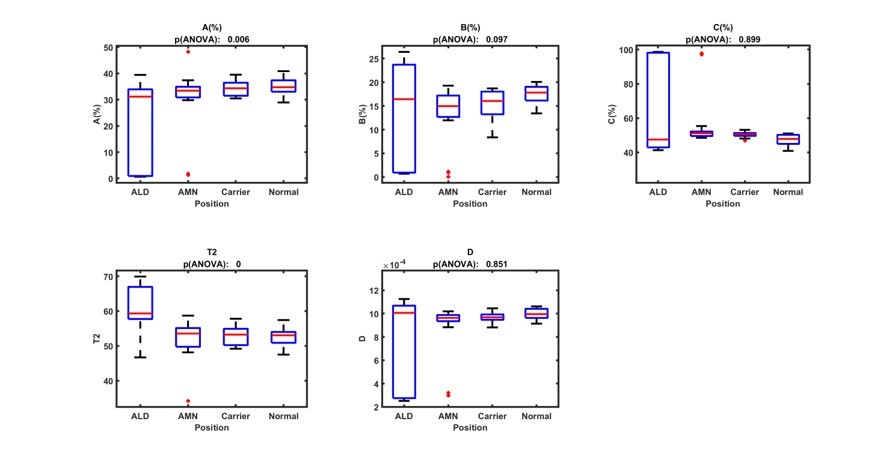
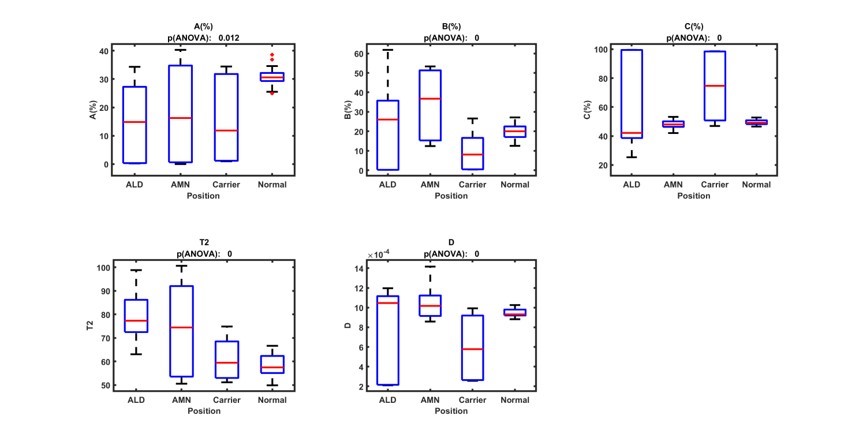
This study evaluated white matter change in ALD patients by DR-CSI in terms of microenvironment analysis (Figure 2). Specifically, characteristic peaks have been observed (Figure 2), and difference have been found between DR-CSI-derived volume fractions of compartments A and B in the different area (Figure 2). Statistical analysis results show in anterior white matter (Figure 3), the HC group has highest fA compare to other group. In medial white matter (Figure 4), the HC group also has highest fA compare to other group, carrier group achevie highest fC and AMN group achevie highest fB. In posterior white matter (Figure 5), the HC group also has highest fA compare to other group, and AMN group achevie highest fB.Discusion
The phenotypes of ALD are heterogeneous, exhibiting a variety of cerebral imaging changes(3). Changes in brain areas of different types of participants can be demonstrated by changes in f for each tissue compartment in voxels.In this experiment, the HC group has highest fA in anterior , medial , and posterior white matter , indicating a predominance of compartment with higher ADC and shorter T2 in frontal lobe , splenium of the corpus callosum and occipital Lobe. AMN group achevies higher ADC and longer T2 in splenium of the corpus callosum and occipital Lobe. carrier group achevies lower ADC in splenium of the corpus callosum.CONCLUSION
Our findings may illustrate the potential of applying an invivo DR-CSI method for the evaluation changes of white matter of ALD. Specifically, DR-CSI could differentiate signal contributions from diverse compartments with different diffusion and relaxation properties.Acknowledgements
The authors thank the patients for participating in this study.References
1. Kemp S, Berger J, Aubourg P. X-linked adrenoleukodystrophy: clinical, metabolic, genetic and pathophysiological aspects. Biochim Biophys Acta 2012;1822(9):1465-1474. doi: 10.1016/j.bbadis.2012.03.012
2. Zhang Z, Wu HH, Priester A, Magyar C, Afshari Mirak S, Shakeri S, Mohammadian Bajgiran A, Hosseiny M, Azadikhah A, Sung K, Reiter RE, Sisk AE, Raman S, Enzmann DR. Prostate Microstructure in Prostate Cancer Using 3-T MRI with Diffusion-Relaxation Correlation Spectrum Imaging: Validation with Whole-Mount Digital Histopathology. Radiology 2020;296(2):348-355. doi: 10.1148/radiol.2020192330
3. Mao C, Li J, Huang X, Wang J, Chu S, Zhang Y, Dong L, Liu C, Lu L, Qiu L, Chen W, Peng B, Cui L, Gao J. Typical and atypical phenotype and neuroimaging of X-linked adrenoleukodystrophy in a Chinese cohort. Neurol Sci 2022;43(5):3255-3263. doi: 10.1007/s10072-021-05859-y
Figures