5071
Repeatability of MRI cytometry of the liver on clinical 3T scanners1Vanderbilt University Medical Center, Nashville, TN, United States, 2Vanderbilt University Medical Center, nashville, TN, United States
Synopsis
Keywords: Microstructure, Diffusion/other diffusion imaging techniques
Motivation: Noninvasive measurement of liver cell sizes and densities is clinically important.
Goal(s): Assess the repeatability of liver cell size and density mapping using MRI cytometry, a diffusion MRI-based imaging technique.
Approach: In vivo MRI cytometry was repeated twice with intervals of 2-7 days for six healthy subjects.
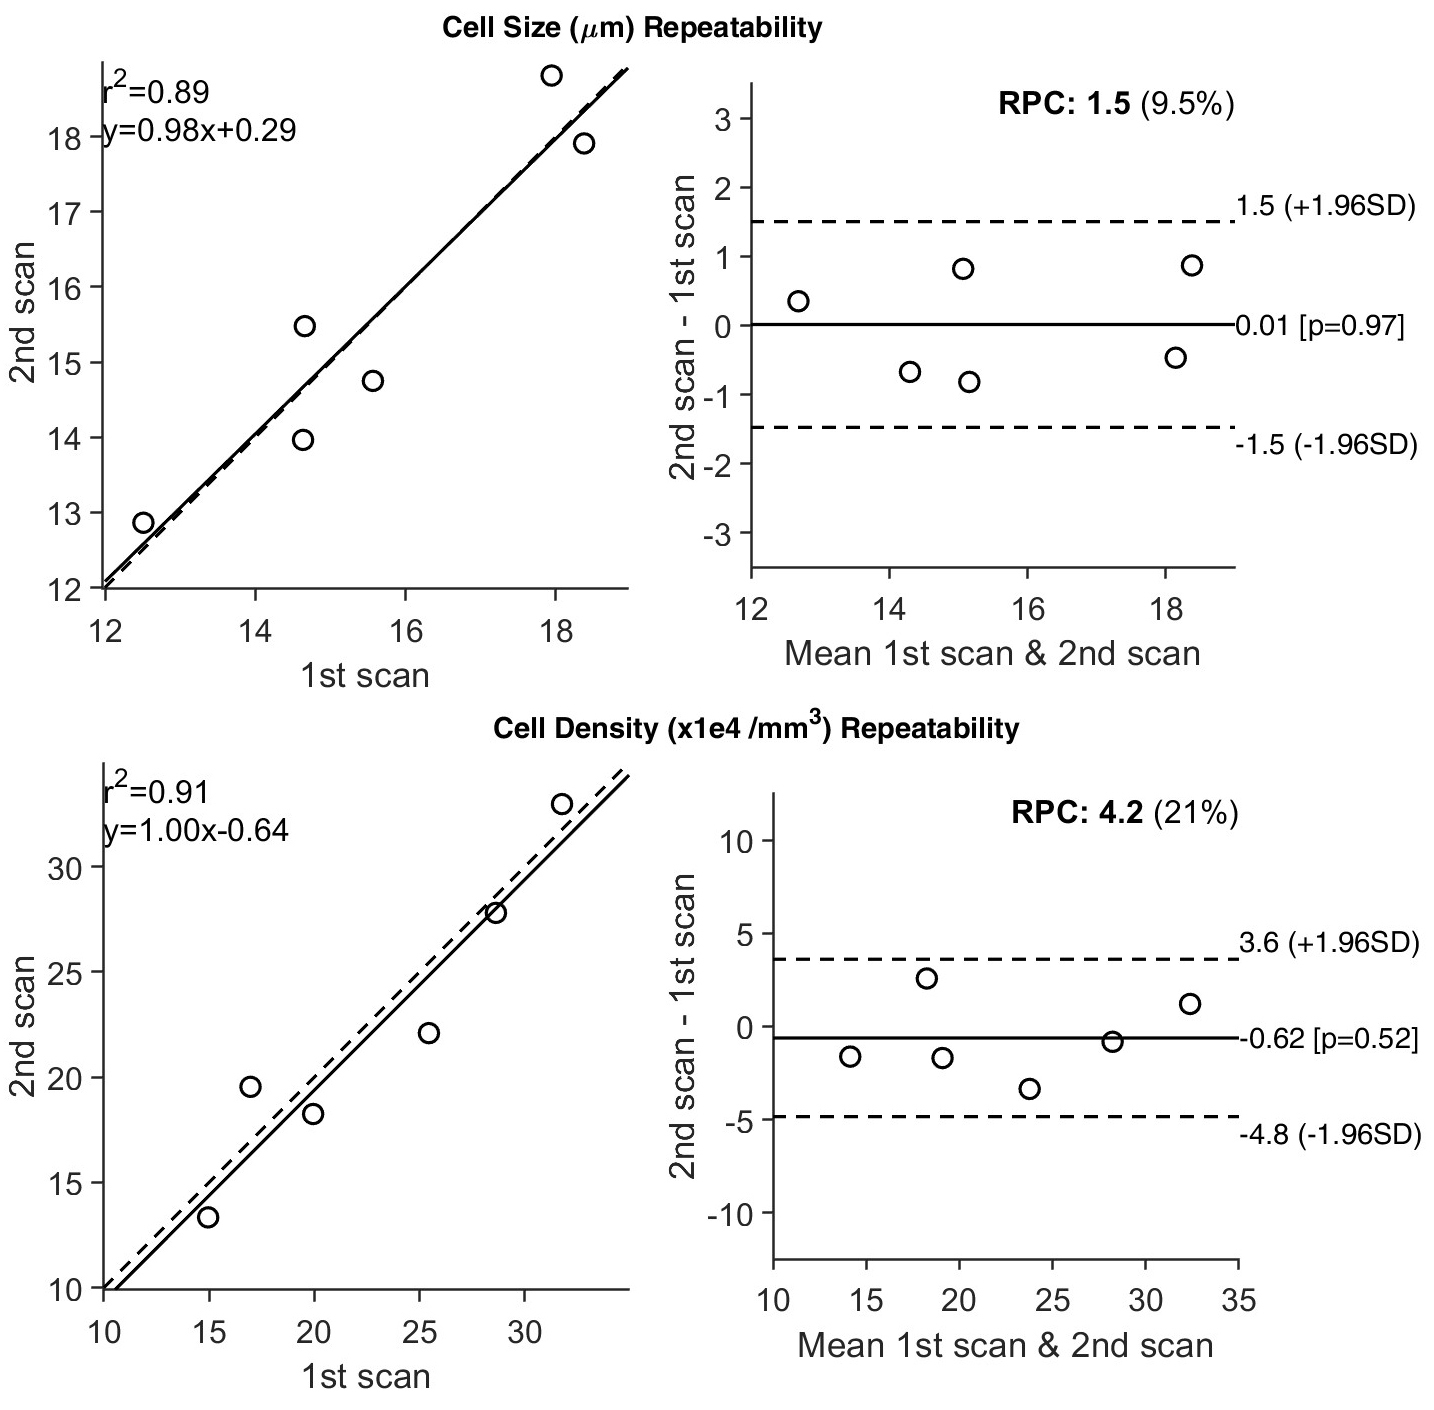
Results: MRI-derived liver cell size and density exhibited high repeatability, with significant correlations (r2 = 0.89 and 0.91 for cell size and cell density, respectively; [P< 0.0001]).
Impact: Our findings indicate that a liver MRI cytometry protocol can be implemented on standard clinical 3T scanners with satisfactory repeatability in under 12 minutes, thus affirming the potential for broader clinical adoption in the future.
Introduction
Liver biopsy remains the standard method for evaluating the etiology and extent of diseases of the liver. Although liver biopsy is generally safe, sampling errors, rare complications, intra/inter-observer variability, and significant patient anxiety, may all occur in practice [1]. These factors have led to keen interest in the development of non-invasive tests and imaging techniques for the diagnosis and management of liver diseases. The cell size and cell density, particularly their variations over time, are fundamental characteristics of liver, and measurements of cell sizes and densities provide diagnostic biomarkers of several normal and pathological processes. Measurements of cell sizes and densities thus have high clinical significance but currently can be obtained only by liver biopsy. Our laboratory has developed MRI cytometry, a diffusion MRI-based imaging technique that extracts microstructural parameters, such as mean cell size and cell density, from measuremnts of hindered/restricted diffusions in solid tissues[2]. We hypothesize that MRI cytometry can characterize pathological changes in the microstructure of the human liver, potentially reducing the need for liver biopsy. Previous research has demonstrated the feasibility of MRI cytometry on clinical 3T scanners using a clinically attainable protocol called IMPULSED (Imaging Microstructural Parameters Using Limited Spectrally Edited Diffusion) [3]. This study extends this concept by evaluating the repeatability of MRI-derived cell sizes and cell densities in healthy human subjects.Methods
Theory: MRI cytometry integrates measurements of water diffusion rates over various time scales, corresponding to probing cellular microstructures at different distances. The size range of utmost relevance in liver tissues is 5 µm to 25 µm (e.g., hepatocytes ~ 15 – 25 µm, inflammatory cells ~ 5 – 10 µm), which corresponds to diffusion times of approximately 5 - 70 ms. These diffusion times can be achieved using a combination of OGSE (oscillating gradient spin echo) and PGSE (pulsed gradient spin echo) measurements. Microstructural properties are extracted by fitting multi-b value-multi-diffusion time fat-suppressed diffusion-weighted MRI signals to a three-compartment model (blood, intra and extracellular water).In vivo human imaging: MRI cytometry was repeated twice at 2-7 days apart for six healthy subjects using a Philips Ingenia CX 3T scanner with a dStream TorsoCardiac coil. A PGSE sequence with diffusion gradient duration δ / diffusion gradient separation Δ = 12/74 ms was used to collect diffusion data at a long diffusion time (70 ms). Shorter diffusion times were achieved using a cosine-modulated trapezoidal OGSE sequence with gradient frequencies of 25 and 50 Hz. Five b values (0, 250, 500, 750, and 1000 s/mm2) were used for PGSE and 25 Hz OGSE acquisitions. For 50 Hz OGSE acquisitions, four b values (0, 100, 200, and 300 s/mm2) were used. Other imaging parameters were TR/TE=2000/110ms; FOV=192×192mm; in-plane resolution = 4×4 mm; 5 slices; slice thickness=10 mm; respiratory-gated, single shot EPI; SENSE factor=2; fat suppression with SPAIR. The total scan time ≈ 12 mins. The SNRs of b0 images are about 20. High resolution (0.75 x 0.75 x 5 mm3) T1W images covering the whole liver were collected for registration of MRI-derived microstructural maps obtained at two different time points for the same subject.
Statistics: Repeatability statistics follow the methods previously described by Bland and Altman [4]. Kendall’s tau test was performed to test whether the magnitude of the differences between the first and second measurements was correlated with the parameter mean of the repeated measurements. The Wilcoxon signed-rank test was used to test the null hypothesis of no bias (ie, median difference is zero) between the first and second measurements, with the Spearman correlation testing the effectiveness of the pairing. The repeatability of each MRI metric (ie, cell size and cell density) was assessed. Additionally, the 95% confidence interval (CI), the root-mean-squared deviation, the within-subject standard deviation, and the repeatability coefficient (RPC) were calculated for each MRI metric. This repeatability coefficient defines the magnitude of the maximum difference (absolute value) between repeated observations expected in 95% of paired observations.
Results and discussion
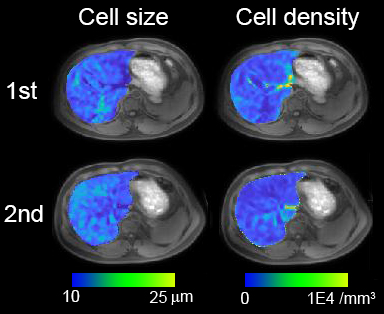
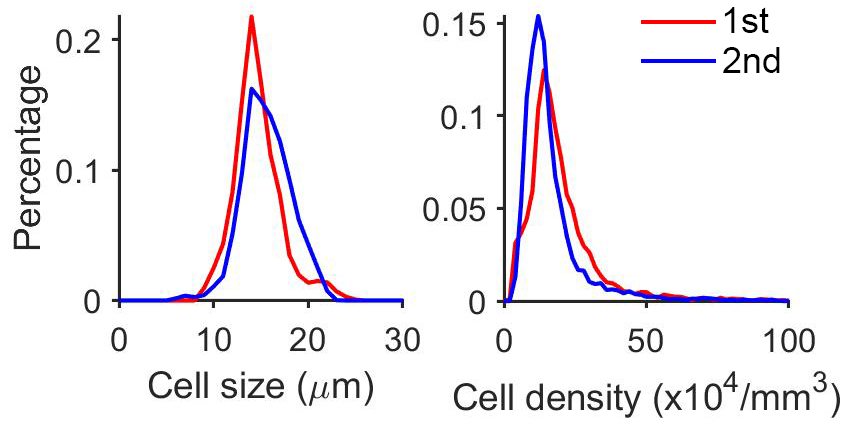
Repeatability scans of the same subject’s liver tissue showed an average percent difference of 0.06% and 3% in cell size and cell density, respectively, between the two scans. Repeatability of MRI-derived cell size and cell density in the liver was not significantly different with the pairing significantly correlated (r2 = 0.89 and 0.91 for cell size and cell density, respectively; [P< 0.0001]). Additionally, the difference between repeated measurements was independent of the mean.Conclusion
Our findings demonstrate the feasibility of implementing a liver MRI cytometry protocol on standard clinical 3T scanners with satisfactory repeatability in under 12 minutes, affirming its potential for wider clinical adoption in the future.Acknowledgements
No acknowledgement found.References
1. Tobkes, A.I. and H.J. Nord, Liver biopsy: review of methodology and complications. Dig Dis, 1995. 13(5): p. 267-74.
2. Jiang, X., et al., MR cell size imaging with temporal diffusion spectroscopy. Magn Reson Imaging, 2021. 77: p. 109-123.
3. Jiang, X., J. Xu, and J.C. Gore, Mapping hepatocyte size in vivo using temporal diffusion spectroscopy MRI. Magn Reson Med, 2020.
4. Bland, J.M. and D.G. Altman, Measuring agreement in method comparison studies. Stat Methods Med Res, 1999. 8(2): p. 135-60.
Figures