5069
The Fuzzy MAD Glioma Conjecture, using Fuzzy C Means to classify Multimodal Apparent Diffusion for glioma stratification1Radiology, University of Illinois at Chicago, Chicago, IL, United States, 2State Key Laboratory of Oncology in South China; Collaborative Innovation Center for Cancer Medicine, State Key Laboratory of Oncology in South China; Collaborative Innovation Center for Cancer Medicine, Guangzhou, Guangdong, China, 3Department of Radiology, USC Keck School of Medicine, Los Angeles, CA, United States, 4Radiology, Fujian Medical University Union Hospital, Fuzhou, Fujian, China
Synopsis
Keywords: Microstructure, Brain
Motivation: Gliomas are a very heterogeneous primary brain tumor. Their heterogeneity lies not only at the microscopic (genetic / biochemical) level, but at the mesoscopic (cellular morphology) level and macroscopic (tissue pathology) level.
Goal(s): To better understand the underpinnings of the glioma heterogeneity.
Approach: We applied the Multimodal Apparent Diffusion (MAD) method and Fuzzy C Means to multi b‑value diffusion weighted magnetic resonance imaging, up to b‑value of 10K s/mm2, on 54 glioma patients.
Results: We discerned 15 normal appearing tissue types and 19 lesion types, including 3 voracious solid tumor, 5 recruiting solid tumor, 3 edema, and 7 b0 attenuated types.
Impact: Each stage in the glioma’s progression manifests in unique changes in MAD parameter signatures. The ability to to more precisely understand the heterogeneous microstructure involved can be used to improved diagnosis and prognosis of gliomas.
INTRODUCTION
Gliomas are a very heterogeneous primary brain tumor. Their heterogeneity lies not only at the microscopic (genetic / biochemical) level, but at the mesoscopic (cellular morphology – viz WHO grades) level and macroscopic (tissue pathology – viz imaging) level. The heterogeneity of lesions and limitations in common imaging techniques has hindered the ability to fully understand glioma tumor progression. To better understand the underpinnings of the glioma tumors in vivo, we applied the Multimodal Apparent Diffusion (MAD) method[1] to multi b‑value DWI, up to a b‑value of 10K s/mm2, on 54 glioma patients. Using the Fuzzy C Means clustering technique, we were able to discern 15 normal appearing tissue (NAT) types and 19 glioma lesion types.METHODS
This study was performed with IRB approval. Multi b-value diffusion weighted images of pretreatment glioma patients (n=54, 22m/32f, 3-61 or 45±14 yo, WHO grades 0/I, 22/II, 7/III, 19/IV, 6/?) were acquired using 9 b‑values (0-10,000 s/mm2) over 4.5 minutes. The acquired diffusion data was processed using the Multimodal Apparent Diffusion (MAD) analysis method[1], briefly, the analysis results in flow (F, >>3 μm2/ms), and, unimpeded (UI, ~3 μm2/ms) – viz fluid, hindered (H, 0.2-3 μm2/ms) – viz extracellular, and restricted (R, <0.2 μm2/ms) - viz intracellular, diffusion modes. Due to the limited number of b‑values collected, the rate of flow was not reliable, and not used furtherFuzzy C Means clustering takes a collection of voxels, with N MAD parameters, including b0, and determines each voxel’s memberships in M clusters, e.g., tissue/lesion types. A cluster’s N parameters are a best estimate of the MAD parameters for a theoretical homogeneous voxel of the cluster’s tissue/lesion type. The Fuzzy C Means method can be run iteratively to determine the most unique and precise set of clusters for a dataset, or using a predetermined set of clusters to analyze commonality among a population of datasets.
RESULTS
Compared to normally appearing tissue (NAT), the MAD parameters within glioma lesions, as depicted in figures 1 and 3, shows noticeable increase of flow/fluid, an increase in hindered diffusion (both fH and DH) – albeit a decease in the b0 attenuated lesion, an increase in spatial heterogeneity of parameters, and the general reduction of restricted diffusion (fR) and the dichotomy of restricted diffusion coefficient (DR) between increased and decreased apparent diffusivity.The Fuzzy C Means clustering identified 15 types of NAT (4 GM, 4 WM, 4 flow, 2 fluid), and 19 types of glioma lesions. The majority NAT is loosely explained by extracellular space (fH ~70%) with an apparent diffusivity DH of about of 0.9 μm2/ms with a sizable amount (fR ~15%) of intracellular space with apparent diffusivity DR between about of 0.06 and 0.18 μm2/ms, where WM < GM, including noticeable amounts of fluid (fUR ~5%) and flow (fF ~5%). Eight cluster types of lesions are prevalent among most patient’s lesions.
Case 1 (figure 1/figure 2/figure 5) – 39 yo male, with a left frontotemporal oligoastrocytoma, WHO grade II, exhibited by a fluid filled center (FLUID1), which is surrounded by voracious solid lesions, (increasing fF – viz blood flow; Tumor1A-C), which is surrounded by recruiting solid lesions, (low blood flow, and decreasing DR – viz intracellular fluid; Tumor2A-E) with sporadic distribution of edema (increasing DH – viz extracellular fluid; Edema1-3). All tumor lesions have elevated DH – viz extracellular fluid, and DUI – viz interstitial fluid. Normal appearing blood vessels, (BV1), do not appear within the tumor, albeit, there are abnormal blood vessel, (BV2), within the solid tumor.
Case 2 (figure 3/figure 4) – 55 yo female, with a right temporal frontoparietal oligoastrocytoma with calcification, WHO grade II – similar to case 1, and another lesion the right posterior temporal lobe within a severely attenuated b0 region. All the b0 attenuated lesions have very tight hindered diffusion (DH ~0.6 μm2/ms) with decreasing ratio of amount of hindered to restricted diffusion (fH:fR), in which Tumor3E is the lowest at (14:85) – where NAT is around (80:20).
DISCUSSION
Each stage in the glioma’s progression manifests in unique changes in the tissue at a cellular level that are reflected in MAD parameter signatures – viz cluster centers / lesion types.CONCLUSION
Using Multimodal Apparent Diffusion and Fuzzy C Means 15 normal tissue and 19 lesions types were classified. Four lesion categories identified, voracious, recruiting, b0 attenuating solid tumor types, and edema. Further investigation, with animal models and clinical studies, will help to validate these conjectures.Acknowledgements
No acknowledgement found.References
[1] Damen FC, Scotti A, Damen FW, Saran N, Valyi-Nagy T, Vukelich M, Cai K. Multimodal apparent diffusion (MAD) weighted magnetic resonance imaging. Magn Reson Imaging. 2021 Apr;77:213-233. doi: 10.1016/j.mri.2020.12.007. Epub 2020 Dec 10. PMID: 33309925; PMCID: PMC7878401.Figures
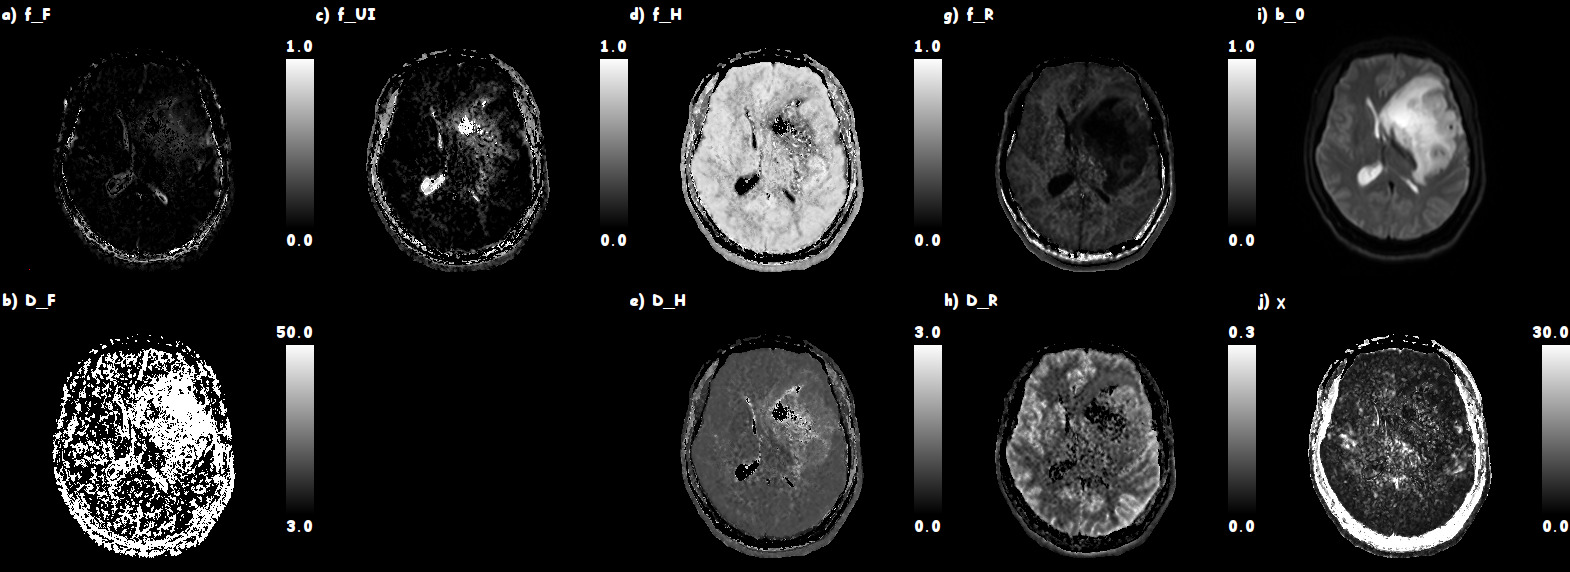
Figure 1: Case 1’s MAD mode maps of a 39 yo male with a left frontotemporal oligoastrocytoma, WHO grade II. Top row are the fraction of the voxel explained by flow (F), and unimpeded (UI), hindered (H), and restricted (R) diffusion, respectively. Second row are the pseudo perfusion and hindered and restricted diffusivities. Last column are the b0 and chi squared fitting error. Note the lack of correlation of fitting error to anatomy or lesion.

Figure 2: Case 1’s cluster membership maps. On each row the first column is the colorized conglomerate of the maps on that row, each individual map is W/L to maximize its contrast with maximum noted. First row are the summary maps of the blood vessels, WM & GM, Fluid & Flow, voracious solid tumor, edema, recruiting solid tumor, and b0 attenuated solid tumors. The subsequent rows are each of the summary maps detailed by their Fuzzy C Means identified maps.
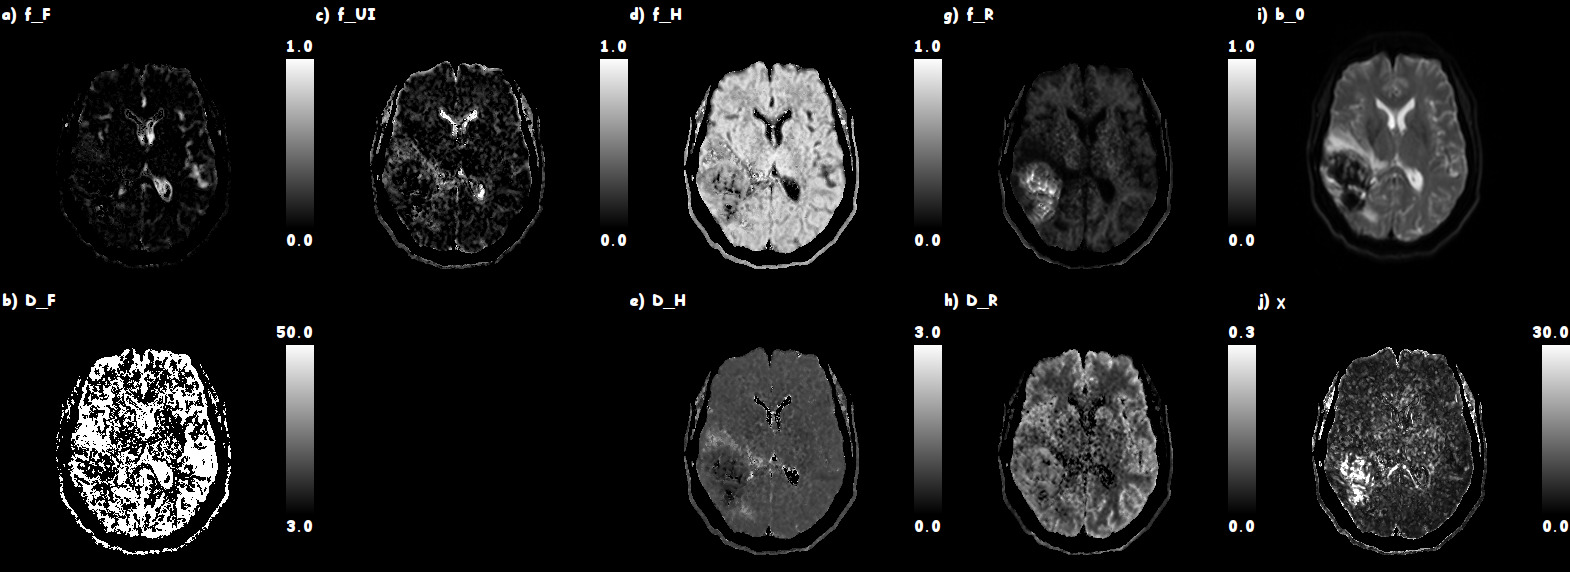
Figure 3: Case 2’s MAD mode maps of a 55 yo female, with a right temporal frontoparietal oligoastrocytoma with calcification, WHO grade II. Top row are the fraction of the voxel explained by flow (F), and unimpeded (UI), hindered (H), and restricted (R) diffusion, respectively. Second row are the pseudo perfusion and hindered and restricted diffusivities. Last column are the b0 and chi squared fitting error. Note the lack of correlation of fitting error to anatomy or lesion.

Figure 4: Case 2’s cluster membership maps. On each row the first column is the colorized conglomerate of the maps on that row, each individual map is W/L to maximize its contrast with maximum noted. First row are the summary maps of the blood vessels, WM & GM, Fluid & Flow, voracious solid tumor, edema, recruiting solid tumor, and b0 attenuated solid tumors. The subsequent rows are each of the summary maps detailed by their Fuzzy C Means identified maps.

Case 1’s Summary of the individual Fuzzy C Means identified cluster maps of the MAD parameters, showing the blood vessels, WM & GM, Fluid & Flow, voracious solid tumor, edema, recruiting solid tumor, and b0 attenuated tumors. The first column is the colorized conglomerate map, followed by each individual summary map that is W/L to maximize its contrast with maximum noted. (39 yo male with a left frontotemporal oligoastrocytoma, WHO grade II)