5066
Potential for white matter microstructure quantification on a clinical 7T system1Department of Radiology, Lausanne University Hospital (CHUV) and University of Lausanne (UNIL), Lausanne, Switzerland
Synopsis
Keywords: Diffusion Modeling, High-Field MRI, Microstructure
Motivation: The potential of dMRI microstructure mapping at 7 Tesla is largely unexplored, due to ultra-high field challenges related to spatial distortions and uneven excitation.
Goal(s): Assessing 7T dMRI for white matter microstructure estimation at 7T and examining the impact of acquisition protocol on model estimates.
Approach: Standard Model parameter maps were derived from two acquisition protocols (bmax=3 vs bmax=13 $$$ms/\mu m^2$$$), to further investigate the relationship between parameter estimates both at ROI and voxel level.
Results: We report high contrast-to-noise ratio microstructure maps. Our results highlight stronger region-wise and voxel-wise correlations between SM parameters in the higher b-value protocol.
Impact: The diffusion microstructure field can greatly benefit from clinically-approved high-field systems with strong gradients, with flexibility to balance SNR, spatial resolution, and q-t sampling.
Introduction
Diffusion MRI (dMRI) serves as a powerful non-invasive tool for investigating tissue microstructure at a micrometer scale. The advent of clinical ultra-high field systems with powerful gradients could be beneficial to microstructure mapping thanks to a higher signal-to-noise ratio (SNR) and flexible diffusion encoding. However, dMRI at 7T has yet to show its potential over challenges of spatial distortions and inhomogeneous excitation. Here, we evaluate the feasibility of white matter (WM) microstructure quantification at 7T, and investigate the impact of acquisition protocol on model parameter estimates.Methods
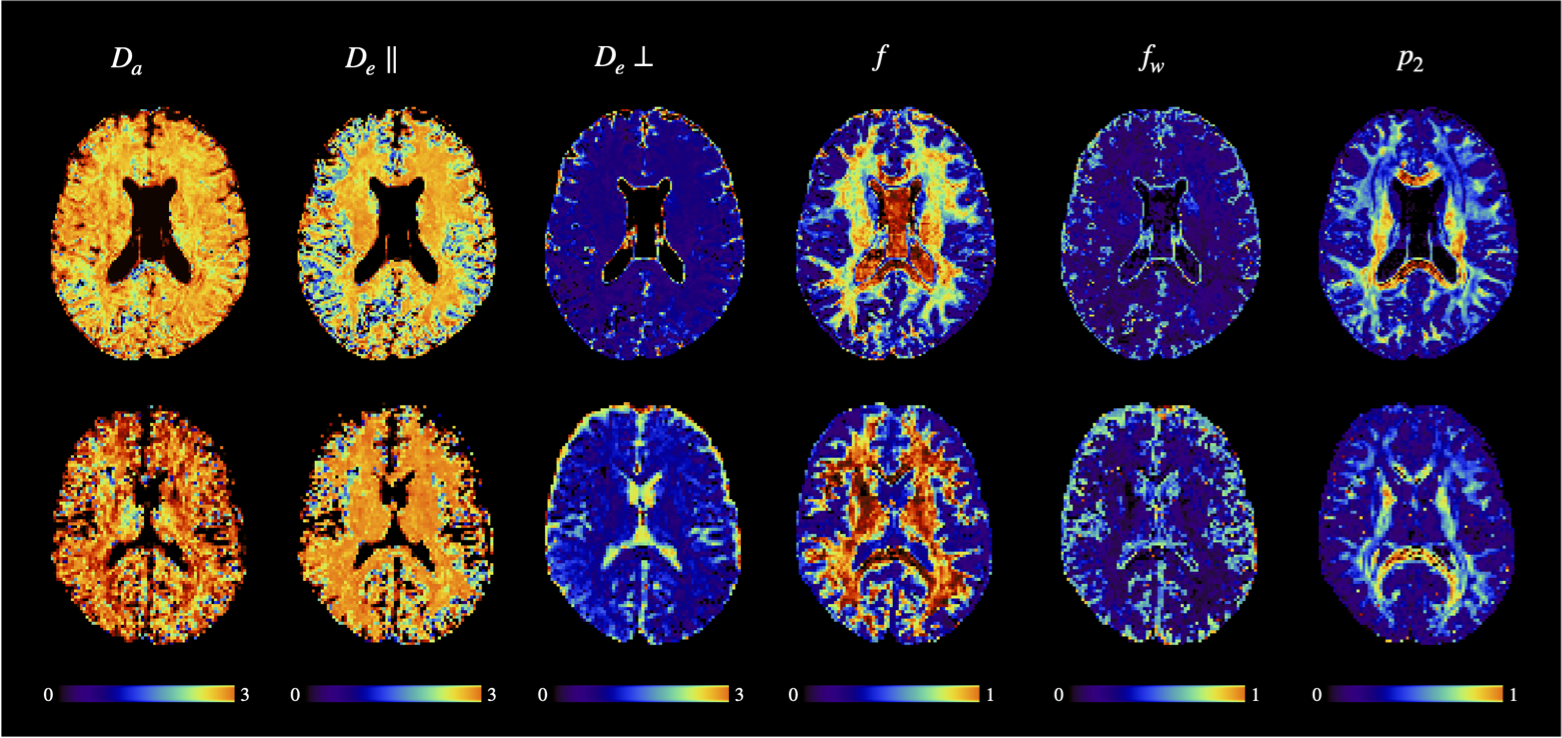
Two healthy volunteers underwent a brain scan on a clinical 7T MRI system equipped with 120 mT/m gradients (MAGNETOM Terra.X, Siemens Healthcare, Erlangen, Germany). Diffusion-weighted images (DWI) were acquired using a PGSE-EPI sequence, with parameters as follows: scan 1: b-value [$$$ms/\mu m^2$$$](dir)=0(4), 1(20), 2(40), 3(60), TE=78 ms, 1.5-mm isotropic resolution; scan 2: b-value [$$$ms/\mu m^2$$$](dir)=0(6), 1(12), 2.5(30), 6(60), 13(90), TE=115 ms, 2-mm isotropic resolution. DWI were pre-processed using the following pipeline: MP-PCA denoising1, Gibbs ringing correction2,3, susceptibility and Eddy current distortion correction4.WM microstructure parameters were estimated using the Standard Model (SM) framework5,6. Using all available data in each case, intra-axonal diffusivity ($$$D_a$$$), parallel and perpendicular extra-axonal diffusivities ($$$D_e\parallel, D_e\bot$$$), axonal water fraction ($$$f$$$), free water fraction ($$$f_w$$$), and fiber alignment ($$$p_2$$$) were computed for both scans6 (Fig. 1). FA maps were computed after fitting the diffusion tensor. The JHU atlas FA map was registered to the native FA map using non-linear registration in ANTs7 and the 48 JHU WM regions of interest (ROIs) were projected into native diffusion space. Mean parameter values for the two subjects were calculated in each ROI. Parameter estimates were compared between protocols to test the impact of acquisition parameters (mainly b-value range and TE). Furthermore, the relationship between model parameters within each protocol was assessed using Pearson's correlation. This analysis was performed both region-wise across WM and voxel-wise within the internal capsule (IC).
Results
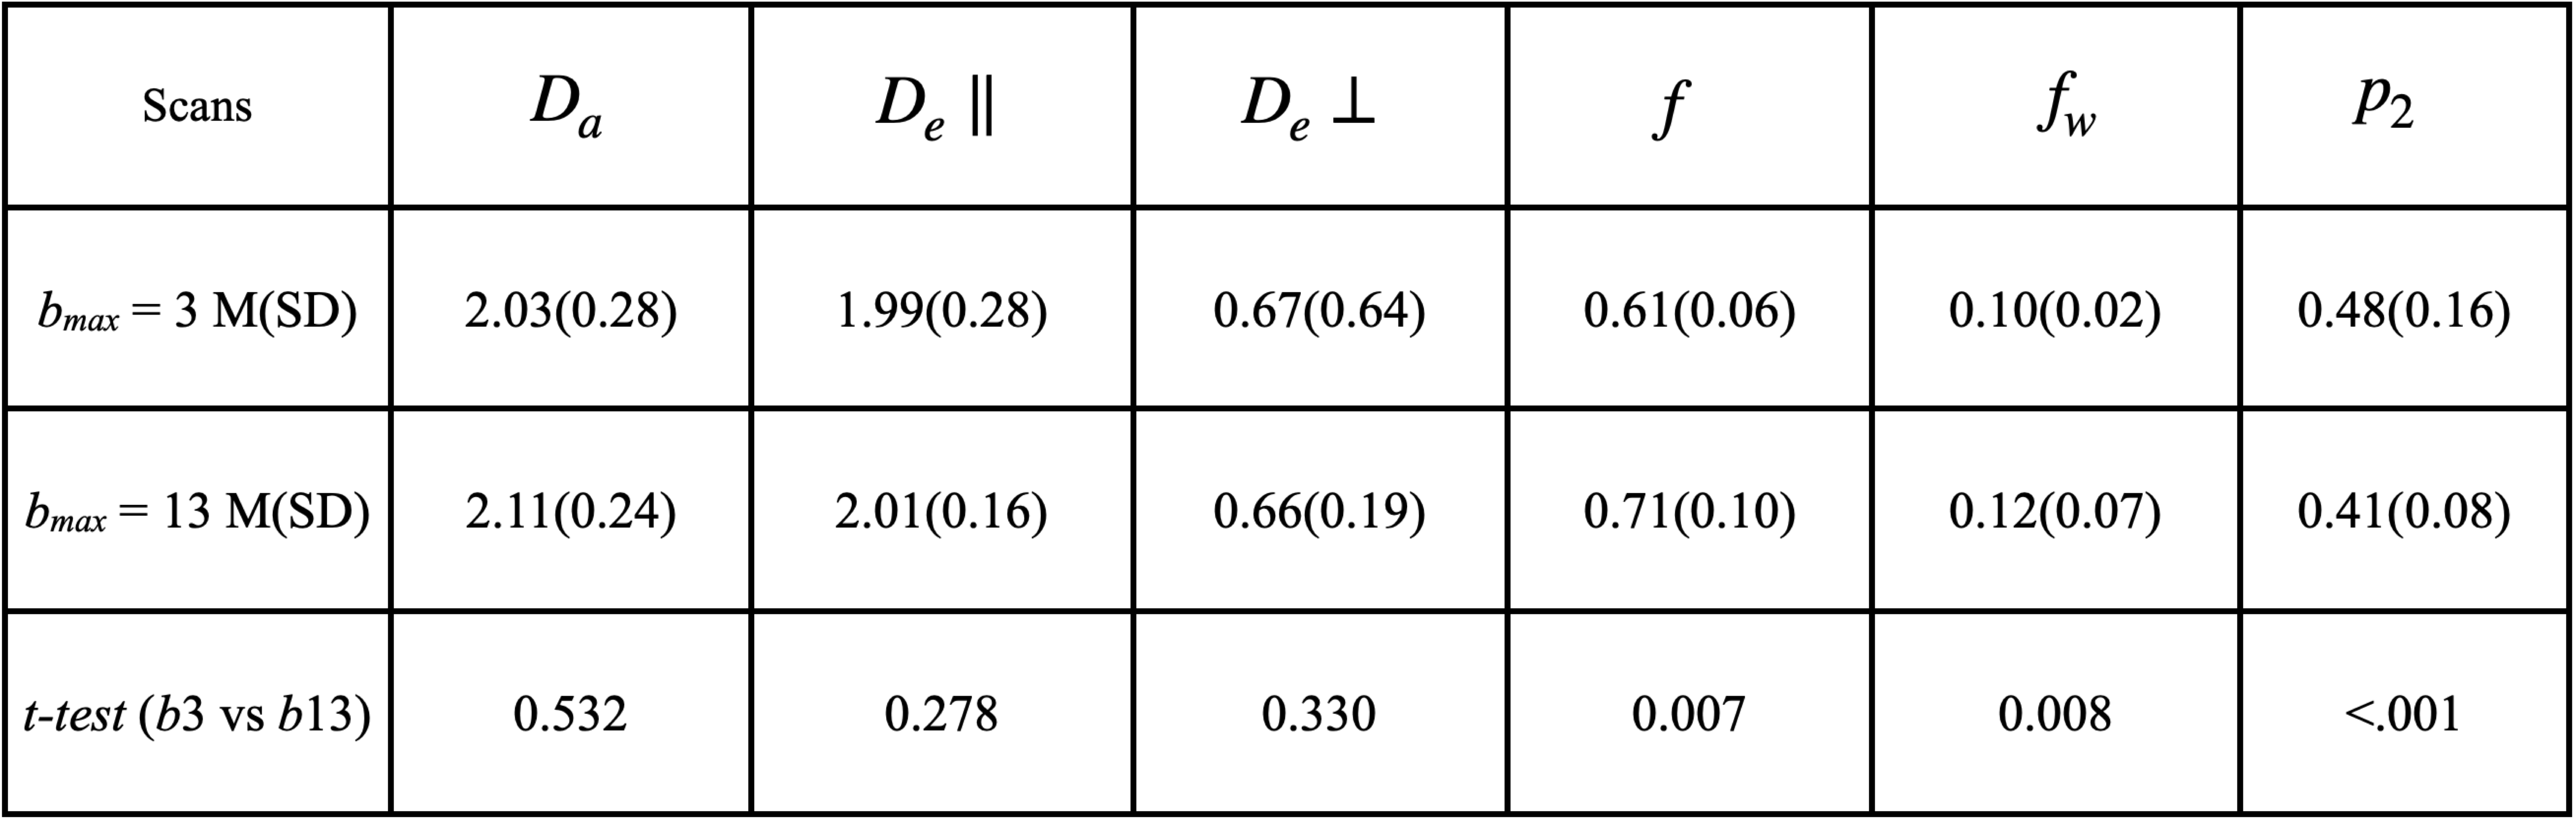
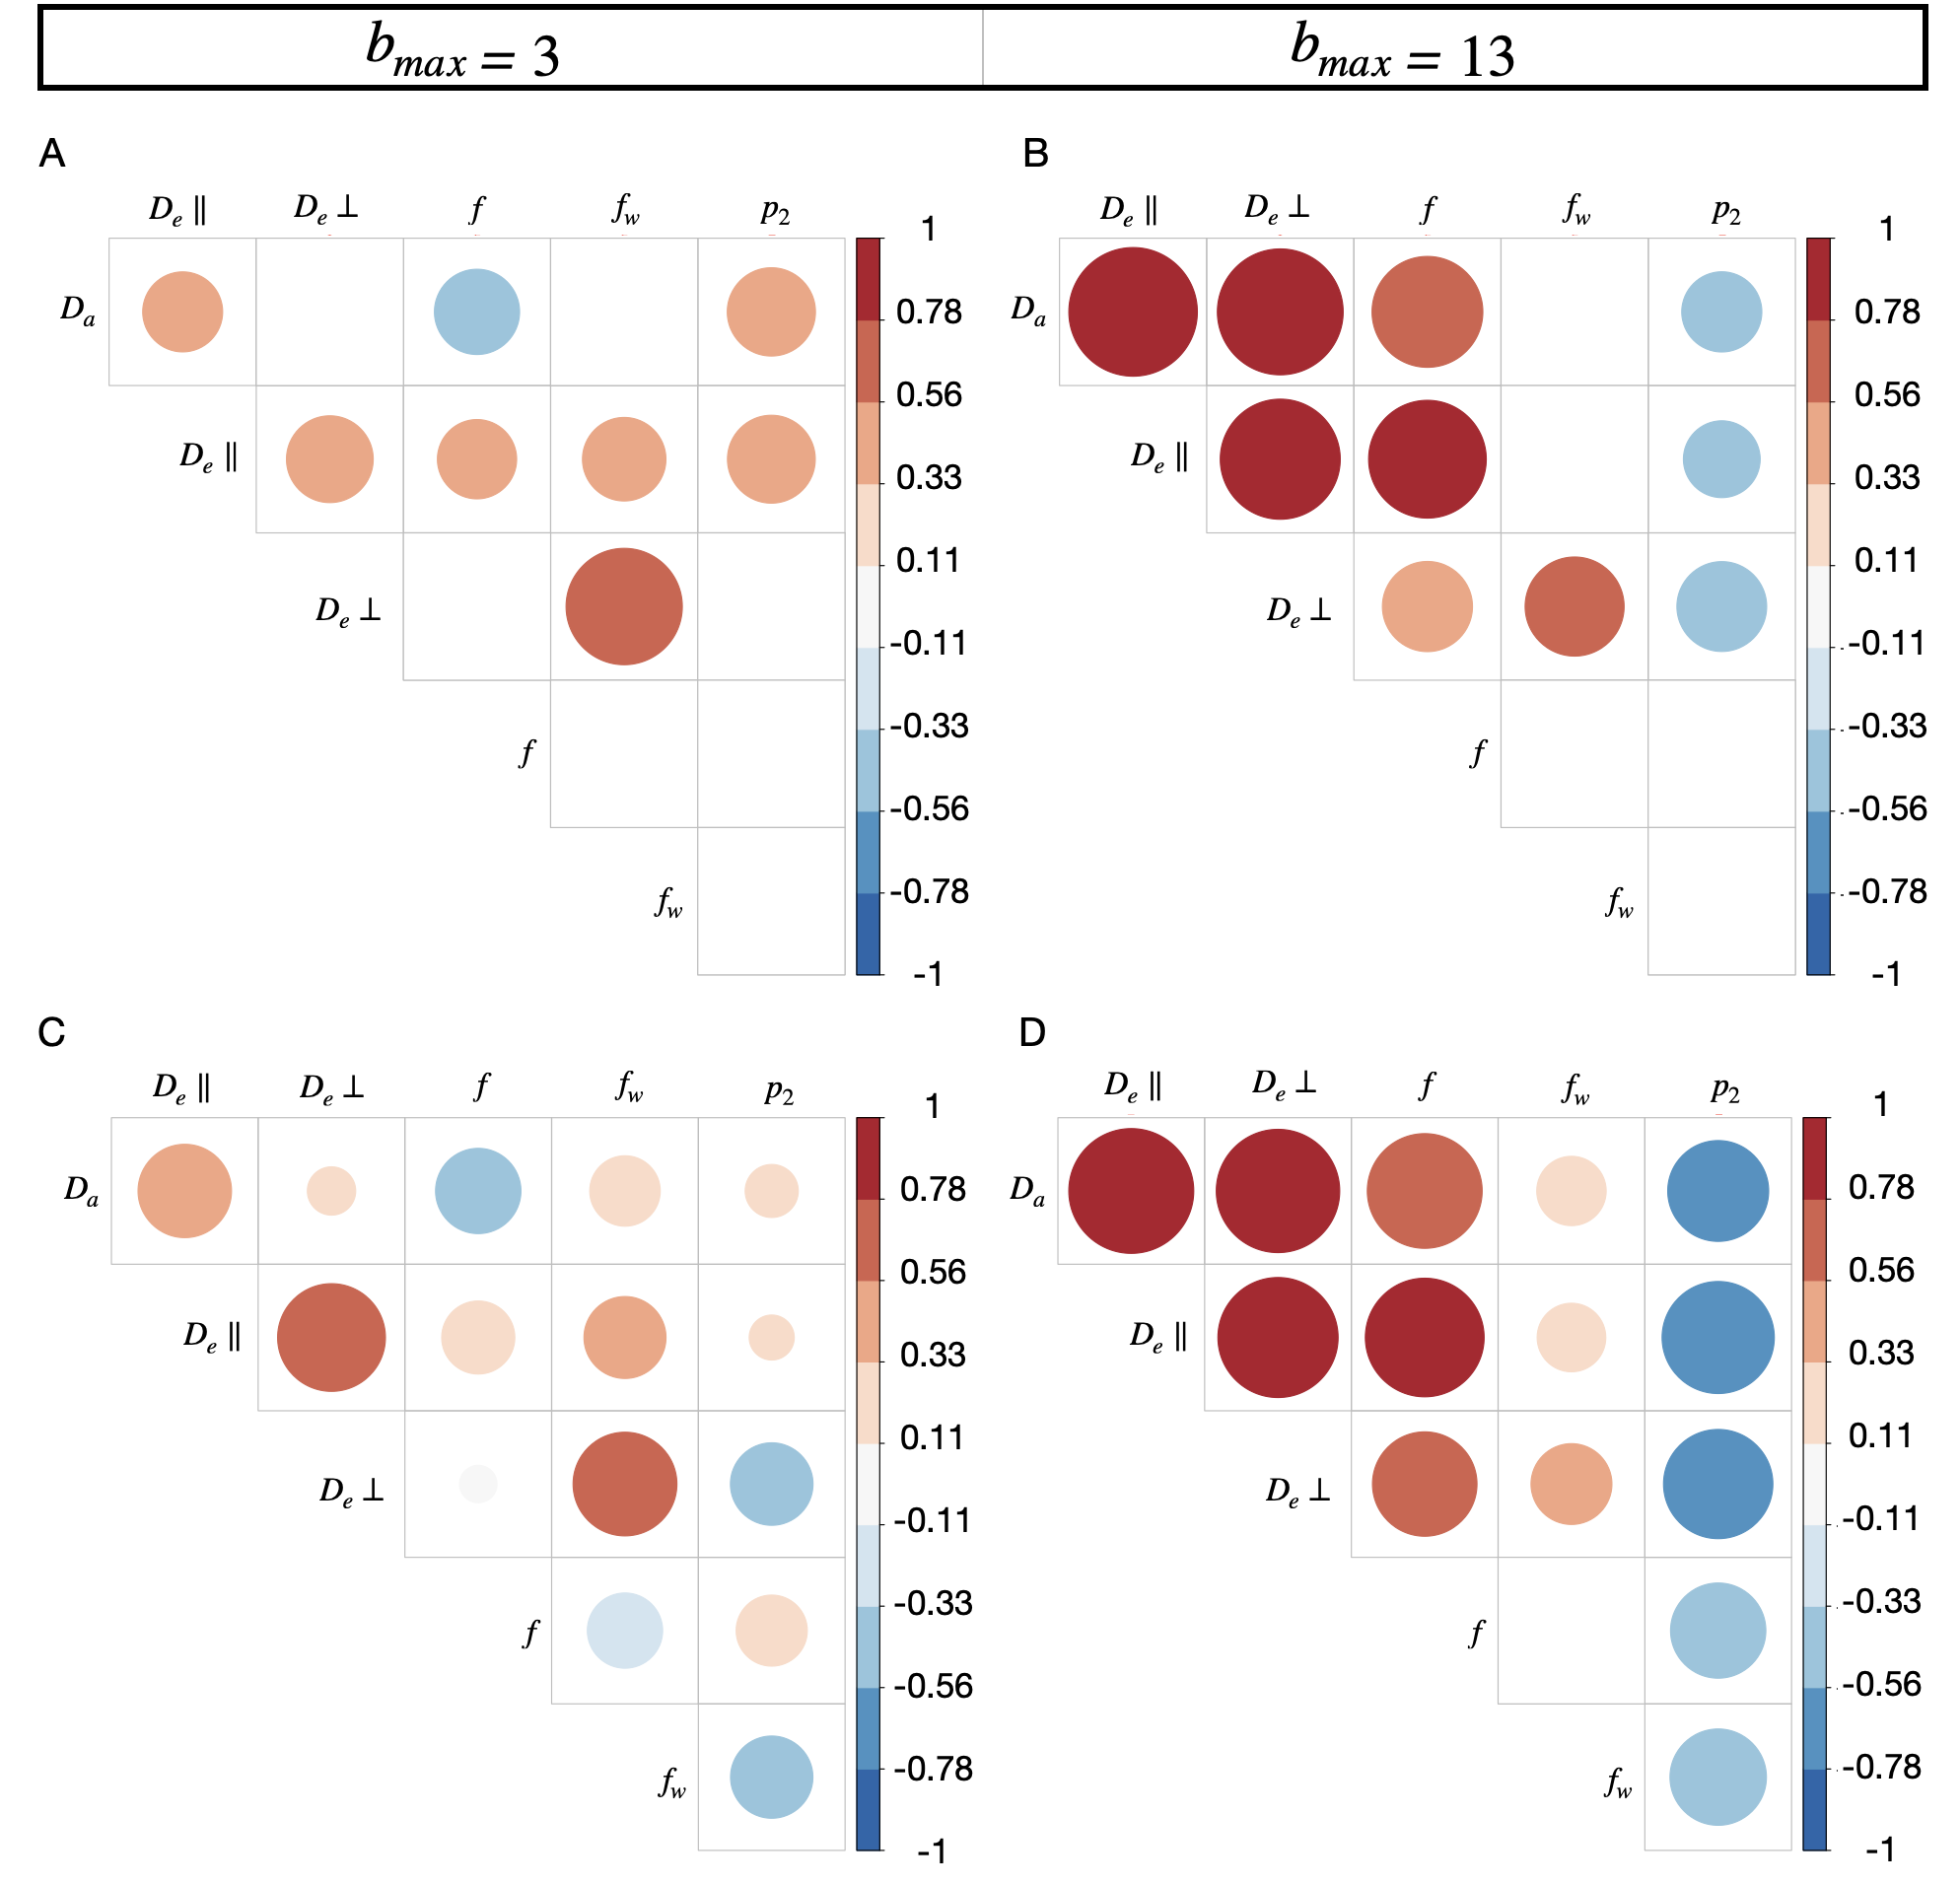
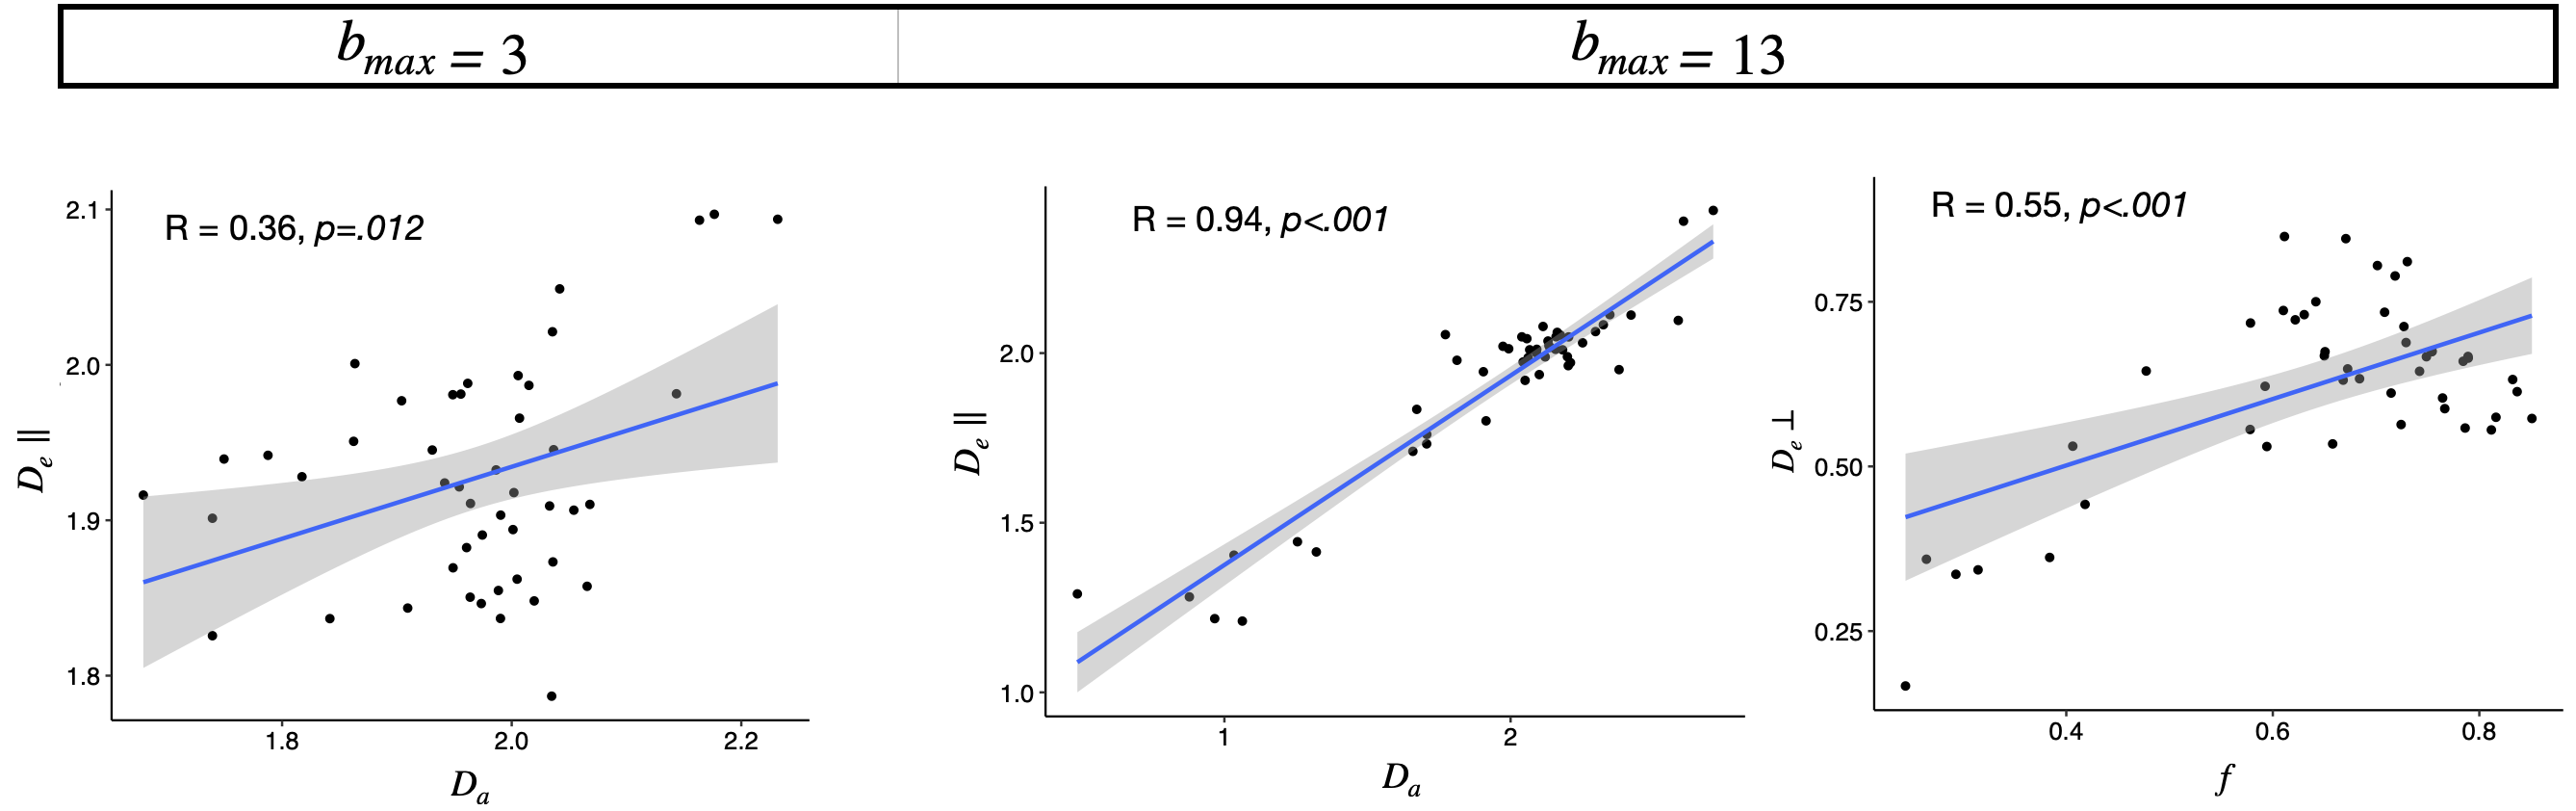
Single-subject parametric maps were smooth (Fig. 1) and consistent with values reported at 3T6, even at 1.5-mm isotropic resolution (Scan 1). There was a strong dependence of parameter estimates on the acquisition protocol (Table 1). Indeed, we observed that $$$f$$$ and $$$f_w$$$ were on average significantly higher and $$$p_2$$$ significantly lower in the bmax=13 protocol.Across ROIs, moderate correlations between SM parameters were found for the bmax=3 protocol (Fig. 2A), e.g., $$$D_e\parallel$$$ was positively correlated with $$$D_a$$$ (Fig.3) and $$$D_e\bot$$$ strongly with $$$f_w$$$. For the bmax=13 protocol, we observed stronger correlations between the parameters (Fig. 2B), for example $$$D_e\parallel$$$ was positively and more strongly correlated with $$$D_a$$$, and $$$D_e$$$ was correlated with $$$f$$$ which did not appear in bmax=3 protocol (Fig. 3). Similarly, voxel-wise estimates of model parameters in IC regions were more strongly correlated in the bmax=13 vs bmax=3 protocol (Fig. 2C-D).
Discussion and conclusions
Initial SM parameter maps at 7T confirm the feasibility of high-resolution microstructure quantification using a Human Connectome Project (HCP)-like protocol (bmax =3 $$$ms/\mu m^2$$$ ), with a higher spatial resolution than the one typical of 3T data (1.5 vs. 2 mm). The moderate correlations between parameters suggest the SM parameter count is appropriate to model the signal in this range. However, pushing to higher b-values (bmax=13 $$$ms/\mu m^2$$$) comes at the cost of modest spatial resolution (2 mm) and prolonged TE. Longer TE not only reduces SNR but may also weigh the signal more towards the intra- vs extracellular compartment due to longer T2 in the former8. This intra-axonal water selectivity affects the SM parameter estimates substantially and also results in more pronounced correlations between parameters. High b-values may also challenge SM assumptions of Gaussian compartments and stick geometry5.Ultra-high b-values can however give access to quantification of more advanced microstructure features such as axon diameters9. Future work will focus on disentangling the impact of TE and bmax. New clinically-approved high-field systems with strong gradients thus offer an interesting opportunity for the translation of microstructure mapping to clinical practice, where high SNR can be traded for spatial resolution or broad q-t sampling.
Acknowledgements
This work was supported by Sinergia - Precision mapping of electrical brain network dynamics with application to epilepsy - project (Grant number: 209470).References
1. Veraart, J. et al. Denoising of diffusion MRI using random matrix theory. NeuroImage 142, 394–406 (2016).
2. Kellner, E., Dhital, B. & Reisert, M. Gibbs-Ringing Artifact Removal Based on Local Subvoxel-shifts. Preprint at http://arxiv.org/abs/1501.07758 (2015).
3. Tournier, J.-D. et al. MRtrix3: A fast, flexible and open software framework for medical image processing and visualisation. Neuroimage 202, 116137 (2019).
4. Andersson, J. L. R. & Sotiropoulos, S. N. An integrated approach to correction for off-resonance effects and subject movement in diffusion MR imaging. Neuroimage 125, 1063–1078 (2016).
5. Novikov, D. S., Veraart, J., Jelescu, I. O. & Fieremans, E. Rotationally-invariant mapping of scalar and orientational metrics of neuronal microstructure with diffusion MRI. NeuroImage 174, 518–538 (2018).
6. Coelho, S. et al. Reproducibility of the Standard Model of diffusion in white matter on clinical MRI systems. NeuroImage 257, 119290 (2022).
7. Avants, B. B. et al. A Reproducible Evaluation of ANTs Similarity Metric Performance in Brain Image Registration. NeuroImage 54, 2033 (2011).
8. Veraart, J., Novikov, D. S. & Fieremans, E. TE dependent Diffusion Imaging (TEdDI) distinguishes between compartmental T2 relaxation times. NeuroImage 182, 360–369 (2018).
9. Veraart, J. et al. Noninvasive quantification of axon radii using diffusion MRI. eLife 9, e49855 (2020).
Figures