5063
Application of Cellular Microstructural Mapping (Cell size imaging) by Time-Dependent Diffusion MRI in rectal lesions: a preliminary study1The First Affiliated Hospital of Zhengzhou University, zhengzhou, China, 2Advanced Technical Support, Philips Healthcare, Beijing, China
Synopsis
Keywords: Microstructure, Cancer
Motivation: Preoperative evaluation of rectal lesions remains challenging, we need better methods to evaluate malignant and benign lesions, and to estimate prognostic factors for rectal cancer.
Goal(s): To explore the application value of cellular microstructural mapping by td-dMRI in evaluating the histological type and prognostic factors of rectal lesions.
Approach: Sixty-six patients with rectal lesions were enrolled in this study. MRI was performed on a 3T scanner (Ingenia Elition, Philips Healthcare, Best, the Netherlands). All subjects underwent conventional MRI, oscillating gradient spin-echo (OGSE) and pulse gradient spin-echo (PGSE).
Results: Our preliminary results illustrated that td-dMRI are useful in preoperative evaluation of rectal lesions.
Impact: Cellular microstructural mapping by time-dependent diffusion MRI has great potential in preoperative evaluation of rectal lesions. The results illustrated that it could be helpful in differentiating malignant and benign lesions, distinguishing AC from MC, and in predicting the TB status.
Introduction
Colorectal cancer is a common malignant tumor in the digestive system, which is the third most common cancer and the second most common cause of cancer-related death1. About 30% are occurred in the rectum2, and 90% are classified as adenocarcinoma. In addition to malignant tumors, benign lesions could also occur in the rectum, such as rectal adenomas, inflammatory lesions, etc. And the pathological types of rectal lesions affect the choice of treatment methods for patients. Magnetic resonance imaging (MRI) has become the preferred imaging method for rectal lesions due to its excellent soft tissue resolution. However, preoperative classification of rectal lesions remains challenging.The conventional diffusion-weighted magnetic resonance imaging (dMRI) along with the derived apparent diffusion coefficient (ADC) has shown important diagnostic value in rectal lesions. Nevertheless, it was not sufficient in differentiating subtypes and the existing findings were not consistent3, 4. One of the key reasons may lie in that ADC is a general measurement of restricted diffusion rate that cannot pinpoint the underlying pathology, both the change of cell size, density, and intra- or extra-cellular diffusivity could change ADC. Recent advances in time-dependent dMRI (td-dMRI) for microstructural modeling provide the opportunity to characterize cancer pathology in vivo. This approach has been used in the study of multiple systemic diseases in patients with breast, prostate cancer, and brain tumor5-7. However, the application value in evaluating pathological features of rectal lesions remains unclear.
The current study aims to evaluate the accuracy of td-dMRI-based microstructural mapping using the IMPULSE model in rectal lesions, and further to evaluate whether the tumor microstructural properties obtained from td-dMRI could be used to distinguish prognostic factors in rectal cancer.
Methods
Sixty-six patients with rectal lesions were evaluated. MRI was performed on a 3T scanner (Ingenia Elition, Philips Healthcare, Best, the Netherlands) with a high-performance gradient system. All patients underwent T1-weighted imaging, fat-suppressed T2-weighted imaging, diffusion-weighted imaging, oscillating gradient spin-echo (OGSE) sequence with trapezoid-cosine gradients and pulse gradient spin-echo (PGSE) with 2D echo-planar imaging acquisition. The fitted microstructural parameters, including mean cell diameter (dmean), intracellular fraction (vin), and extracellular diffusivity (dex), cellularity and apparent diffusion coefficient (ADC), were calculated in a voxelwise manner. The diagnostic power was evaluated through the receiver operating characteristic (ROC) curve.Results
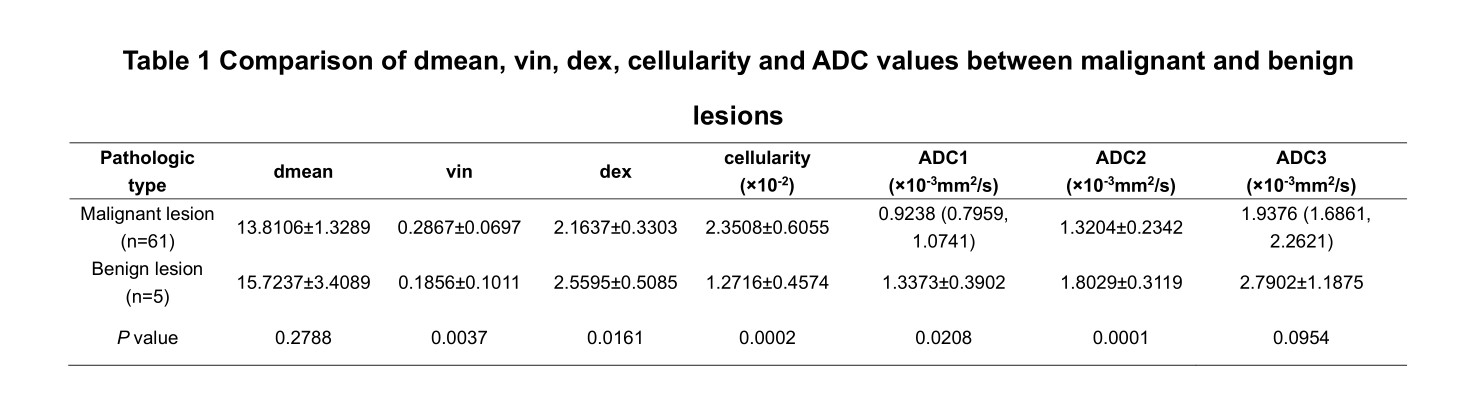
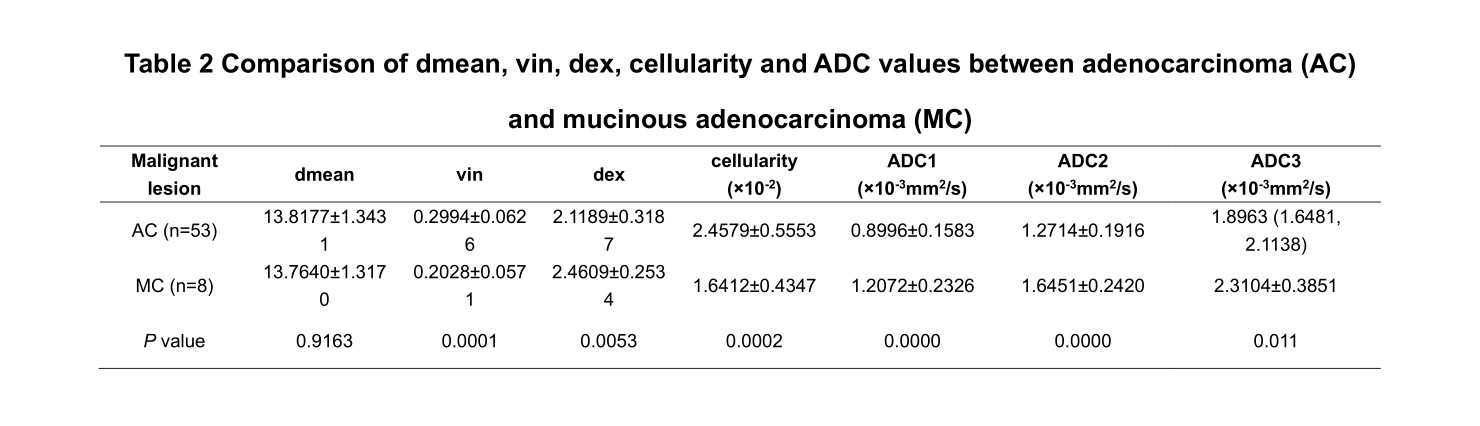
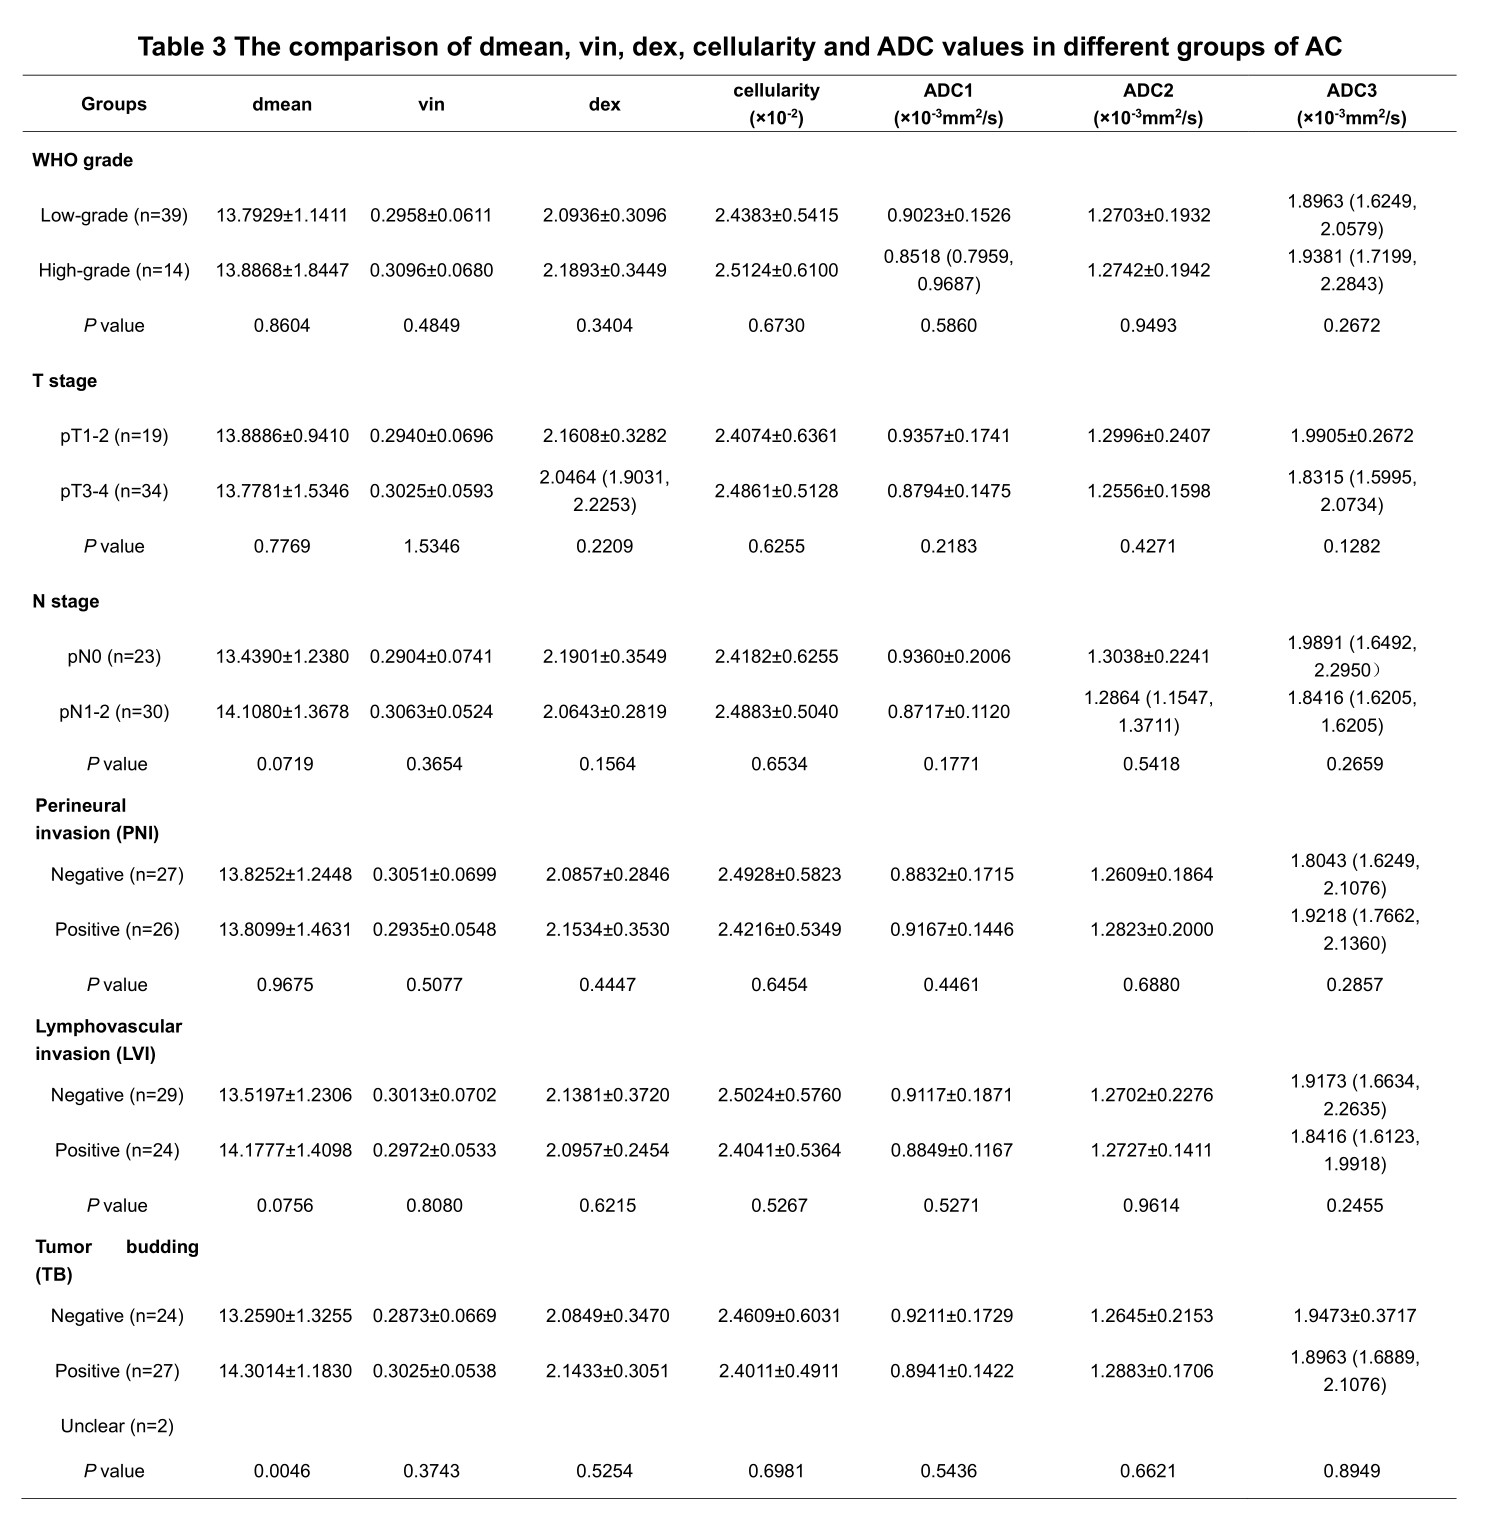
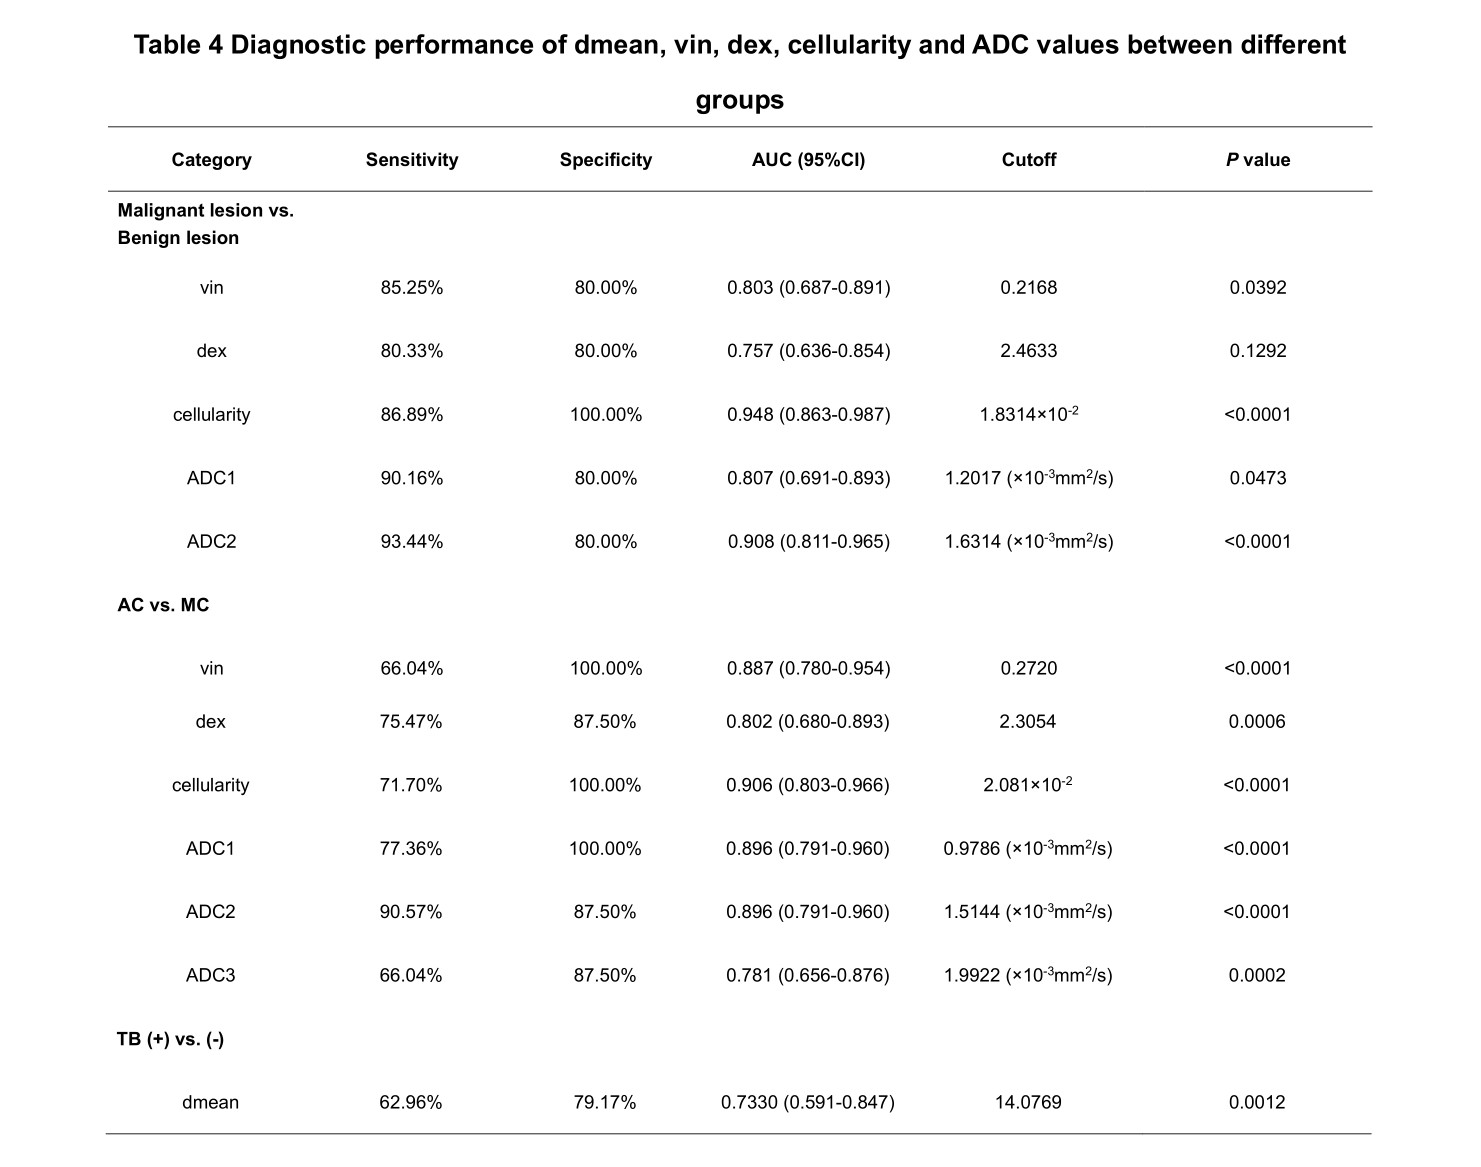
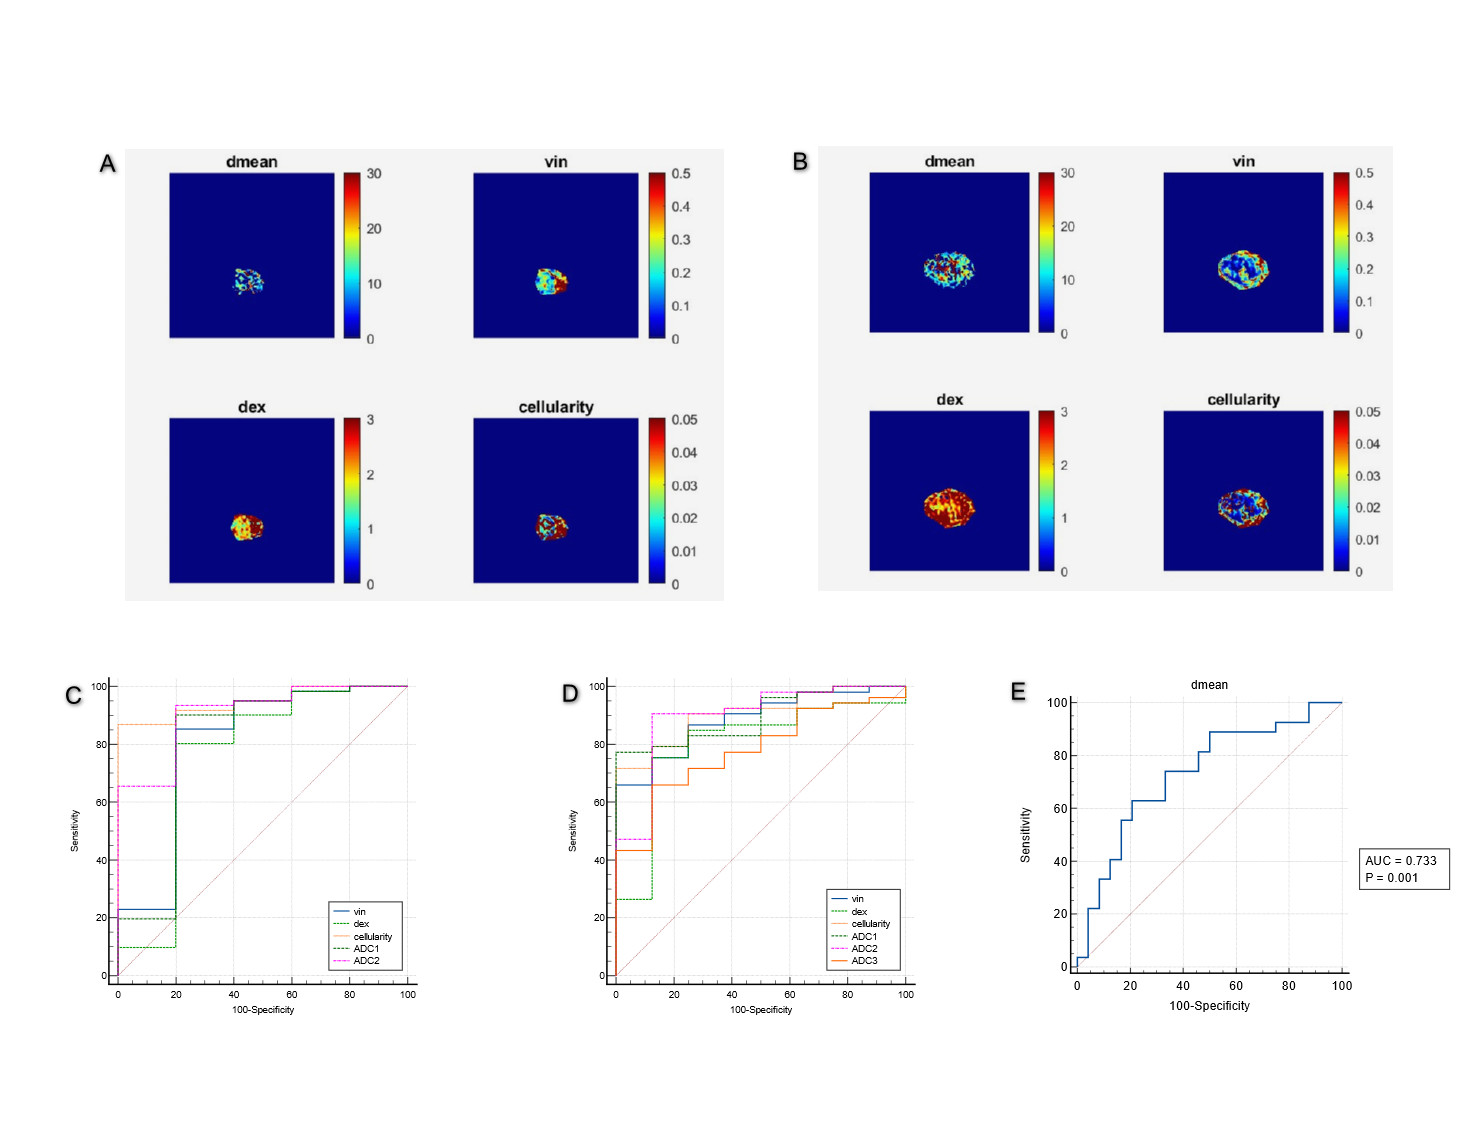
Malignant lesion showed higher vin and cellularity ([0.2867±0.0697] vs. [0.1856±0.1011], [2.3508±0.6055] vs. [1.2716±0.4574], all P<0.05), lower dex and ADC values compared to benign lesion ([2.1637±0.3303] vs. [2.5595±0.5085], [0.9238 (0.7959, 1.0741)] vs. [1.3373±0.3902], [1.3204±0.2342] vs. [1.8029±0.3119], all P<0.05), while no difference was seen for dmean. Vin and cellularity of rectal common adenocarcinoma (AC) were significantly higher than those of rectal mucinous adenocarcinoma (MC) ([0.2994±0.0626] vs. [0.2028±0.0571], [2.4579±0.5553] vs. [1.6412±0.4347], all P<0.05), while dex and ADC values were lower in AC ([2.1189±0.3187] vs. [2.4609±0.2534], [0.8996±0.1583] vs. [1.2072±0.2326], [1.2714±0.1916] vs. [1.6451±0.2420], [1.8963 (1.6481, 2.1138)] vs. [2.3104±0.3851], all P<0.05). In AC group, the dmean had significant difference between negative and positive tumor budding (TB) ([13.2590±1.3255] vs. [14.3014±1.1830], P<0.05). No significant difference of dmean, vin, dex, cellularity or ADC was observed in different grade, T stage, N stage, perineural and lymphovascular invasion (all P>0.05). The ROC curves showed that the area under the curves (AUCs) of vin, cellularity and ADC values for distinguishing malignant and benign lesion were 0.803, 0.948, 0.807 and 0.908, respectively. The AUCs of vin, dex, cellularity and ADC in distinguishing AC from MC were 0.887, 0.802, 0.906, 0.896, 0.896 and 0.781, respectively. The AUC of the dmean for evaluating TB status was 0.733.Discussion
This was a preliminary feasibility study of td-dMRI-based microstructural mapping for the preoperative evaluation of rectal lesions. Our preliminary results illustrated that the vin, dex, cellularity and ADC values can be used to differentiate malignant and benign lesions, and distinguish AC from MC. In addition, dmean was helpful in predicting the TB status in AC. However, the current study has some limitations. Our sample size was not large enough, which limited the diagnostic accuracy. Larger sample sizes and multicenter study are needed in the future to confirm the clinical value. Conclusion: Td-dMRI-based microstructural mapping using the IMPULSE model has great potential in preoperative evaluation of rectal lesions, and could further evaluate TB status in AC.Acknowledgements
We are particularly grateful to everyone who helped us with our article. This work was supported by the First Affiliated Hospital of Zhengzhou University, especially the Department of MRI.References
[1] Sung H, Ferlay J, Siegel RL, et al. Global cancer statistics 2020: GLOBOCAN estimates of incidence and mortality worldwide for 36 cancers in 185 countries[J]. CA Cancer J Clin, 2021, 71(3): 209-249.
[2] Siegel RL, Wagle NS, Cercek A, et al. Colorectal cancer statistics, 2023. CA Cancer J Clin, 2023, 73(3): 233-254.
[3] Schurink NW, Lambregts DMJ, Beets-Tan RGH. Diffusion-Weighted Imaging in Rectal Cancer: Current Applications and Future Perspectives. Br J Radiol, 2019, 92(1096): 20180655.
[4] Zhu L, Pan Z, Ma Q, et al. Diffusion Kurtosis Imaging Study of Rectal Adenocarcinoma Associated With Histopathologic Prognostic Factors: Preliminary Findings. Radiology, 2017, 284(1): 66-76.
[5] Xu J, Jiang X, Li H, et al. Magnetic resonance imaging of mean cell size in human breast tumors. Magn Reson Med, 2020, 83(6): 2002-2014.
[6] Wu D, Jiang K, Li H, et al. Time-Dependent Diffusion MRI for Quantitative Microstructural Mapping of Prostate Cancer. Radiology, 2022, 303(3): 578-587.
[7] Hongxi Zhang, Kuiyuan Liu, Ruicheng Ba, et al. Histological and molecular classifications of pediatric glioma with time-dependent diffusion MRI-based microstructural mapping. Neuro Oncol, 2023, 25(6): 1146-1156.
Figures