5061
Total tumor apparent diffusion coefficient histogram parameters identify ISS stages in multiple myeloma with diffuse infiltration1Peking Union Medical College Hospital, beijing, China, 2MR Collaboration, Siemens Healthineers Ltd, beijing, China, 3MR Application Predevelopment, Siemens Healthcare GmbH, Erlangen, Germany
Synopsis
Keywords: Diffusion Analysis & Visualization, Hematologic, multiple myeloma, whole-body diffusion-weighted imaging
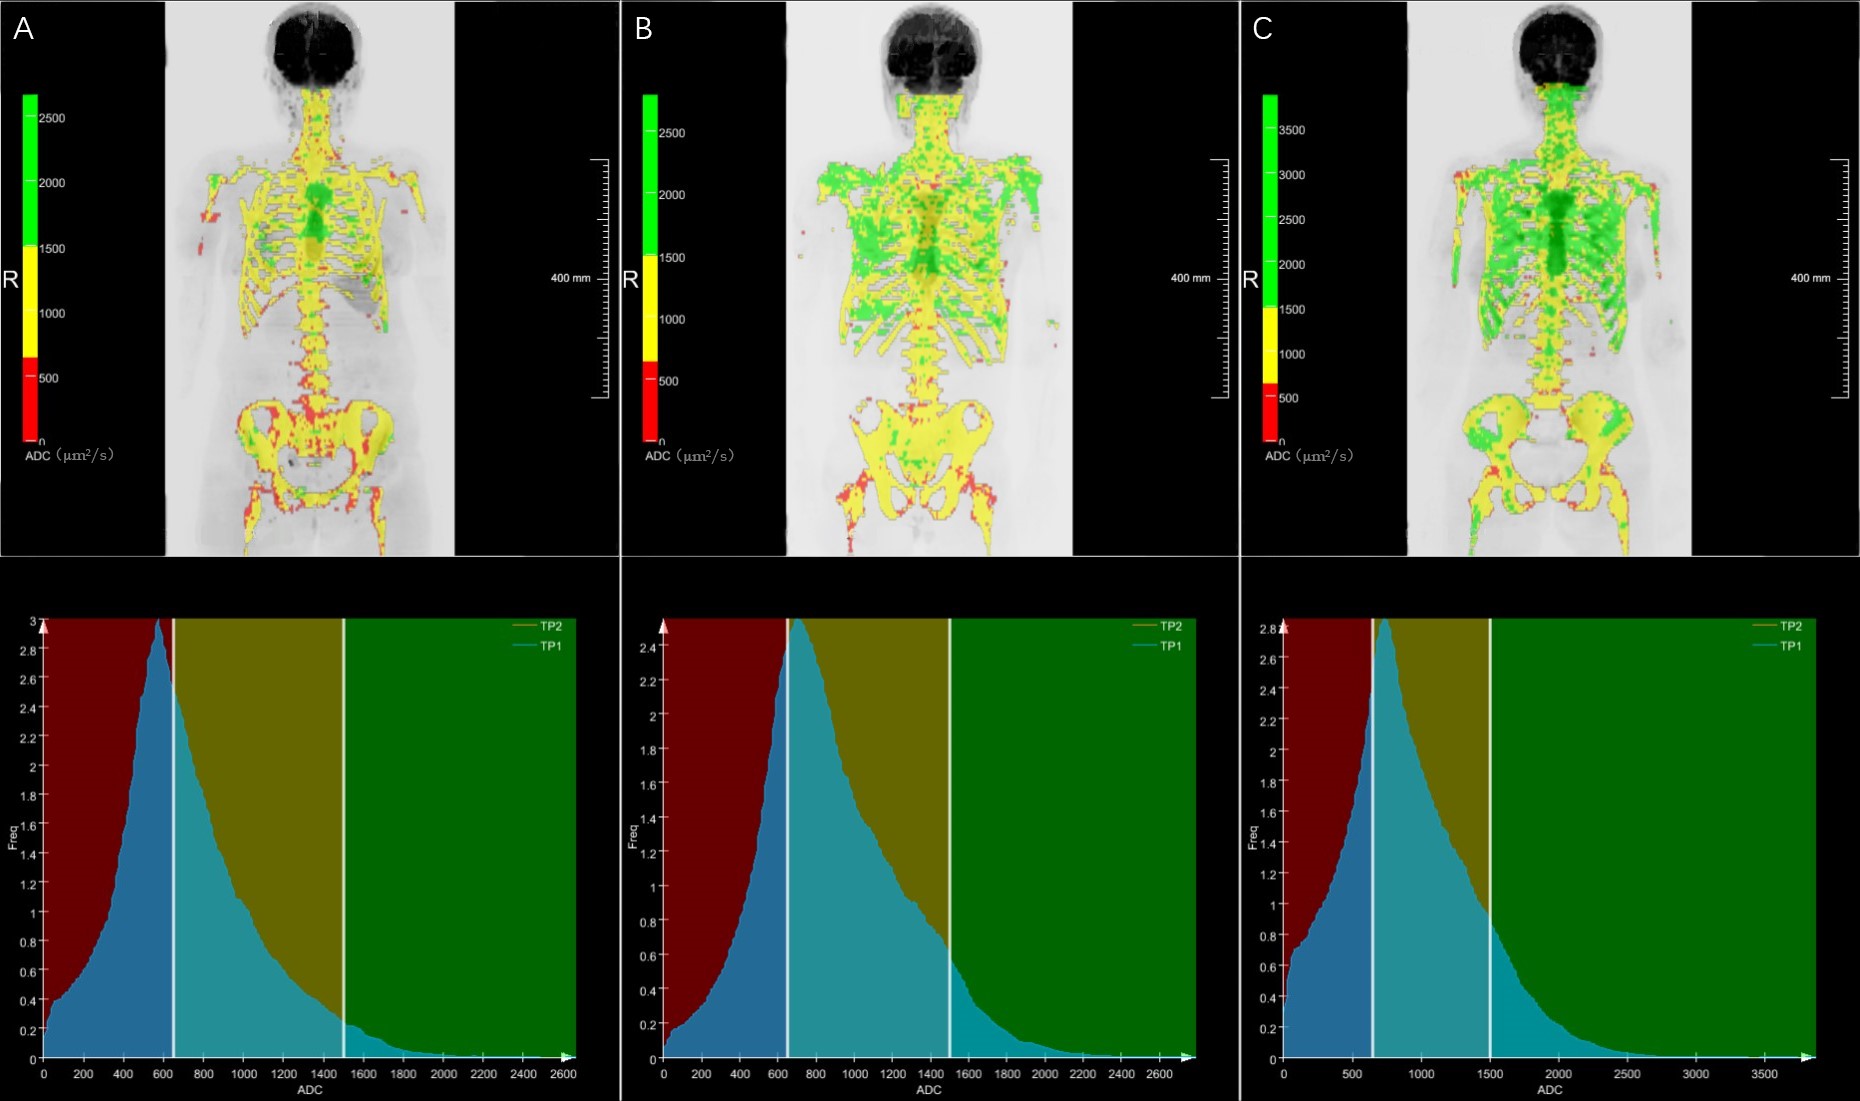
Motivation: Is there any difference in the ttADC histogram parameters at different ISS stages in multiple myeloma patients with diffuse infiltration visually?
Goal(s): The goal was to explore the difference in ttADC histogram parameters and clinical indicators in multiple myeloma patients with diffuse infiltration at different ISS stages.
Approach: The ttADC histogram parameters were obtained by sketching the lesions of the whole body on WB-DWI images using MRTTL software.
Results: Age, hemoglobin, creatinine, and ttADC_5% were different at different ISS stages.
Impact: Diffuse infiltration is generally thought to be associated with a poorer prognosis for MM patients. Our study shows that although all patients have diffuse infiltration, different ttADC histogram parameters may result in different prognosis.
Introduction
In recent years, whole-body diffusion-weighted imaging(WB-DWI)has been increasingly applied to multiple myeloma (MM) research and clinical guidelines. However, most WB-DWI-related multiple myeloma studies chose to select several obvious lesions as regions of interest and calculated the average apparent diffusion coefficient (ADC) value to represent the systemic lesion ADC value[1-3]. Due to the heterogeneity of MM, it is not enough to use the mean ADC values of a subset of lesions to represent systemic lesions. The histogram analysis method based on the total tumor ADC (ttADC) can provide more information about tumor heterogeneity. Studies have shown that patients with diffuse infiltration have a mean ADC value higher than that of asymptomatic MM patients and lower than that of patients with FLs. However, the ADC difference between diffuse-infiltrated MM (DIMM) levels at different ISS stages is unclear. Therefore, this study aimed to explore the differences in ttADC histogram parameters and conventional clinical indicators in DIMM between different ISS stages and the correlation between ADC histogram parameters and clinical indicators.Methods
This study included 48 DIMM patients who underwent whole-body magnetic resonance imaging (MRI) that included WB-DWI before treatment on a 3T system (MAGNETOM Skyra, Siemens Healthcare, Erlangen, Germany). All tumor lesions of DIMM patients were sketched semiautomatically using research postprocessing software (MR Total Tumor Load, Siemens Healthcare, Erlangen, Germany), and relevant ttADC histogram parameters were obtained, including the total tumor diffusion volume (ttDV), the mean of the ttADC (ttADC_mean), the standard deviation of the ttADC (ttADC_SD), the median of the ttADC (ttADC_median), the 5th percentile of the ttADC (ttADC_5%), and the 95th percentile of ttADC (ttADC_95%), as well as the skewness, excess kurtosis, and entropy. In addition, we collected the M protein percentage, age, and other relevant clinical indicators. Differences in ttADC histogram parameters and clinical indicators were assessed between different ISS stages using ANOVA or Kruskal-Wallis Test. The correlation between the ttADC histogram parameters and the clinical indicators was assessed with a Spearman test; p < 0.05 was considered statistically significant.Results
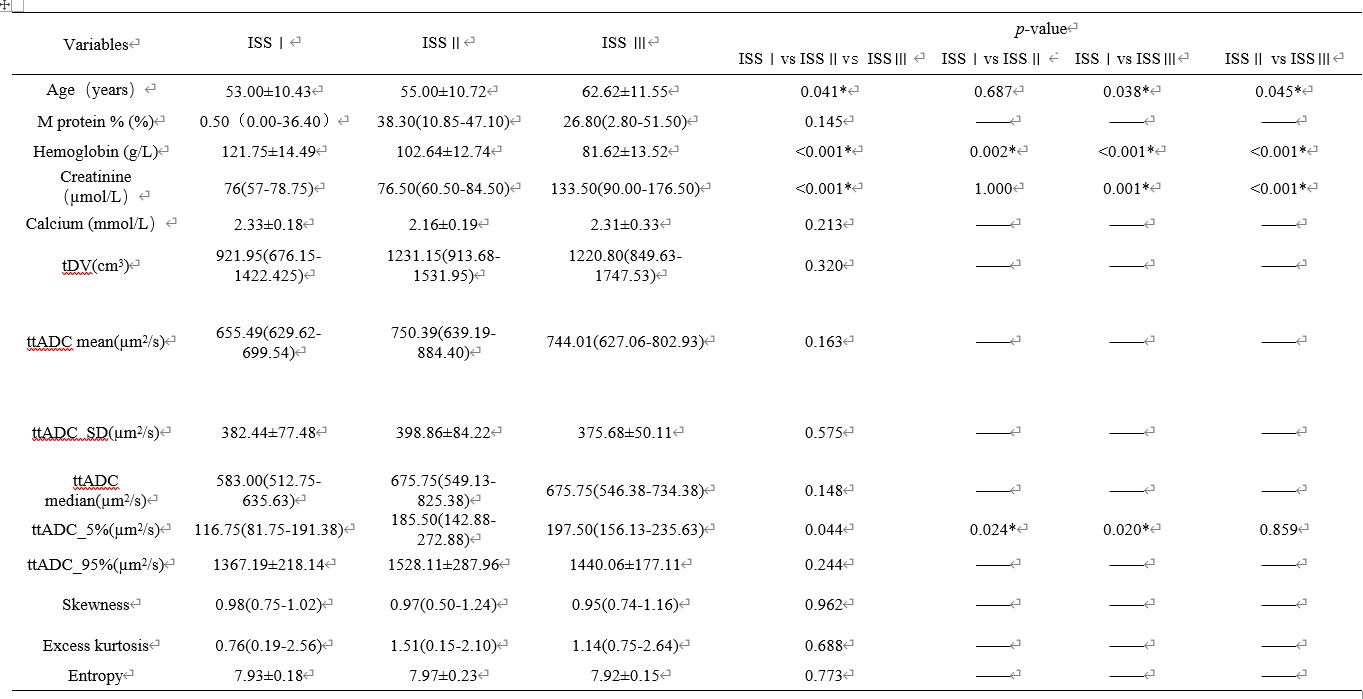
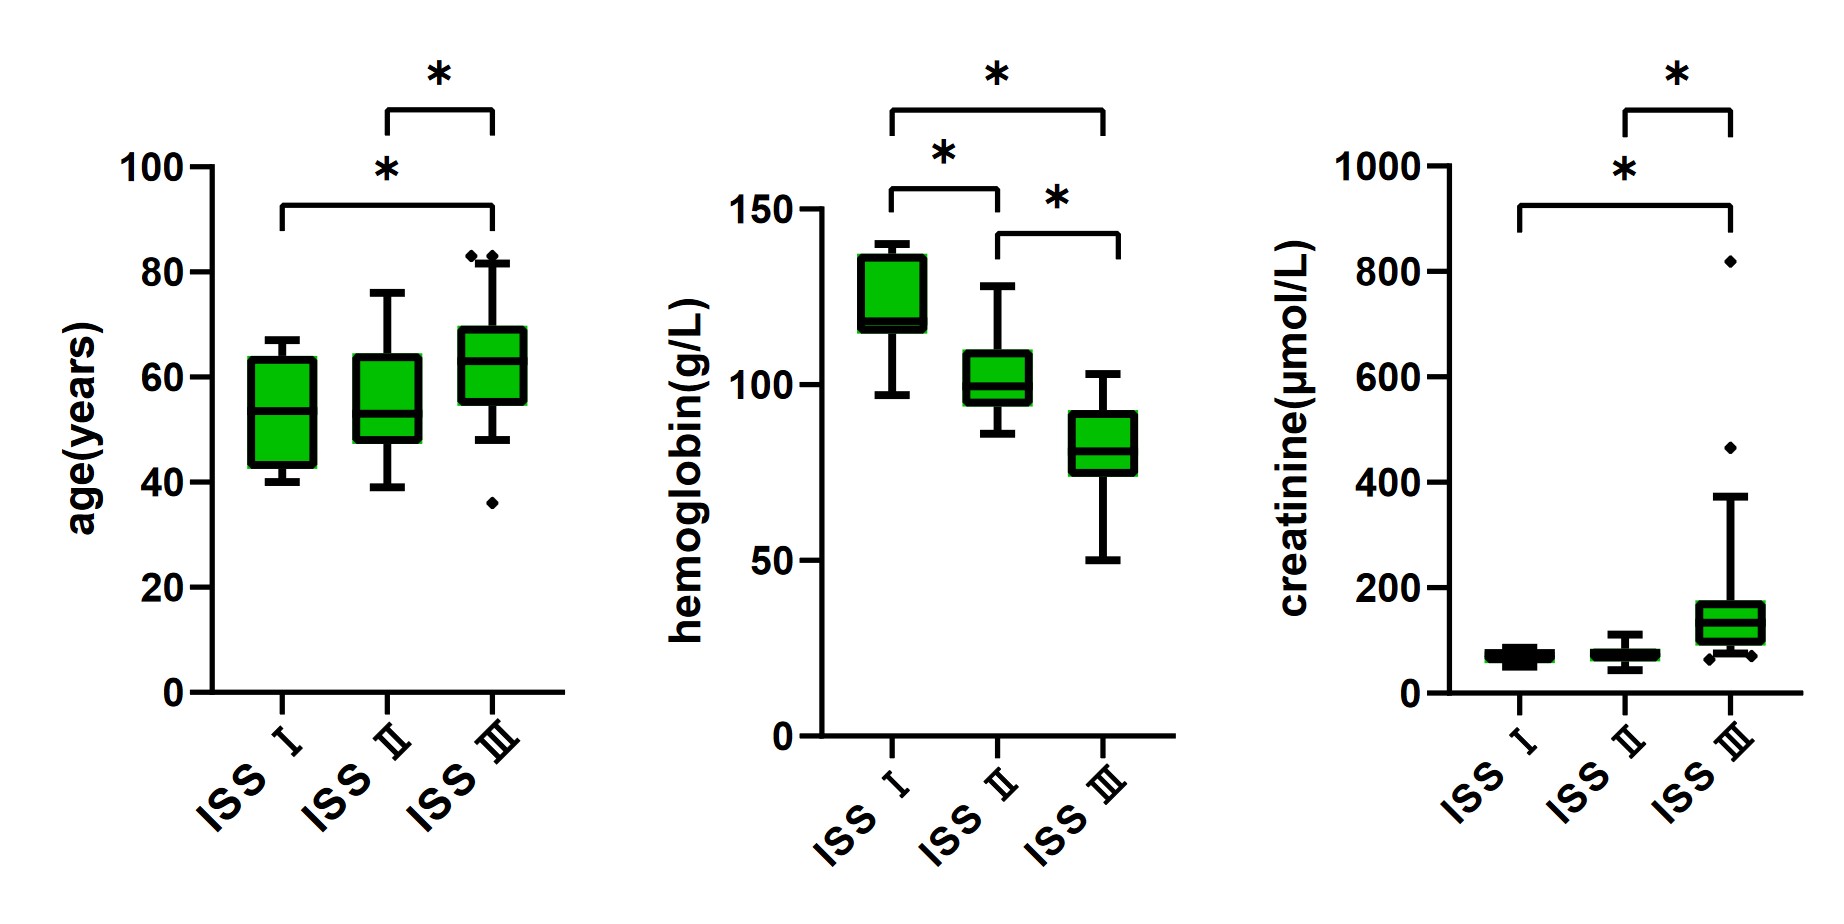
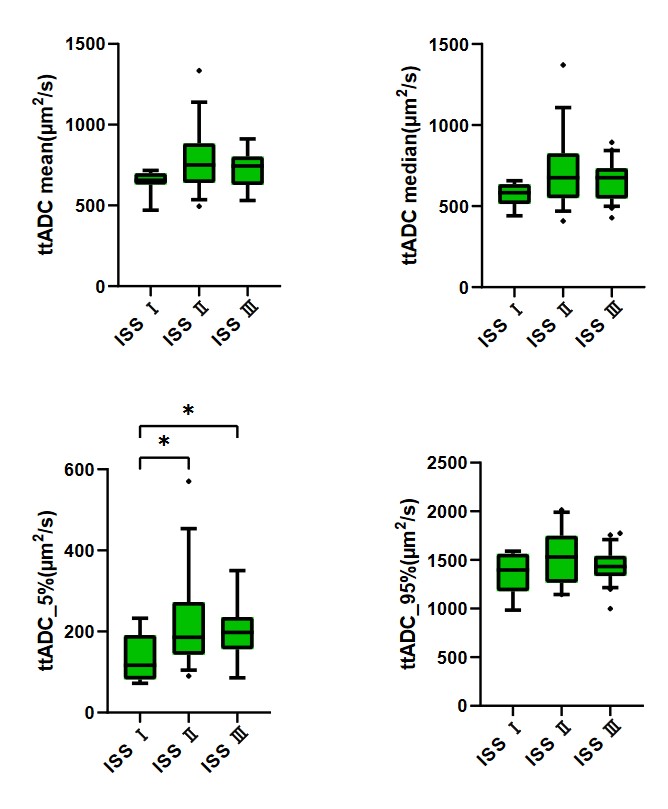
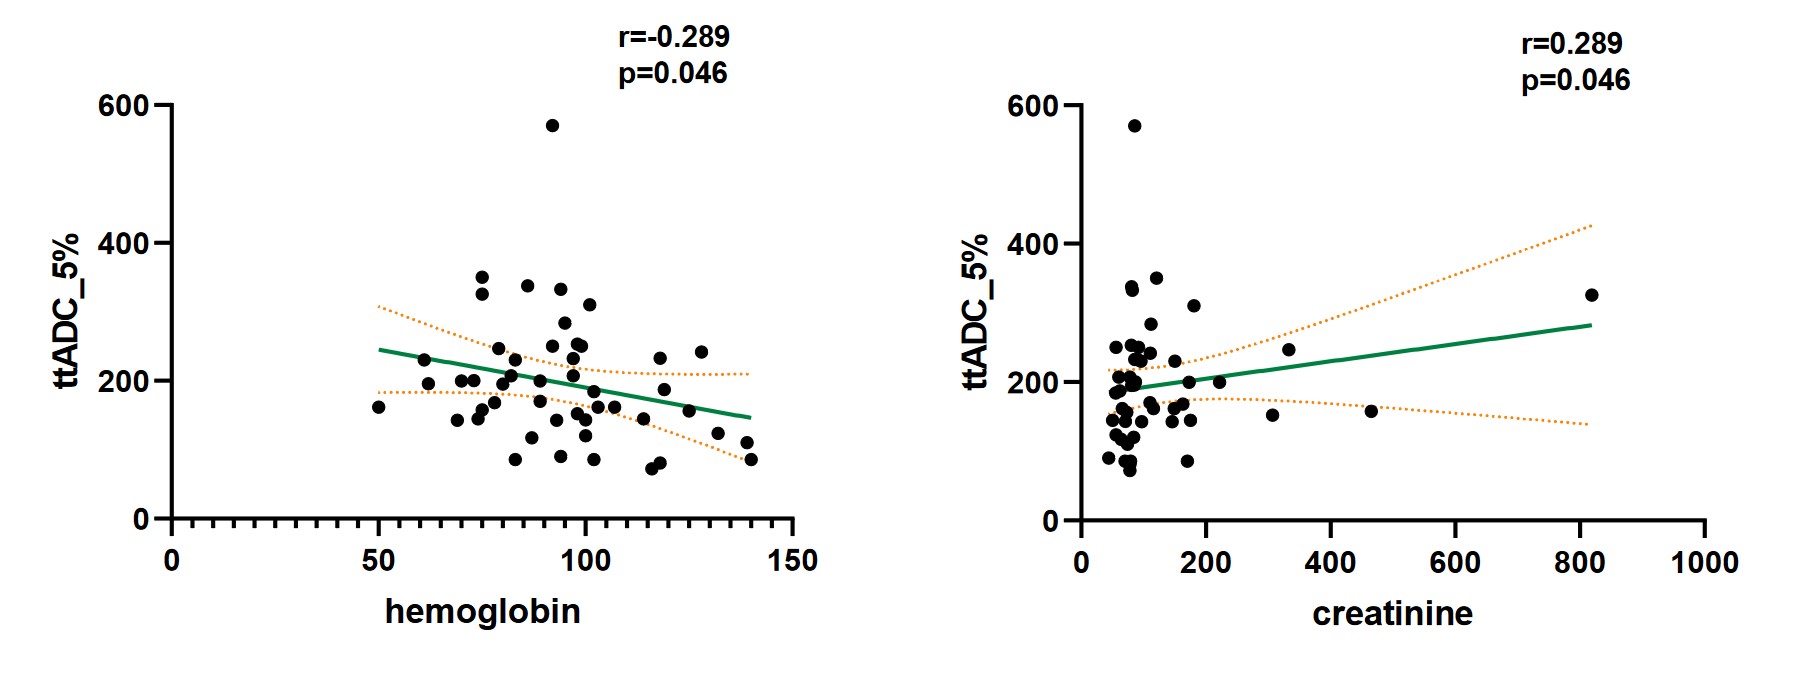
The age of the DIMM patients in stage III was significantly higher than that of those in stage Ⅰ (p = 0.038) and stage Ⅱ (p = 0.045; Table1 and Figure1). The hemoglobin level of the DIMM patients decreased gradually with the increase of ISS stage (p < 0.001; Table1 and Figure1). The creatinine level of the DIMM patients in ISS stage III was significantly higher than that of those in ISS stage Ⅰ (p = 0.029) and stage Ⅱ (p = 0.012; Table1 and Figure1). The ttADC_5% in stage Ⅱ and stage III were significantly higher than those in stage Ⅰ (p = 0.044; Table 1 and Figure 2 and Figure 3). In addition, the ttADC_5% was negatively correlated with hemoglobin (r = −0.289, p = 0.046), and ttADC_5% was positively correlated with creatinine (r = 0.289, p = 0.046; Figure 4).Discussion and Conclusion
This was a feasibility study of ttADC histogram parameters for the classification of the ISS stages of DIMM. Although they are all DIMM patients, ADC histogram parameters and clinical indicators differ at different ISS stages. Future studies may look at the differences in prognoses for DIMM at different stages.Acknowledgements
The authors would like to thank Ms. Ying Li for her support with picture modification.References
[1] MESSIOU C, HILLENGASS J, DELORME S, et al. Guidelines for Acquisition, Interpretation, and Reporting of Whole-Body MRI in Myeloma: Myeloma Response Assessment and Diagnosis System (MY-RADS) [J]. Radiology, 2019, 291(1): 5-13 DOI: 10.1148/radiol.2019181949
[2] ZHANG B, BIAN B, ZHANG Y, et al. The Apparent Diffusion Coefficient of Diffusion-Weighted Whole-Body Magnetic Resonance Imaging Affects the Survival of Multiple Myeloma Independently [J]. Frontiers in oncology, 2022, 12(780078) DOI: 10.3389/fonc.2022.780078
[3] ZHANG L, WANG Q, WU X, et al. Baseline bone marrow ADC value of diffusion-weighted MRI: a potential independent predictor for progression and death in patients with newly diagnosed multiple myeloma [J]. European radiology, 2021, 31(4): 1843-52 DOI: 10.1007/s00330-020-07295-6
Figures