5060
Investigating the relationship between diffusion MR measures and passive torques of finger flexor muscles in individuals with cerebral palsy1Department of Biomedical Engineering, Northwestern University, Chicago, IL, United States, 2Department of Physical Therapy and Human Movement Sciences, Northwestern University Feinberg School of Medicine, Chicago, IL, United States, 3Department of Physical Medicine and Rehabilitation, Northwestern University Feinberg School of Medicine, Chicago, IL, United States, 4Department of Neurology, Northwestern University Feinberg School of Medicine, Chicago, IL, United States
Synopsis
Keywords: Muscle, Diffusion Tensor Imaging, cerebral palsy, passive torques
Motivation: Individuals with cerebral palsy (CP) often experience atypical biomechanical properties in the hand, yet little is known regarding the in vivo microstructural mechanisms in the muscle that underlie these impairments.
Goal(s): This study aimed to establish the relationship between diffusion MRI measures in forearm muscles and biomechanical features of the fingers.
Approach: Diffusion MR and torque measurements were acquired in five individuals with CP. Correlations between MR measures and the passive torque at the finger joints were investigated.
Results: Passive torque was significantly correlated with muscle volume (r=0.68,p=0.045) and FA (r=0.69,p=0.040), but FA and muscle volume were not significantly correlated with one another.
Impact: Diffusion MR-derived metrics such as FA and muscle volume have potential to be clinically translatable measures for identifying altered biomechanics in individuals with cerebral palsy and other populations with neuromuscular pathologies.
Introduction
Cerebral palsy (CP) results in an increased resistance to muscle elongation, particularly during extension of distal joints such as the wrist and fingers, leading to atypical biomechanical properties in flexor muscles1. Diffusion tensor imaging (DTI) derived diffusivity metrics in forearm muscles may provide insight into maladaptive changes in the muscle tissue2, serving as potential biomarkers for increased passive torque (PT) properties while muscles are in an inactive state. Here, we implement DTI and isometric torque measurements in individuals with hemiparetic CP (HCP) to investigate how diffusion properties in forearm muscles are related to the PT at the affected (paretic) and non-affected (non-paretic) finger joints. We focus on the finger flexor group, which is comprised of the flexor digitorum profundus (FDP) and the flexor digitorum superficialis (FDS) muscles in the forearm.Methods
MRI Acquisition and Analysis: In five individuals (17.3±5.2y,3F) with mild to moderate3 HCP, MR images of both forearms were acquired using a 1.5T Siemens Aera scanner and a 2x18 channel body matrix coil, with the wrist and finger joints secured in an MR-compatible orthosis (Fig.1A). T1-weighted 3D VIBE (TR=16ms,TE=7.16ms,FOV=256x304mm2,voxel=0.78x0.78x3mm3) and diffusion-weighted spin-echo EPI (TR=8500ms,TE=48ms,FOV=250x250mm2,voxel=1.25x1.25x6.5mm3), including 3x12 diffusion-weighted directions (b=400s/mm2) and 10 volumes with no diffusion weighting (b=0s/mm2), were acquired. Fat was suppressed with Spectral Attenuated Inversion Recovery. Processing of MR data was done in the FSL software library4. Diffusion tensors were fit at each voxel of the dMR volumes. T1 images were used to segment the finger flexor muscles and calculate flexor muscle volume (FMV). Whole-volume fractional anisotropy (FA) was estimated by calculating FA within each voxel from its fitted diffusion tensor and averaged across the corresponding muscle volumes (Fig.1B).Passive Torque Measurement and Analysis: A custom-built device was used to measure joint torques generated about the finger joints when the wrist was in roughly the same posture as during the MR acquisition and the fingers were in seven configurations ranging from 45° flexion to 45° extension (Fig.1C). Electromyographic signals were monitored to ensure finger muscles were in an inactive state during torque measurement as defined by previously established thresholds5. A slope was fit to the torque-angle response to calculate the PT as Newton-meters per degree (Nm/°) at the finger joints (Fig.1D).
Statistical Analyses: Paired t-tests were performed to determine the differences in FMV and PT between non-paretic and paretic arms. FMV was used as a covariate in the comparison of PT between arms. Pearson correlation coefficients were calculated between the following pairs: 1) muscle volume and PT, 2) FA and PT, and 3) FMV and FA. Age was used as a covariate in all correlation analyses.
Results
FMV was decreased in the paretic side across the study cohort (p=0.02). Fig.2 shows individual PT data points at the different finger joint configurations fitted to a linear regression for both arms across the study cohort. The calculated PT (Nm/°) was increased in paretic arm (p=0.009). FMV and FA were positively correlated with PT (FMV:r=0.68,p=0.045; FA:r=0.69,p=0.040) (Fig.3). However, there was no significant correlation between FA and FMV (r=0.38,p=0.31). Fig. 4 illustrates the diffusion tensor profiles within the finger flexor region, showing relatively more isotropic orientation in arms with low PT (Fig.4A) and relatively more anisotropic orientation in arms with high PT (Fig.4B).Discussion
These results show that both macroscopic (muscle volume) and microscopic (FA) measures of finger flexor muscles are sensitive to PT at the finger joints. In CP, the paretic muscles are prone to smaller volumes in previous MR studies6, which is confirmed here. However, while histological studies have shown increased collagen content in the extracellular matrix surrounding paretic muscle fibers in CP7, there are currently no prior MR studies showing in vivo evidence of this phenomenon. The FA results shown here are potentially supportive of proliferation of the extracellular matrix in paretic muscles that could impact biomechanical function. Because collagen fibers are highly restrictive to biomolecular diffusion8, increased collagen could result in preferential diffusion that is parallel to the muscle fiber orientation, reflected in an increased FA. Since there is no significant relationship between FA and muscle volume, these measures potentially provide unique insights into underlying structural pathology. Therefore, both of these macroscopic and microscopic measures are suggestive of underlying maladaptive mechanisms in muscle structure related to atypical PT ultimately resulting in hand impairment. Future work will expand on these measures and investigate the difference between the functional measures of paretic and non-paretic muscles in CP and their relationship to the imaging metrics proposed here. This work provides the potential for evaluating altered biomechanical properties using non-invasive imaging methods in the clinic.Acknowledgements
This work was done in part with the support of NIH grants R01NS058667, R01NS126509, and predoctoral training fellowships T32EB009406 to AH and F31HD110236 to DJ. We thank Marie Wasielewski, Donny Nieto, and Rachael Young for their assistance in MR imaging. We thank Nicholas Buto, Maya Harkavy, Jocelyn Kahn, and Jeffrey Yu for their assistance in MRI anatomical identification and segmentation.References
- Vaz DV, Cotta M, Fonseca ST, De Melo Pertence AE. Muscle stiffness and strength and their relation to hand function in children with hemiplegic cerebral palsy. Dev Med Child Neurol 2007;48:728–33. https://doi.org/10.1111/J.1469-8749.2006.TB01357.X.
- Berry DB, Regner B, Galinsky V, Ward SR, Frank LR. Relationships between tissue microstructure and the diffusion tensor in simulated skeletal muscle. Magn Reson Med 2018;80:317–29. https://doi.org/10.1002/mrm.26993.
- Yam WKL, Leung MSM. Interrater reliability of modified ashworth scale and modified tardieu scale in children with spastic cerebral palsy. J Child Neurol 2006;21:1031–5. https://doi.org/10.1177/7010.2006.00222.
- Smith SM, Jenkinson M, Woolrich MW, Beckmann CF, Behrens TEJ, Johansen-Berg H, et al. Advances in functional and structural MR image analysis and implementation as FSL. Neuroimage 2004;23:208–19. https://doi.org/10.1016/j.neuroimage.2004.07.051.
- Binder-Markey BI, Murray WM, Dewald JPA. Passive Properties of the Wrist and Fingers Following Chronic Hemiparetic Stroke: Interlimb Comparisons in Persons With and Without a Clinical Treatment History That Includes Botulinum Neurotoxin. Front Neurol 2021;12:. https://doi.org/10.3389/FNEUR.2021.687624.
- D’souza A, Bolsterlee B, Lancaster A, Herbert RD. Muscle architecture in children with cerebral palsy and ankle contractures: an investigation using diffusion tensor imaging. Clin Biomech 2019;68:205–11. https://doi.org/10.1016/j.clinbiomech.2019.06.013.
- Booth CM, Cortina-Borja MJF, Theologis TN. Collagen accumulation in muscles of children with cerebral palsy and correlation with severity of spasticity. Dev Med Child Neurol 2001;43:314–20. https://doi.org/10.1111/J.1469-8749.2001.TB00211.X.
- Kihara T, Ito J, Miyake J. Measurement of Biomolecular Diffusion in Extracellular Matrix Condensed by Fibroblasts Using Fluorescence Correlation Spectroscopy. PLoS One 2013;8:. https://doi.org/10.1371/JOURNAL.PONE.0082382.
Figures
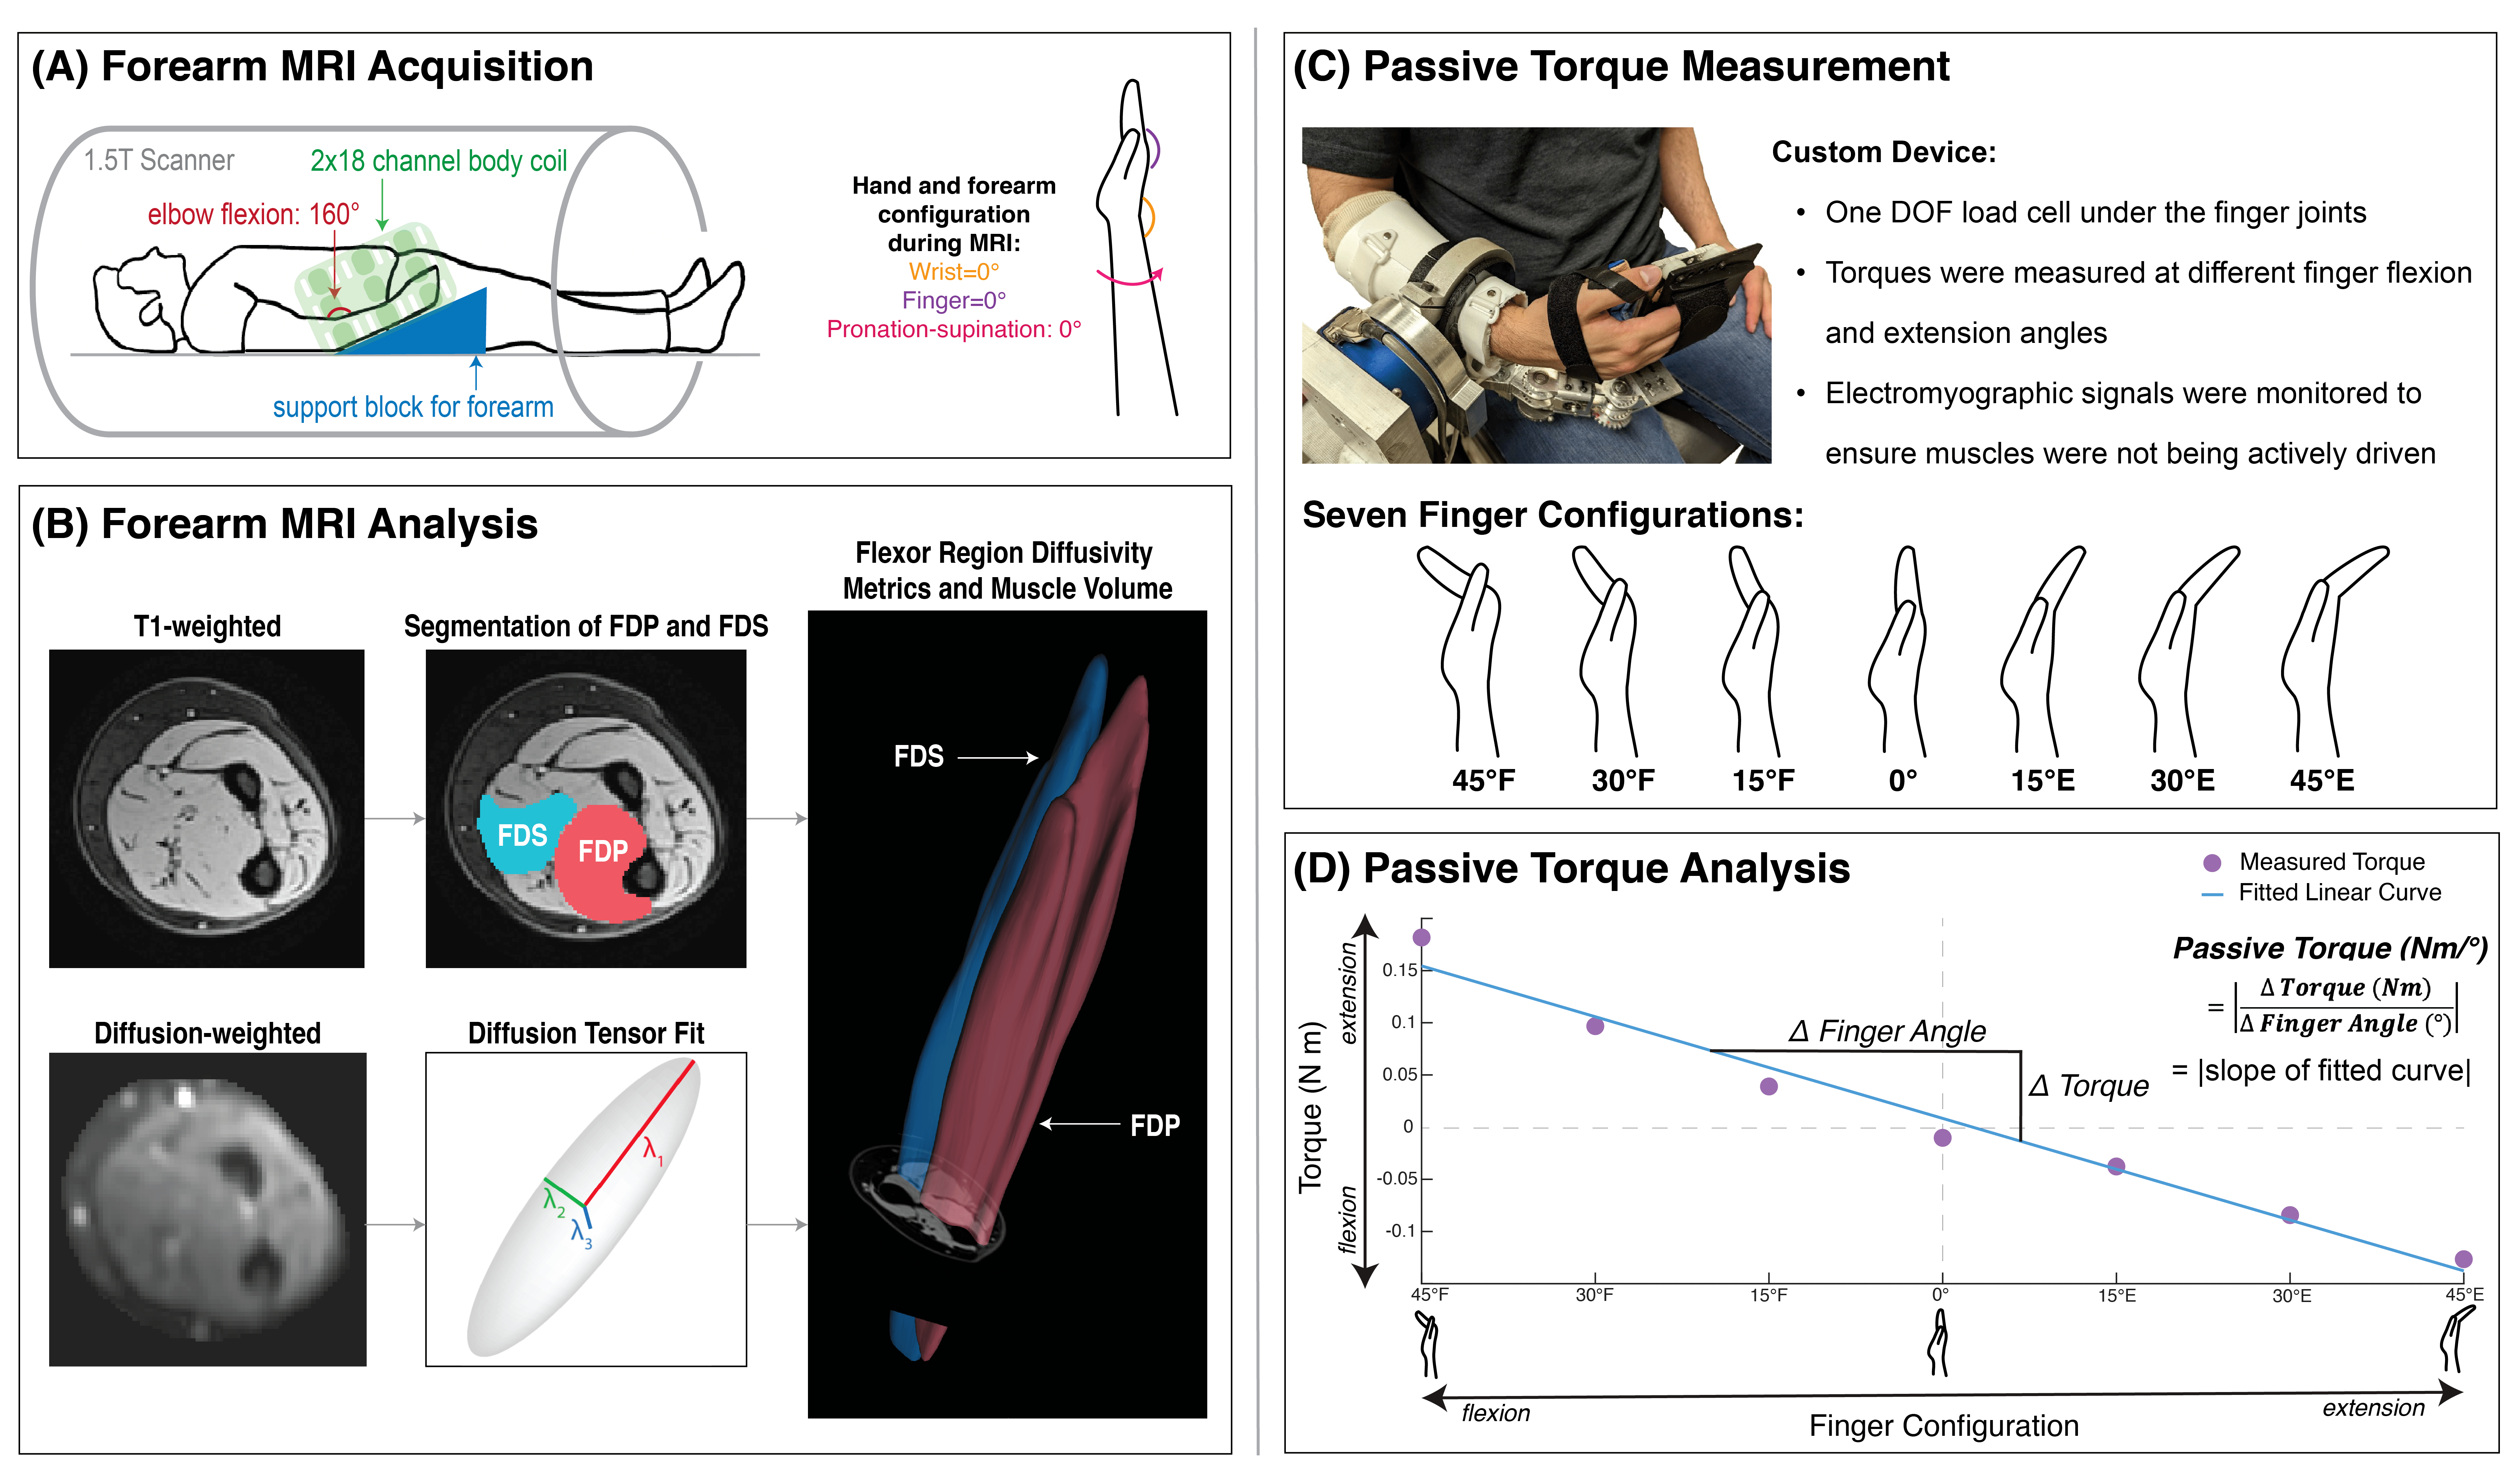
Figure 1. (A) Subject positioning in 1.5T MR scanner with 2x18 channel body coil around the forearm, with the hand and fingers placed in an MRI-safe orthosis to hold the wrist at 0°, fingers at 0°, and forearm pronation-supination at 0°. (B) MR data preprocessing, including segmentation from T1 images and diffusion tensor estimation from dMR volumes. (C) Experimental setup for passive torque measurement and schematic of finger configurations tested. (D) Calculation of passive torque, the slope of a line fitted to the passive torques measured at each finger configuration.
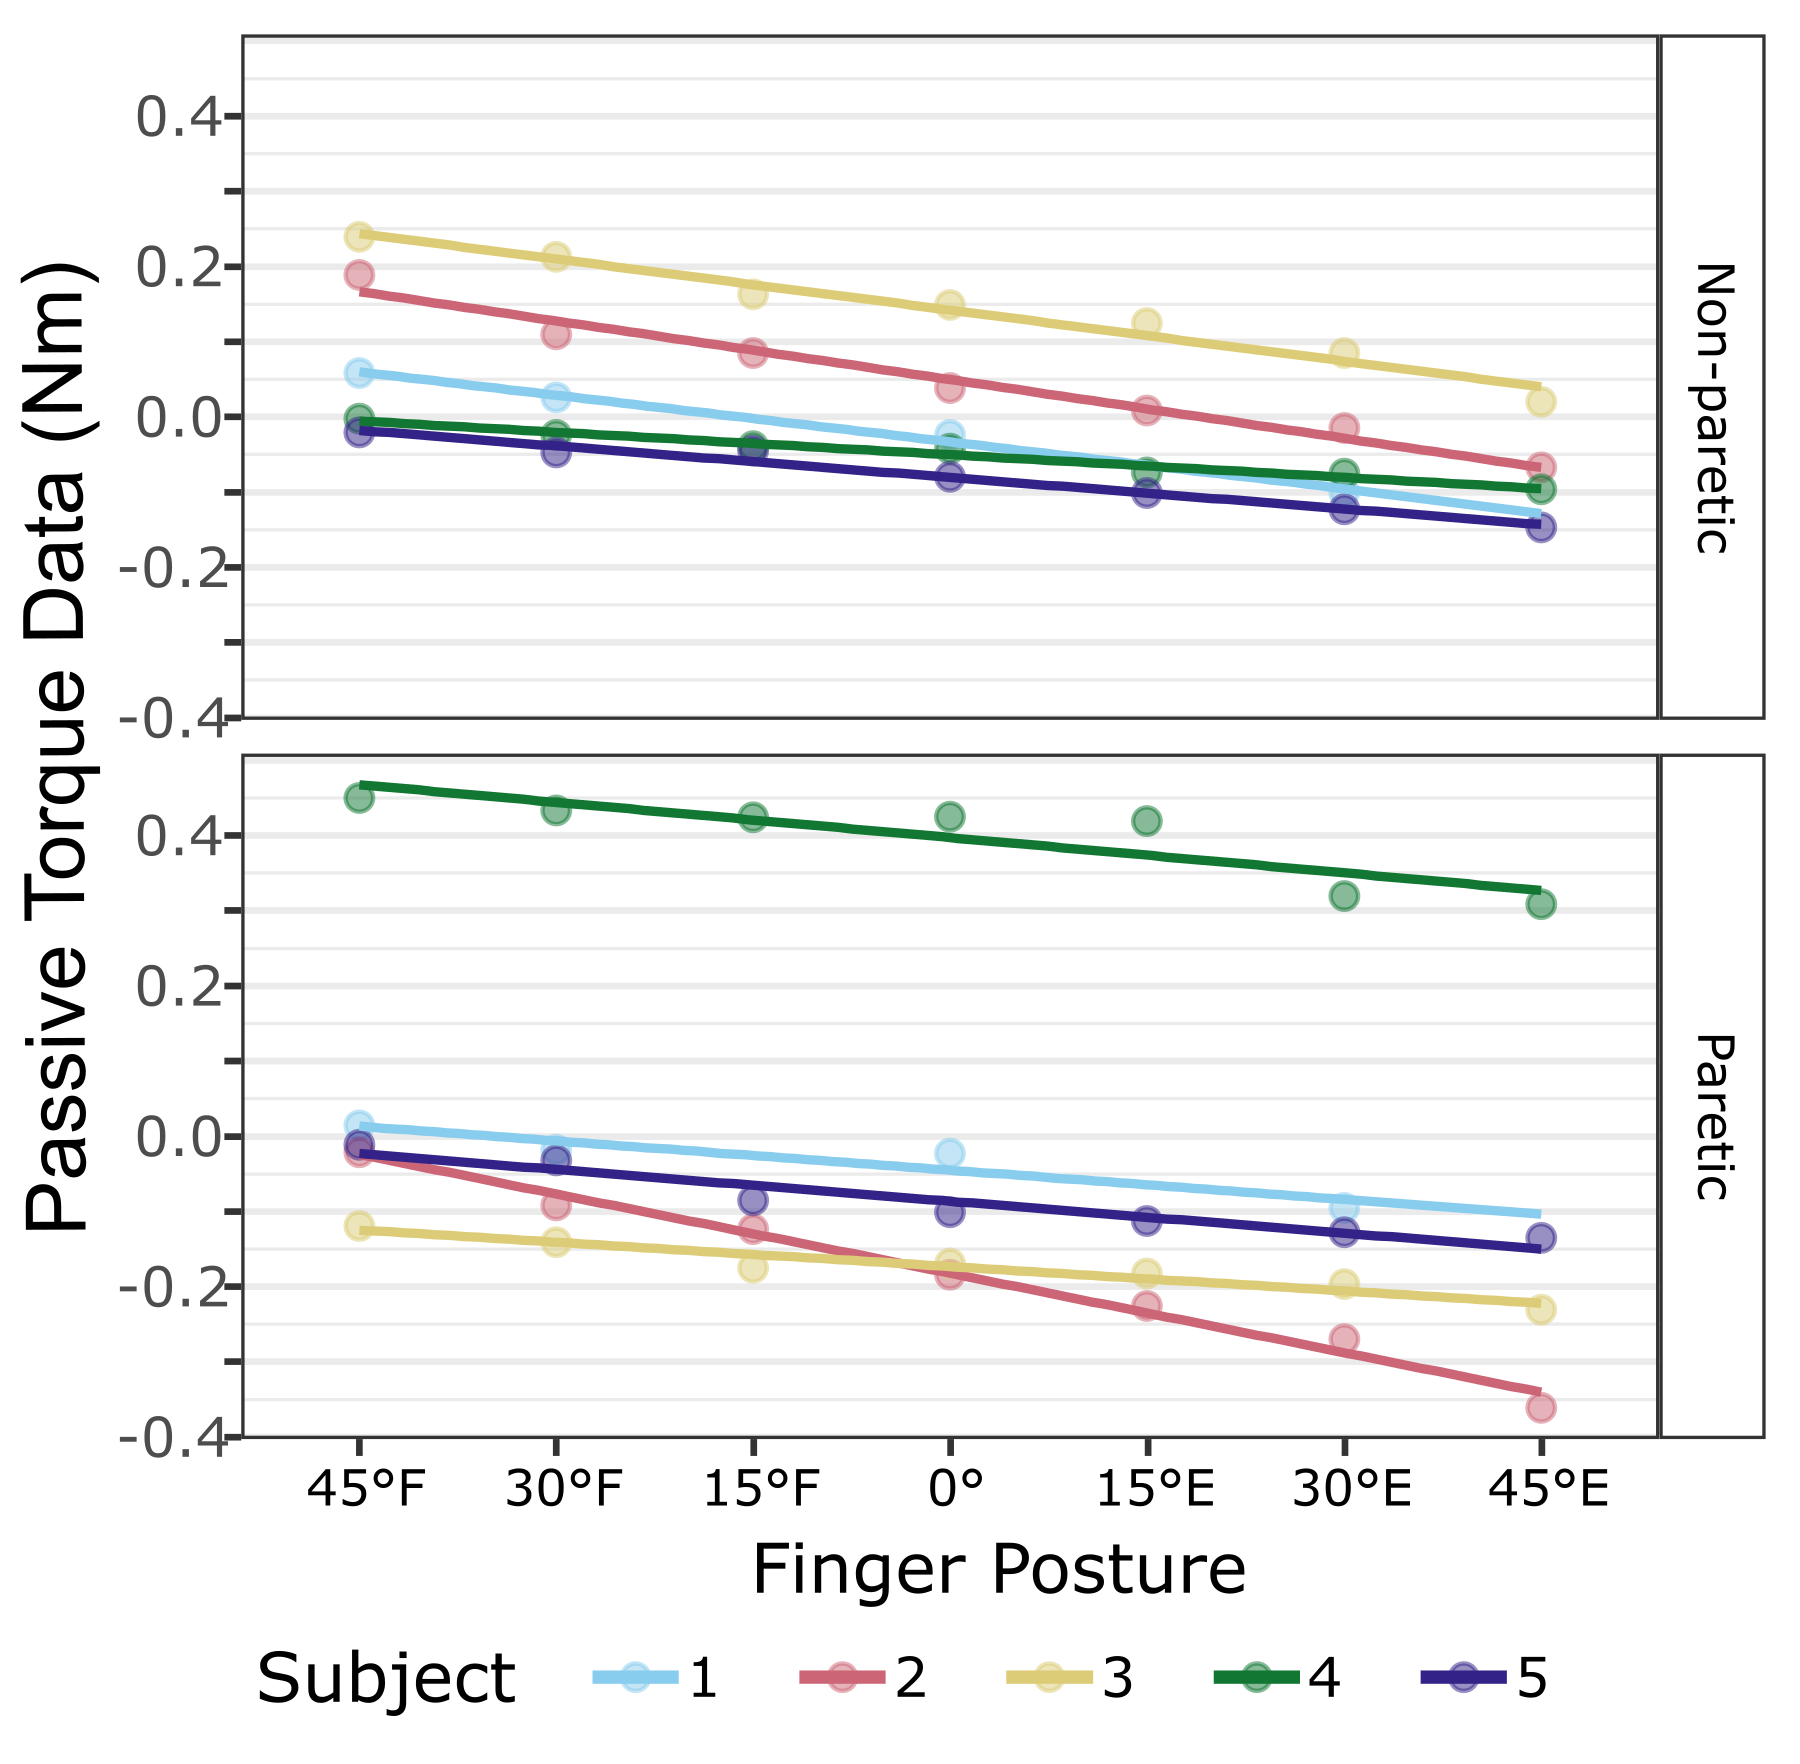
Figure 2. Passive torque data (Nm) at each finger joint configuration in the non-paretic (top) and paretic (bottom) arms across the study cohort.
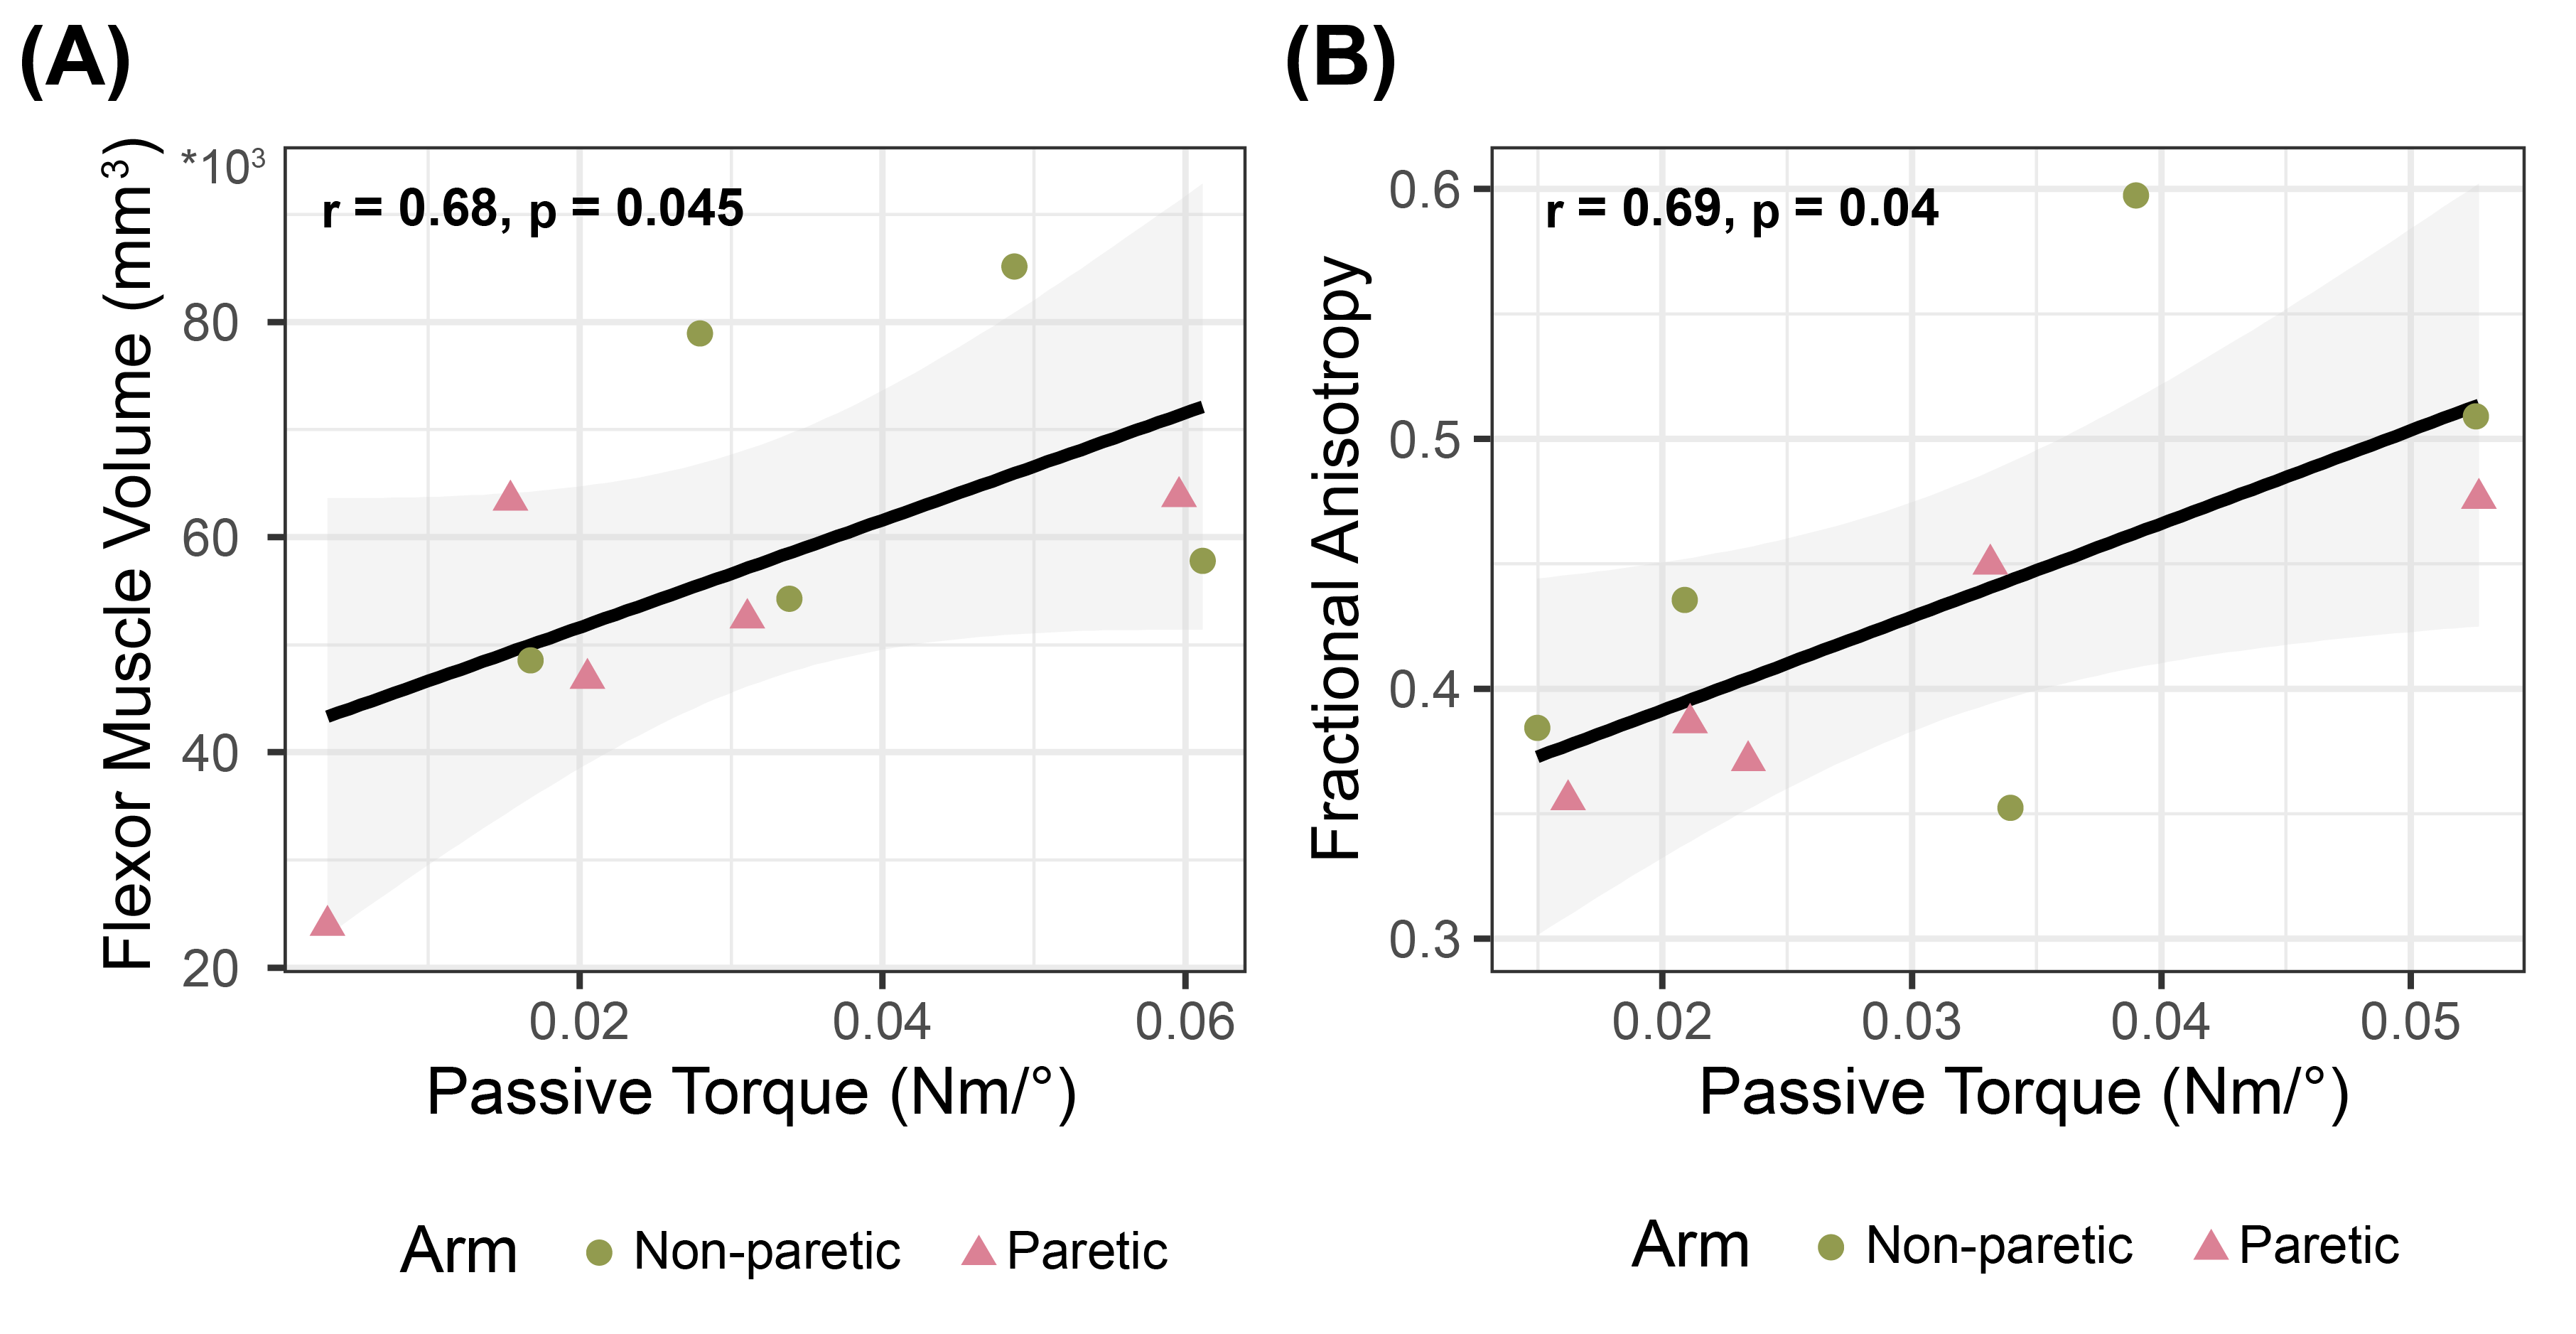
Figure 3. (A) Flexor muscle volume (mm3) versus passive torque measures for each arm in each participant. (B) Passive torque (Nm/°) versus fractional anisotropy measures for each arm in each participant. (C) Fractional anisotropy versus flexor muscle volume (mm3) for each arm in each participant. (A-C) Green circles represent non-paretic arm data, while pink triangles represent paretic arm data. Pearson correlation coefficient r and resulting p-values are shown with fitted regression (black) confidence interval (grey) for both arms.
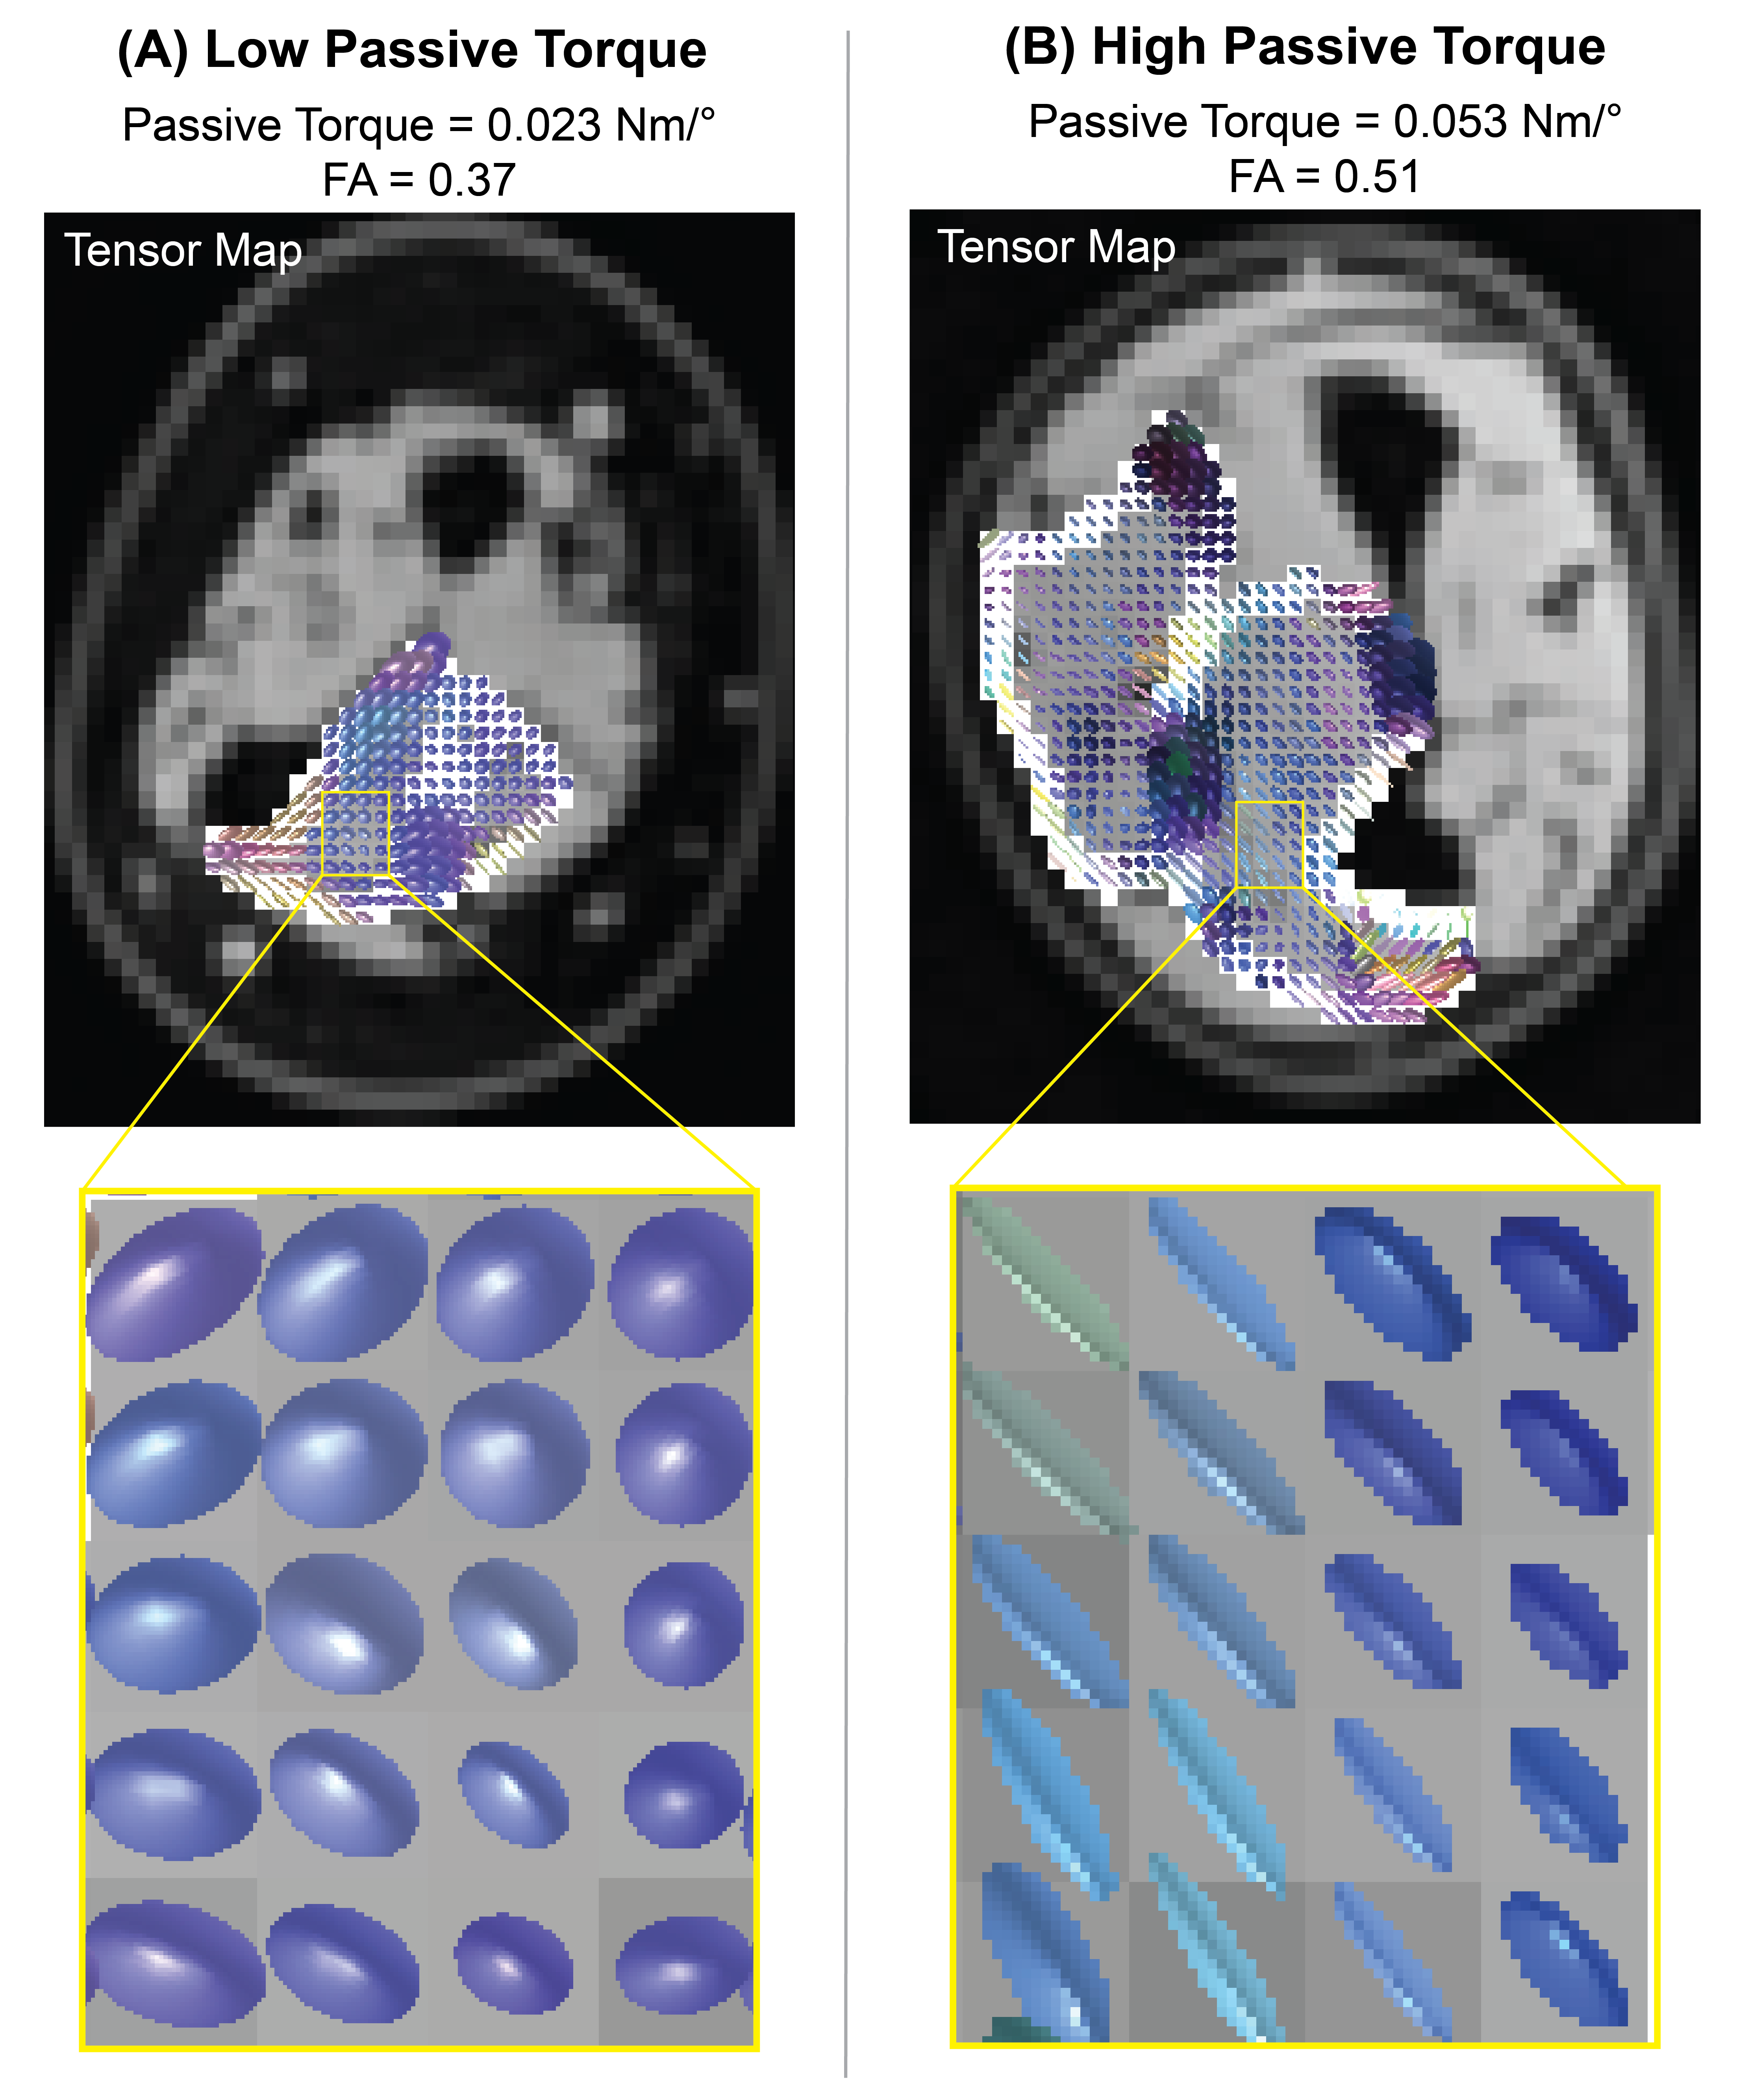
Figure 4. Diffusion tensor maps overlaid on the finger flexor muscles, in cases of (A) low and (B) high passive torque. Tensor maps across the image (top row) and in a zoomed in version (bottom row) show representations of the fitted diffusion tensor at each voxel, where spherical tensors represent relatively isotropic voxels and ellipsoidal tensors represent relatively anisotropic voxels.