5059
A prospective cohort study of Nusinersen in the treatment of spinal muscular atrophy in children with type 2 and 3 on quantitative muscle MRI1Shenzhen Children's Hospital, Shenzhen, China, 2Shenzhen Pediatrics Institute of Shantou University Medical College, Shenzhen, China, 3China Medical University, Shenzhen, China, 4Philips Healthcare, Guangzhou, China, 5Philips Healthcare, Hongkong, China
Synopsis
Keywords: Muscle, Pediatric, neuromuscular disease
Motivation: A biomarker to assess the efficacy of Nusinersen is needed as it enhances motor function and prolongs survival in SMA patients.
Goal(s): We investigated whether qMRI could monitor the efficacy of Nusinersen in the treatment of SMA.
Approach: Patients underwent measurements of thigh qMRI (mDixon-Quant, T2 mapping and DTI) and Hammersmith Functional Motor Scale Expanded (HFMSE) before and after nusinersen treatment, X-ray exams to obtain Cobb angle were performed at baseline.
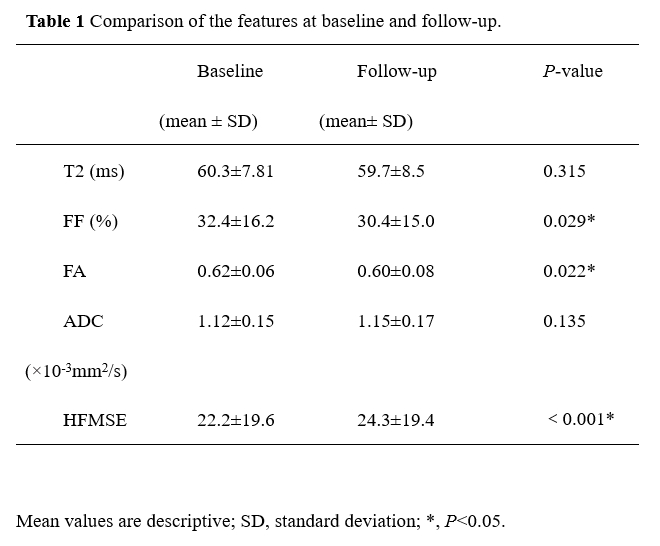
Results: After treatment, the mean thigh FF and FA decreased over time, and the HFMSE increased, while T2 values and ADC remain stable.
Impact: qMRI can evaluate the treatment outcomes of SMA patients. The younger patients with less scoliosis more likely to have minimumclinically
significant difference at 6 months after treatment.
Introduction
Spinal muscular atrophy (SMA) treatment has improved dramatically. Nusinersen has demonstrated its potential in enhancing motor function and significantly prolonging survival time among individuals diagnosed with SMA [1, 2]. Quantitative MRI (qMRI) can reflect the characteristics of muscle microstructure, and has become an important tool for the diagnosis and efficacy evaluation of neuromuscular diseases [3, 4]. Thus, in this study, we investigated whether qMRI could monitor the efficacy of Nusinersen in the treatment of SMA and explored factors that might predict response to treatment.Methods
All of the 28 children with SMA underwent thigh qMRI scanning and motor function scoring before and 6 months after treatment, and 4 of them did not undergo T2 mapping scanning. All MRI scans were performed on the 3.0T MR System (Philips, Ingenia, The Netherlands) using a 16-element receiver RF coil. ROIs were drawn circumferentially around each muscle at the level of the maximum cross-sectional area using a freehand technique. All patients underwent measurements of pelvic and thigh qMRI using fat quantification technique mDixon-Quant for fat fraction (FF), T2 mapping and diffusion tensor imaging (DTI) for fractional anisotropy (FA) and Apparent diffusion coefficient (ADC). For qMRI parameters were individually measured for the thirteen thigh muscles. Differences in Hammersmith Functional Motor Scale Expanded (HFMSE) scores and qMRI parameters before and after treatment were tested using the paired T/Wilcoxon signed-rank test by SPSS version 25.0, and the independent T/Mann-Whitney U test was used to compare baseline data in patients with and without minimum smallest clinically significant difference (MCID) [5-8].Results
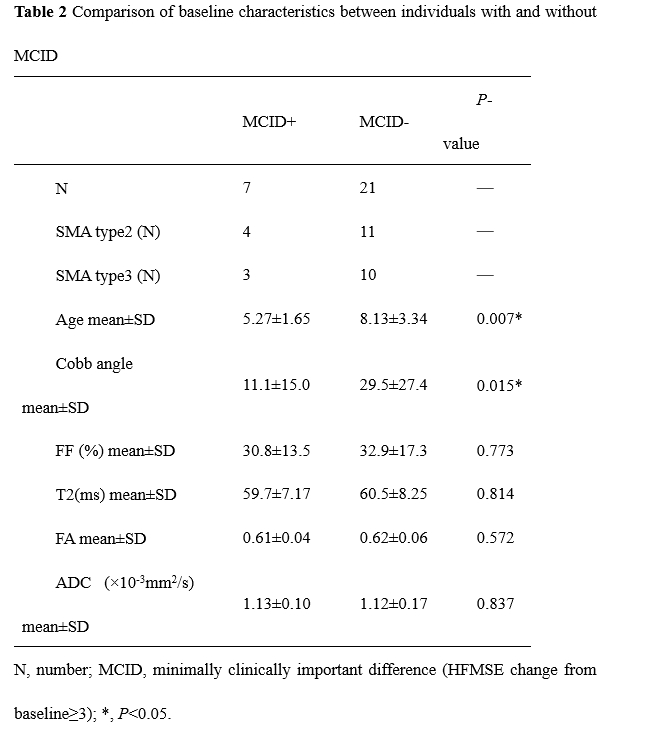
Table 1 shows a comparison of features at baseline and follow-up. After 6 months of treatment in 28 patients with SMA, the mean thigh FF and FA decreased over time, and the HFMSE significantly increased, while T2 values and ADC remain stable. We compared HFMSE score changes between individuals with and without MCID. The comparison of baseline characteristics between individuals with and without MCID is shown in Table2.Discussion
Intramuscular fat infiltration is one of the main pathological manifestations of SMA, hence we used mDixon-Quant technique to obtain FF for quantifying the degree of fat replacement. These differences might reflect nusinersen improved the motor function of the SMA patients. The mean thigh FF slowly increased at a probability of 5% per year during the natural course of SMA [9, 10]. Our results showed a significant reduction in FF, suggesting that the treatment was effective in delaying fat infiltration of the muscle. T2 values can reflect pathophysiological changes such as skeletal muscle oedema [11, 12]. On the other hand, the mean thigh T2 value change was not statistically significant, which, like the OTTO results [13], may be related to the fact that muscle denervation in SMA patients often leads to changes in both fat and water content, both of which increase T2 relaxation time. DTI reflects the diffusion characteristics of water molecules in muscle tissue by calculating FA and ADC [14]. Our study found that FA decreased over time, possibly indicating that nusinersen inversely increases the number of muscle fibers. Nonetheless, there is no significant alteration in the mean thigh ADC from baseline to six months, and thus it may not necessarily indicate the treatment effectively reduced cell atrophy [13]. Baseline age correlated with the degree of motor functional improvement in patients with SMA after nusinersen treatment, which highlights the importance of early diagnosis and treatment to achieve the maximum effect of nusinersen. There was a significant difference in baseline age and Cobb angle between individuals with MCID and those without MCID. We can infer that children with SMA who were younger at the time of treatment and had less severe scoliosis at baseline were more likely to have MCID. This highlights the importance of early diagnosis and treatment to maximize the efficacy of nusinersen.Conclusion
FF, FA, T2 values and HFMSE can evaluate the treatment outcomes of SMA patients. The younger patients with less scoliosis are more likely to have MCID at 6 months after treatment.Acknowledgements
This article was supported by the Sanming Project of Medicine in Shenzhen (SZSM202011005).References
1.De Vivo DC, Bertini E, Swoboda KJ et al. Nusinersen initiated in infants during the presymptomatic stage of spinal muscular atrophy: Interim efficacy and safety results from the Phase 2 NURTURE study. Neuromuscul Disord 2019; 29: 842-856. DOI: 10.1016/j.nmd.2019.09.007
2.Darrow JJ, Sharma M, Shroff M et al. Efficacy and costs of spinal muscular atrophy drugs. Sci Transl Med 2020; 12. DOI: 10.1126/scitranslmed.aay9648
3.Bonati U, Schmid M, Hafner P et al. Longitudinal 2-point dixon muscle magnetic resonance imaging in becker muscular dystrophy. Muscle Nerve 2015; 51: 918-921. DOI: 10.1002/mus.24629
4.Wokke BH, Van Den Bergen JC, Hooijmans MT et al. T2 relaxation times are increased in Skeletal muscle of DMD but not BMD patients. Muscle Nerve 2016; 53: 38-43. DOI: 10.1002/mus.24679
5.Morrow JM, Sinclair CDJ, Fischmann A et al. MRI biomarker assessment of neuromuscular disease progression: a prospective observational cohort study. The Lancet Neurology 2016; 15: 65-77. DOI: 10.1016/s1474-4422(15)00242-2
6.Shimizu-Motohashi Y, Chiba E, Mizuno K et al. Muscle impairment in MRI affect variability in treatment response to nusinersen in patients with spinal muscular atrophy type 2 and 3: A retrospective cohort study. Brain Dev 2023; 45: 161-170. DOI: 10.1016/j.braindev.2022.11.002
7. Mercuri E, Darras BT, Chiriboga CA et al. Nusinersen versus Sham Control in Later-Onset Spinal Muscular Atrophy. N Engl J Med 2018; 378: 625-635. DOI: 10.1056/NEJMoa1710504
8.Mercuri E, Finkel R, Montes J et al. Patterns of disease progression in type 2 and 3 SMA: Implications for clinical trials. Neuromuscul Disord 2016; 26: 126-131. DOI: 10.1016/j.nmd.2015.10.006
9.Coratti G, Pera MC, Montes J et al. Different trajectories in upper limb and gross motor function in spinal muscular atrophy. Muscle Nerve 2021; 64: 552-559. DOI: 10.1002/mus.27384
10.Figueroa-Bonaparte S, Llauger J, Segovia S et al. Quantitative muscle MRI to follow up late onset Pompe patients: a prospective study. Sci Rep 2018; 8: 10898. DOI: 10.1038/s41598-018-29170-7
11. Carlier PG. Global T2 versus water T2 in NMR imaging of fatty infiltrated muscles: different methodology, different information and different implications. Neuromuscul Disord 2014; 24: 390-392. DOI: 10.1016/j.nmd.2014.02.009
12. Sprenger-Svacina A, Haensch J, Weiss K et al. MRI correlates of motoneuron loss in SMA. J Neurol 2023; 270: 503-510. DOI: 10.1007/s00415-022-11326-1
13. Otto LAM, Froeling M, van Eijk RPA et al. Quantification of disease progression in spinal muscular atrophy with muscle MRI-a pilot study. Nmr in Biomedicine 2021; 34. DOI: ARTN e4473 10.1002/nbm.4473
14. Forsting J, Rehmann R, Rohm M et al. Evaluation of interrater reliability of different muscle segmentation techniques in diffusion tensor imaging. NMR Biomed 2021; 34: e4430. DOI: 10.1002/nbm.4430
Figures