5058
The Quantitative Parameters Derived from IDEAL-IQ in the Lumbar Vertebrae of Healthy Children: A Pilot Study of Bone Development1Children’s Hospital of Shanxi, Women Health Center of Shanxi, Taiyuan, China, 2The Second Hospital of Shanxi Medical University, Taiyuan, China
Synopsis
Keywords: Normal Development, Microstructure
Motivation: Early childhood bone development affects that of bone disease in adolescence and adulthood. Many diseases can affect the cancellous bone or bone marrow. Therefore, it is of great significance to quantify the bone development of healthy children.
Goal(s): To quantify the normal bone development and provide a basis for further studies focusing on diseases involving lumbar vertebrae.
Approach: This study was conducted to quantify the fat and cancellous bone content of lumbar vertebrae in healthy children based on IDEAL-IQ.
Results: As the age increased, the average PDFF and R2* both increased significantly. No association was found between the gender and PDFF, R2*.
Impact: As the age increased, the average PDFF and R2* of lumbar vertebrae both increased significantly in healthy children. These findings will probably improve our understanding of the bone development and enable differential diagnosis other diseases of children’s bone.
Introduction
Whether the bone development is normal or not in early childhood affects the likelihood of that of bone disease in adolescence and adulthood(1,2). Furthermore, the trabecular bone and bone marrow change under pathological conditions(2). How to accurately judge the bone development of children and promote pediatric bone development should be comprehensively explored.The evaluation methods of bone development in children include bone age (BA) assessment and dual-energy X-ray bone mineral densitometry (DXA), both of which have strong subjectivity. The BA evaluation methods (G&P mapping, TW scoring, China 05 method) are heavily subjective and the standard is difficult to master(3,4). DXA is unable to distinguish the quality differences between bone cortex and trabecular bone. A study found that the accuracy of DXA detection in infants under 3 years is not high(5).The evaluation methods of bone marrow development and diseases, such as bone aspiration and bone biopsy, are invasive.
Although magnetic resonance imaging (MRI) is a non-invasive method, the performance of children’s bone marrow in conventional T1-weighted imaging (T1WI) varies with age and location. The conventional MRI cannot accurately distinguish whether the bone development is normal or not. IDEAL-IQ was derived from mDIXON technology. It provided a new approach for quantitative analysis of the cancellous bone and the fat content in bone marrow(6-7). The R2* refers to the reciprocal of T2* which reflects the cancellous bone content(7). And previous studies have shown that the detection results of PDFF by MRI are highly consistent with the pathological results with good repeatability (8,9). So IDEAL-IQ can simultaneously study the cancellous bone and the bone marrow development.
Methods
Our study enrolled healthy children between January 2022 to December 2022 consecutively in Children’s Hospital of Shanxi. The inclusion criteria were as follows: 1) age ≤18 years; 2) no contraindications (surgical and interventional devices for ferromagnetic materials, cardiac implantable electronic devices, cochlear implants, insulin pumps, dental implants containing metal or alloy) to magnetic resonance imaging (MRI) scan. The exclusion criteria were as follows: 1) previous malignant disease, 2) previous chemoradiotherapy, 3) previous spine surgery, 4) previous or acute vertebral compression fracture, 5) artifacts present in images. Participants underwent MRI scans using IDEAL-IQ sequence in the lumbar vertebrae. The IDEAL-IQ parameters (proton density fat fraction [PDFF], 1/T2* [R2*]) were obtained. The factor analysis of variance (ANOVA) was applied to compare the differences of PDFF and R2* in different lumbar vertebral groups. The Kruskal–Wallis H test or Mann–Whitney U test was applied to compare the differences of quantitative data among different gender or age groups. Spearman correlation analysis was applied to study the relationship among the age, PDFF, and R2*.Results
A total of 145 participants (76 male, 69 female) were evaluated. There were no significant differences in PDFF and R2* of different lumbar vertebrae (PPDFF=0.338, PR2*=0.868). The average age was 36 (13–72) months. They were assigned into 4 groups (0–11 months, 12–35 months, 36–71 months, and 72–144 months). As the age increased, the average PDFF and R2* both increased significantly (rPDFF=0.659, rR2*=0.359, P<0.001). There were significant statistical differences in PDFF and R2* between the 4 age groups (ZPDFF=46.651, ZR2*=27.537, P<0.001). Moreover, the PDFF was also positively correlated with R2* (r=0.576, P<0.001). No association was found between the gender and PDFF, R2*(PPDFF=0.949, PR2*=0.177).Conclusion
As the age increased, the average PDFF and R2* of lumbar vertebrae both increased significantly in healthy children. These findings will probably improve our understanding of the bone development and enable differential diagnosis other diseases of children’s bone. In our next research, we will explore the microstructural changes in the skeletal tissue of children with leukemia.Acknowledgements
The authors are accountable for all aspects of the work in ensuring that questions related to the accuracy or integrity of any part of the work are appropriately investigated and resolved. The study was conducted in accordance with the Declaration of Helsinki (as revised in 2013). This study was approved by the local ethics committee of Children’s Hospital of Shanxi (No. IRB-KYYN-2022-010) and written informed consent was provided by all participants’ parents.
References
Figures
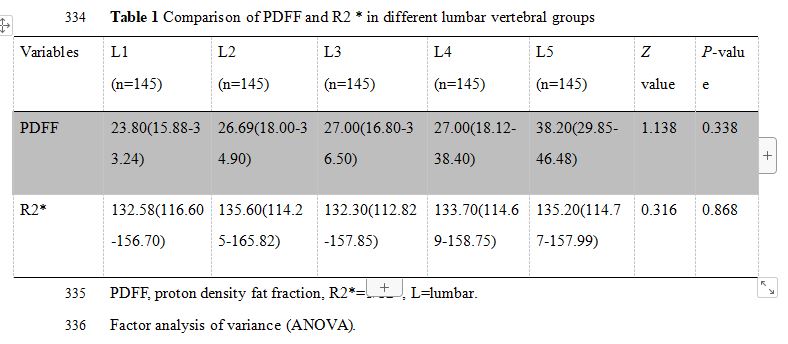
Table 1 Comparison of PDFF and R2 * in different lumbar vertebral groups
Variables | L1 (n=145) | L2 (n=145) | L3 (n=145) | L4 (n=145) | L5 (n=145) | Zvalue | P-value |
PDFF | 23.80(15.88-33.24) | 26.69(18.00-34.90) | 27.00(16.80-36.50) | 27.00(18.12-38.40) | 38.20(29.85-46.48) | 1.138 | 0.338 |
R2* | 132.58(116.60-156.70) | 135.60(114.25-165.82) | 132.30(112.82-157.85) | 133.70(114.69-158.75) | 135.20(114.77-157.99) | 0.316 | 0.868 |
PDFF, proton density fat fraction, R2*=1/T2*, L=lumbar.
Factor analysis of variance (ANOVA).
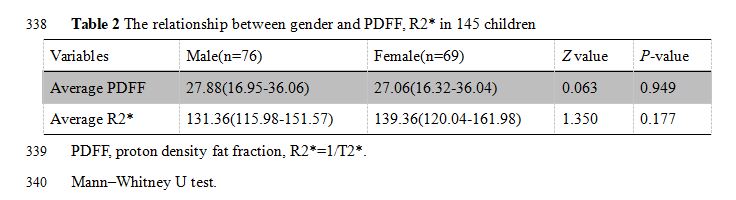
Table 2 The relationship between gender and PDFF, R2* in 145 children
Variables | Male(n=76) | Female(n=69) | Zvalue | P-value |
Average PDFF | 27.88(16.95-36.06) | 27.06(16.32-36.04) | 0.063 | 0.949 |
Average R2* | 131.36(115.98-151.57) | 139.36(120.04-161.98) | 1.350 | 0.177 |
PDFF, proton density fat fraction, R2*=1/T2*.
Mann–Whitney U test.
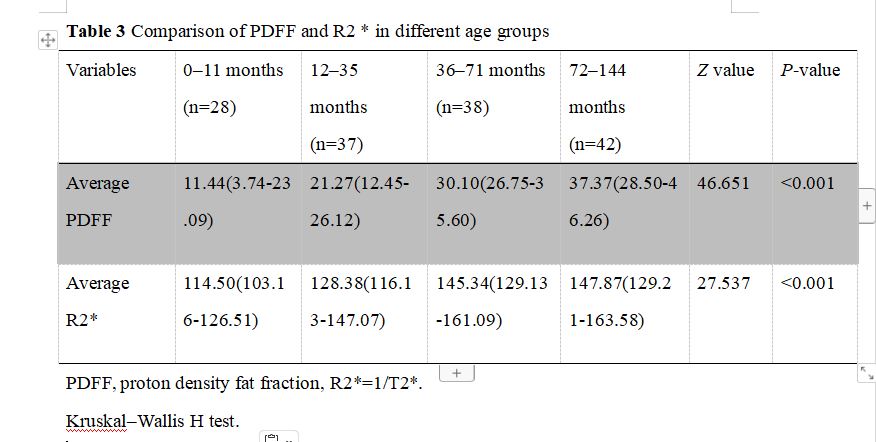
Table 3 Comparison of PDFF and R2 * in different age groups
Variables | 0–11 months (n=28) | 12–35 months (n=37) | 36–71 months (n=38) | 72–144 months (n=42) | Zvalue | P-value |
Average PDFF | 11.44(3.74-23.09) | 21.27(12.45-26.12) | 30.10(26.75-35.60) | 37.37(28.50-46.26) | 46.651 | <0.001 |
Average R2* | 114.50(103.16-126.51) | 128.38(116.13-147.07) | 145.34(129.13-161.09) | 147.87(129.21-163.58) | 27.537 | <0.001 |
PDFF, proton density fat fraction, R2*=1/T2*.
Kruskal–Wallis H test.
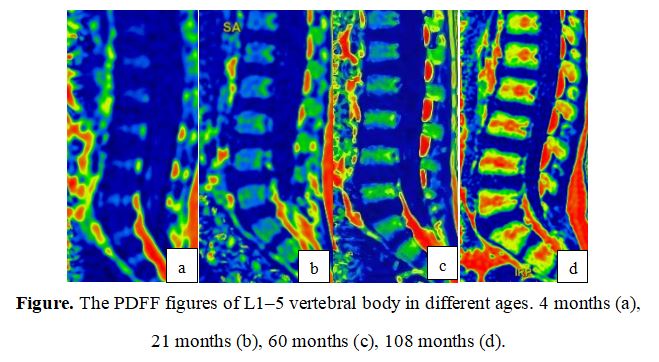


Figure 1. The PDFF figures of L1–5 vertebral body in different ages. ROI (a). 4 months (b), 21 months (c), 60 months (d), 108 months (e).
ROI, region of interest
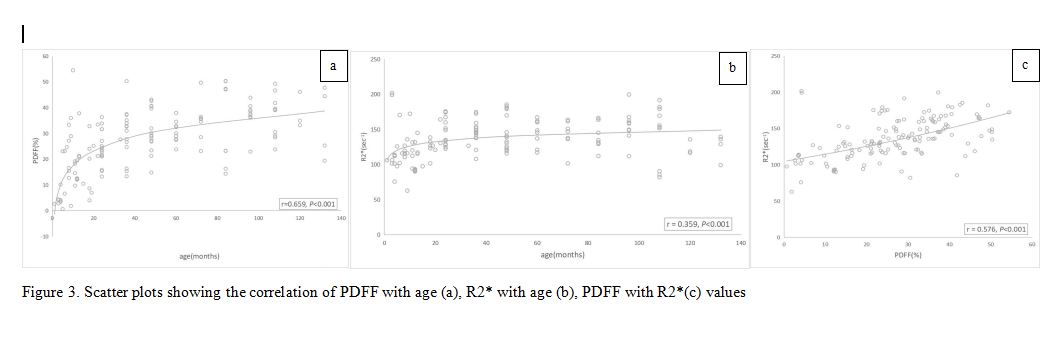


Figure 3. Scatter plots showing the correlation of PDFF with age (a), R2* with age (b), PDFF with R2*(c) values