5053
T2 relaxation times of the thoracic intervertebral discs in children 8 to 10 years old.1Department of Radiology, Image Sciences Institute, UMC Utrecht, Utrecht, Netherlands, 2MRIguidance B.V., Utrecht, Netherlands, 3Department of Orthopaedics, UMC Utrecht, Utrecht, Netherlands, 4Department of Biomedical Engineering, Eindhoven University of Technology, Eindhoven, Netherlands
Synopsis
Keywords: MSK, Relaxometry, IVD, Spine, MSK, T2, NP, adolescence
Motivation: T2 relaxation time is a promising biomarker for the hydration and maturation state of the IVD in children, however, very little is known about it.
Goal(s): The goal is to provide the baseline for T2 relaxation times in thoracic IVDs in children.
Approach: T2 relaxometry performed in thoracic IVDs of 10 children.
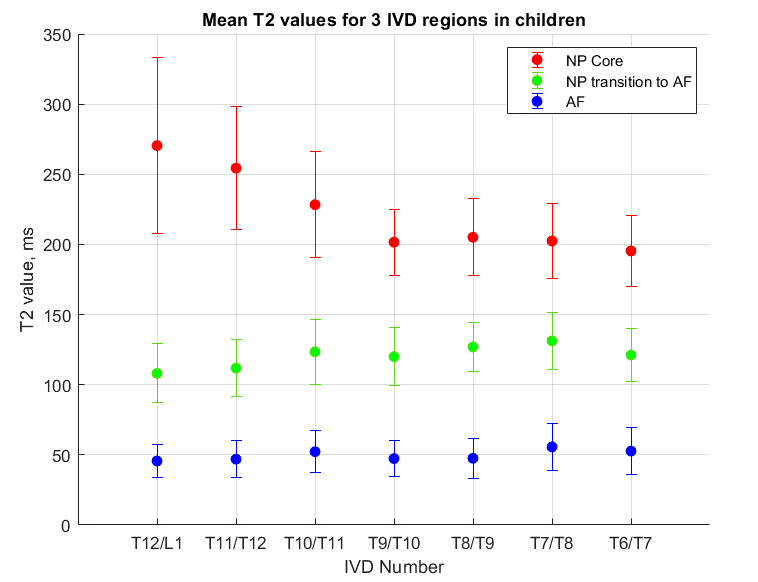
Results: In children: highest T2 values are in the core of Nucleus Pulposus (200-270 ms), T2 values in the Nucleus Pulposus - Annulus Fibrosus transition zone (110-130 ms) are more similar to those in adult NP tissue. This result is consistent with higher water content expected in pediatric vs. adult NP tissue.
Impact: T2 values of healthy subjects can be used for the assessment of IVDs in children, opening new avenues to monitor developmental spine disease, research lower back pain as well as potential treatments.
Introduction
Traditionally, clinical MRI of the intervertebral disc (IVD) is performed for adults to assess IVD degeneration or injury as a source for back pain. In addition to routine contrast weighted clinical scans, transverse relaxation time (T2) mapping can be performed to evaluate the IVDs because T2 values have been shown to correlate with disc degeneration1-6, water content 1,7,8, and reflect the molecular environment in the IVD, e.g. protein, collagen, and fat 8-10.While the majority of research concerns adult, T2 mapping of intervertebral discs in a pediatric population could serve as a valuable method for the evaluation of intervertebral disc hydration and could be useful to assess status of the IVD in conditions like scoliosis. To our knowledge, there are only a few articles reporting changes in T2 relaxation times associated with maturation of the IVDs in lumbar spine in a few children, from Krueger et al.11 in three healthy children (6, 3, and 0.75 years old), and Tertti et al.12, in cadaver spines of three 7-year old children.
The purpose of this study therefore was to provide a baseline for T2 relaxation time data (at 1.5T ) for thoracic intervertebral discs in children 8 to 10 years old.
Methods
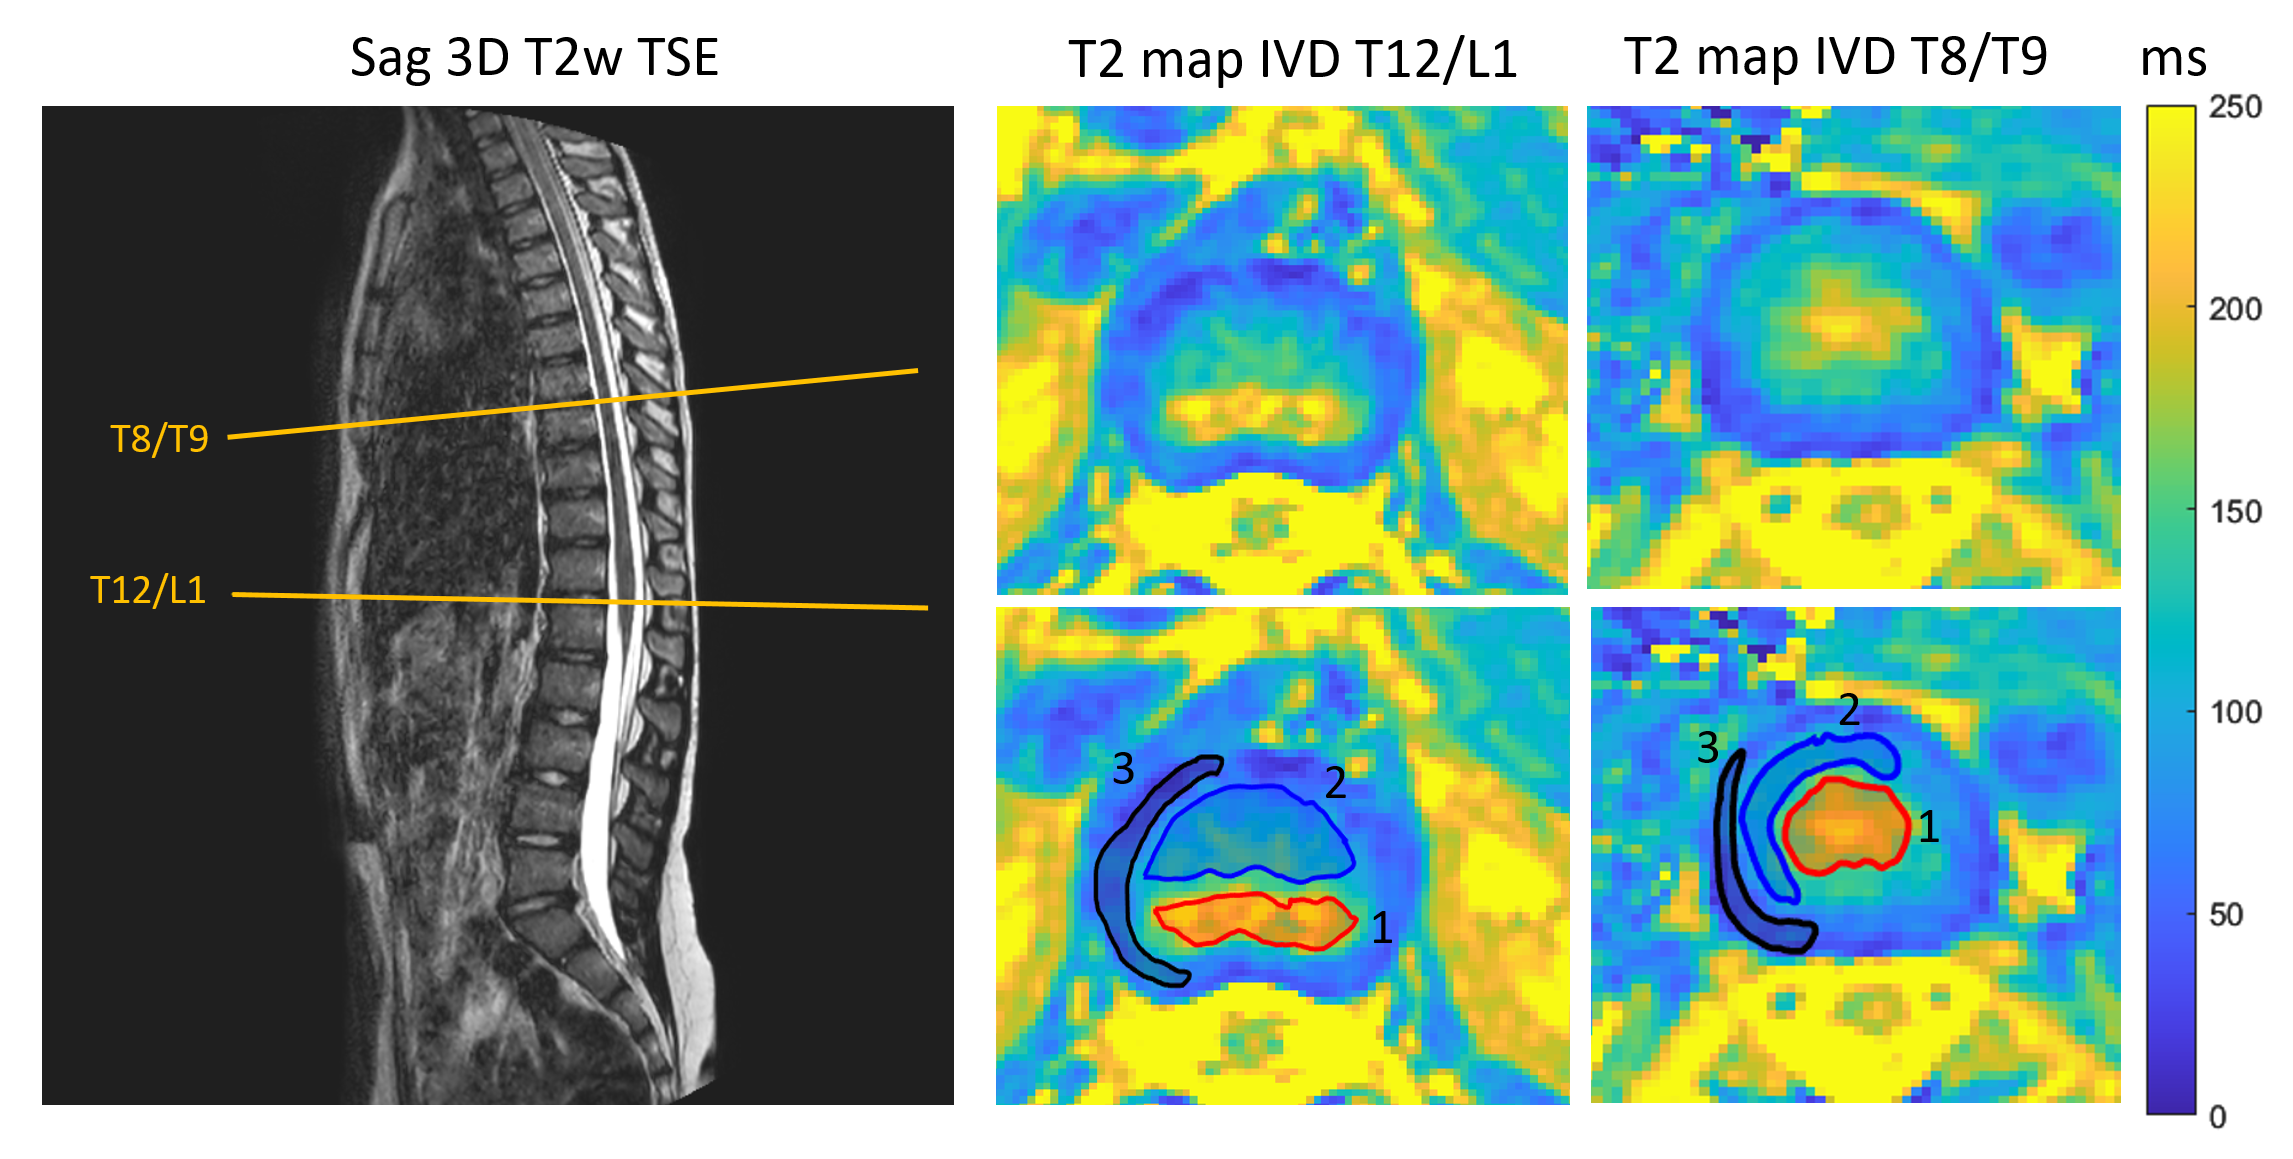
The study included 10 healthy children (age range 8-10 y.o). All subjects were included as part of the EarlyBird study, investigating spinal growth in a healthy population with an increased risk of developing scoliosis (IRB approved, METC number 22-999). Written informed consent was obtained from the participant as well as a legal guardian. All study participants underwent thoracolumbar MRI scanning on a 1.5T Philips scanner (Philips Healthcare, Best, NL). The imaging protocol included a T2 mapping sequence with the following MR protocol parameter settings: Axial Multi-Echo TSE with FOV APxRL 280x280 mm2, slice thickness 4 mm, acquisition voxel size 1.5x1.5x4 mm3, reconstruction voxel size 0.8x0.8x4 mm3, TSE factor 18, 6 echoes, FA 90˚, TR = 2500 ms, TE = [8.6 ms, 21.6 ms, 34.6 ms, 47.6 ms, 60.6 ms, 73.6 ms], phase encoding direction RL, NSA 1, 7 slices placed on the IVDs from T12/L1 to T6/T7 in feet-head direction. Acquisition time was 02:38 min. T2 maps were calculated on the MRI host.For the T2 analysis, 3 different regions of interest (ROI) of the IVD were defined: Nucleus Pulposus (NP) split into two regions (core and NP-Annulus Fibrosus (AF) transition), and the external AF region. ROIs were manually drawn in these 3 regions on each slice of the T2 maps. Mean value and the standard deviation were calculated of all voxels in the ROIs.
Results
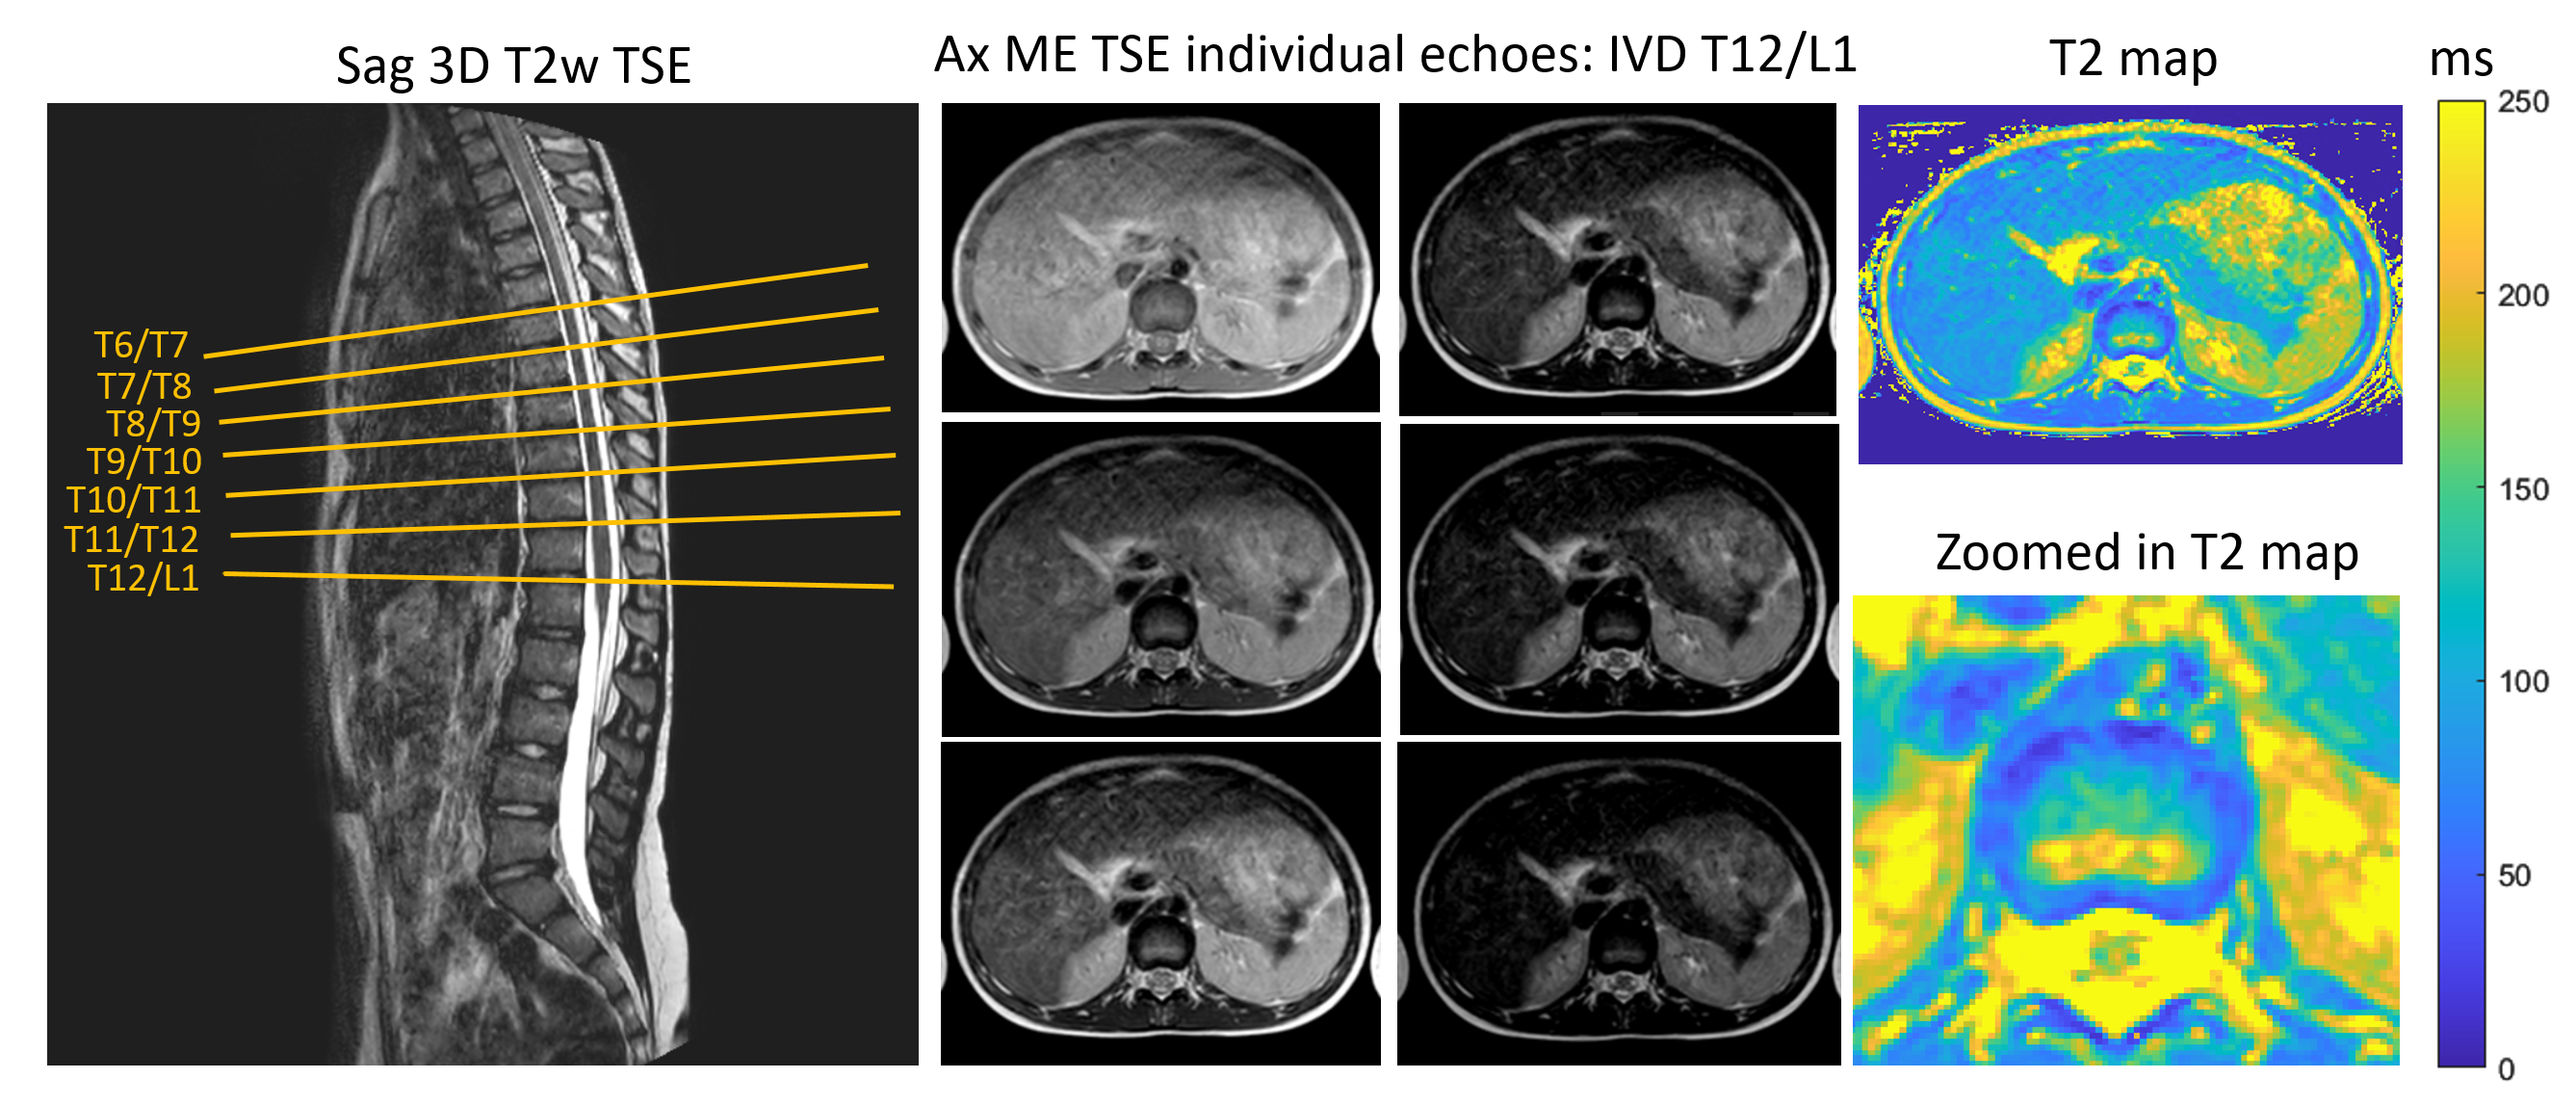
An example of the measurements of one subject is shown in Figure 1. A sagittal T2w TSE is provided as a reference for slice positioning for the individual IVDs. The individual axial ME TSE images are presented for the IVD T12/L1, as well as the calculated T2 map. Examples of 3 ROIs placed in 3 different regions of the IVD are shown in Figure 2 for two IVDs. The mean T2 values and standard deviations (averaged over all subjects) are presented for each IVD in Figure 3. Interestingly, the mean T2 values of 250 ms, calculated in the NP core region in 3 lower IVDs (T12/L1, T11/T12, T10/T12) are greater than the mean T2 value of 201 ms, calculated in 4 higher IVDs (T9/10 – T6/T7), whereas the T2 values calculated in the NP-AF transition zone are slightly lower for two lower IVDs (T12/L1, T11/T12). The T2 values calculated in AF are similar for all the IVDs.Discussion and Conclusions
In this study, we assessed T2 relaxation times (at 1.5T) for 7 thoracic intervertebral discs in 10 children, 8-10 years old. We have observed multiple regions in the IVD with the highest T2 value in the NP core region, and the minimum values in the AF region. The presence of the NP core region, which is in general not symmetrically shaped, might be related to a biological maturation process transitioning from a notochordal rich tissue, or a partial volume effect, which is the subject of future research. The reported values in the NP transition area are in agreement with literature, reporting T2 relaxation times in the NP in lumbar IVDs in adults1,3,13, however the regions with high T2 values in the core of NP might be a specific age-related feature observed only in children.Acknowledgements
This research was financially supported by the European Research Council (Grant no: 101020004).References
1. Takashima et al. Correlation between T2 relaxation time and intervertebral disk degeneration. DOI: 10.1007/s00256-011-1144-0
2. Yang et al. T1ρ, T2 and T2* mapping of lumbar intervertebral disc degeneration: a comparison study. doi: 10.1186/s12891-022-06040-y
3. Marinelli et al. T2 Relaxation Times Correlated with Stage of Lumbar Intervertebral Disk Degeneration and Patient Age. DOI: https://doi.org/10.3174/ajnr.A2080
4. Huang et al. Correlation between T2* (T2 star) relaxation time and cervical intervertebral disc degeneration: An observational study. doi: 10.1097/MD.0000000000004502
5. Xie et al. T2 relaxation time for intervertebral disc degeneration in patients with upper back pain: initial results on the clinical use of 3.0 Tesla MRI. doi: 10.1186/s12880-017-0182-z
6. Niu et.al. MR Imaging Assessment of Lumbar Intervertebral Disk Degeneration and Age-Related Changes: Apparent Diffusion Coefficient versus T2 Quantitation. doi:10.3174/ajnr.A2556ajnr.A2556
7. Koy et al. T2-relaxation time increases in lumbar intervertebral discs after 21d head-down tilt bed-rest. PMID: 28860415; PMCID: PMC5601258.
8. Marinelli et al. T2 relaxation times of intervertebral disc tissue correlated with water content and proteoglycan content. DOI: 10.1097/BRS.0b013e318195dd44
9. Nagy et al. A Statistical Model for Intervertebral Disc Degeneration: Determination of the Optimal T2 Cut-Off Values. doi: 10.1007/s00062-013-0266-2
10. Nightingale et al. A Model of Unloaded Human Intervertebral Disk Based on NMR Relaxation. doi.org/10.1002/(SICI)1522-2594(200001)43:1<34::AID-MRM5>3.0.CO;2-7
11. Krueger et al. Changes in T2 Relaxation Times Associated with Maturation of the Human Intervertebral Disk. doi: https://doi.org/10.3174/ajnr.A0546
12. Tertti et al. Disc degeneration in magnetic resonance imaging. A comparative biochemical, histologic, and radiologic study in cadaver spines. DOI: 10.1097/00007632-199106000-00006
13. R. Menezes-Reis et. Al. Lumbar intervertebral discs T2 relaxometry and T1ρ relaxometry correlation with age in asymptomatic young adults. DOI: 10.21037/qims.2016.08.01
Figures