5052
Quantitative MRI assessment of knee joint cartilage in pediatric hemophilic arthropathy using automated cartilage segmentation technique1Department of Radiology, Chengdu Women’s and Children’s Central Hospital, Chengdu, China, 2Siemens Healthineers AG, Forchheim, Germany, 3MR Research Collaboration Team, Siemens Healthineers Ltd., Shanghai, China
Synopsis
Keywords: Rare Disease, Cartilage
Motivation: To offer a quantitative imaging marker for monitoring of hemophilic joints.
Goal(s): To assess knee joint cartilage changes in children with hemophilic arthropathy(HA) using automated segmentation and explore their connection with Hemophilia Joint Health Scores(HJHS).
Approach: MRI were conducted on children with HA and healthy children using advanced techniques and automated cartilage segmentation to evaluate knee joint cartilage and their associations with HJHS.
Results: Significant differences in T1 and T2* values were found between HA and healthy controls, with positive correlations between T1 values in specific regions and HJHS, along with negative correlations between cartilage volume in specific regions and HJHS.
Impact: MRI techniques such as T1 mapping and T2* mapping hold promise for quantitatively assessing early-stage knee joint cartilage damage in HA, and show identifiable correlations with HJHS.
Introduction
Hemophilia is a group of bleeding disorders caused by inherited deficiencies in clotting factors, with recurrent joint bleeding as a common clinical symptom[1]. Regular infusion of clotting factors can prevent or delay joint damage. However, due to the high cost of medication and the pain and inconvenience associated with frequent venipuncture, pre-treatment joint imaging evaluation is necessary to guide treatment planning. Currently, MRI is considered the gold standard for imaging diagnosis of joint lesions[2,3]. With the advancement of imaging technology, quantitative functional MRI has become a research focus in recent years, providing information on tissue structure, morphology, and molecular composition. By measuring different MRI signal intensities, parameters such as T2* and T1 can be obtained[4]. Changes in collagen content, fiber arrangement, water content, and stress on articular cartilage can be reflected by these parameters[5]. While quantitative functional MRI has been partially applied in the study of degenerative joint diseases[6], its use in guiding quantitative analysis for hemophilic joint disease remains limited.Objective
The primary objective of this study was to assess alterations in knee joint cartilage volume, T1 values, and T2* values among pediatric individuals afflicted with hemophilic arthropathy (HA) using an automated cartilage segmentation technique. Additionally, we sought to examine potential correlations between these metrics and Hemophilia Joint Health Scores (HJHS).Methods
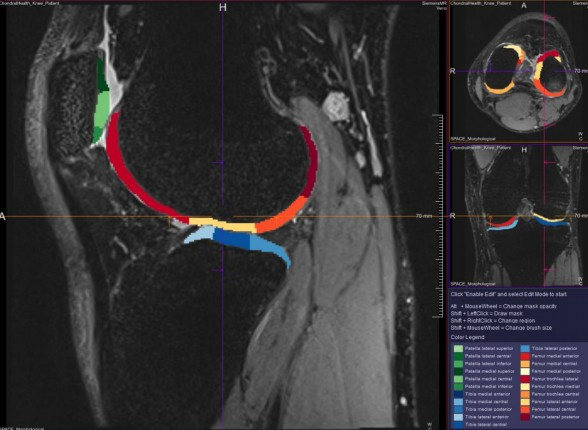
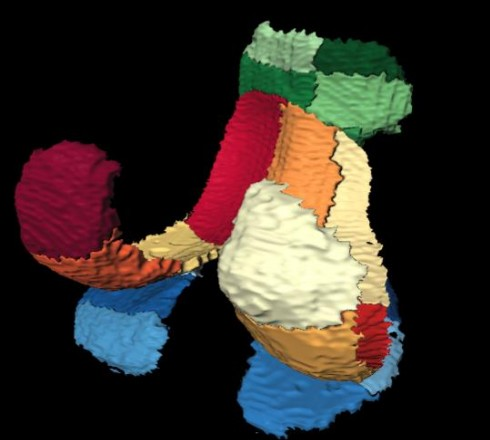
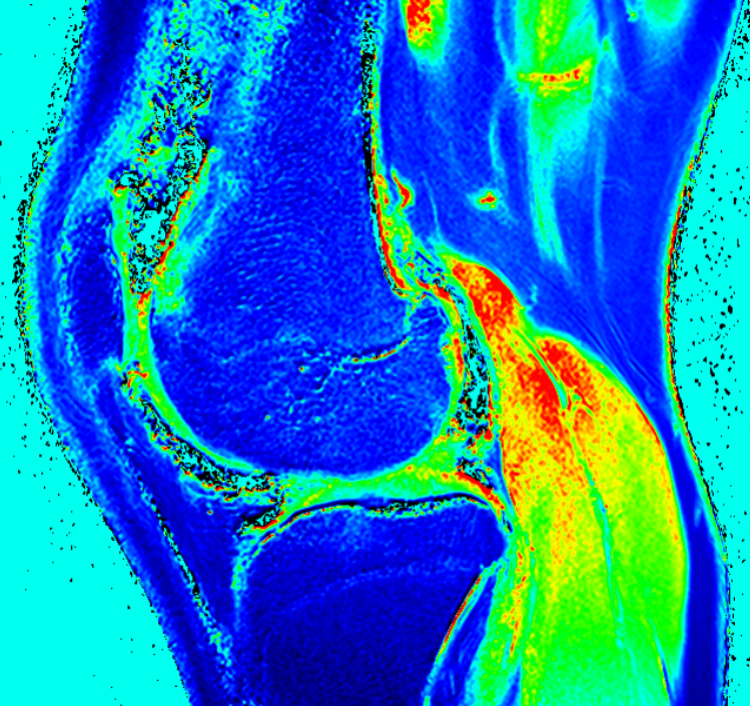
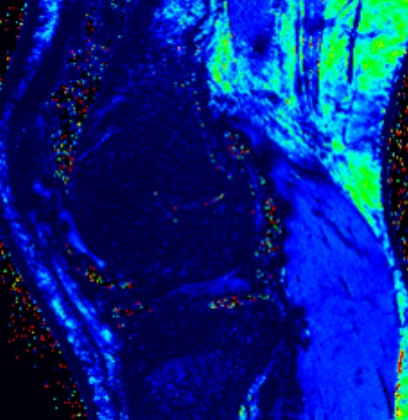
Thirty children with HA and a control group of thirty-two healthy children underwent magnetic resonance imaging (MRI) examinations utilizing 3D DESS, T1 mapping, T2 mapping, and T2* mapping sequences on a 3T MRI scanner (MAGNETOM Vida, Siemens Healthineers AG, Erlangen, Germany). Subsequently, an automated cartilage segmentation research post-processing software (MR Chondral Health V3.0.0, Siemens Healthineers AG, Erlangen, Germany) was applied to partition the knee joint cartilage into 21 regions of interest (ROIs). Parameters including cartilage volume, T1 values, and T2* values from SIEMENS MapIt product sequence package were quantified for each ROI. Pearson correlation analysis was employed to investigate potential associations between these parameters and HJHS scores.Results
Statistically significant distinctions in the average T1 and T2* values were detected, particularly within the central and posterior regions of the lateral femoral condyle, central and anterior regions of the lateral tibial plateau, central and posterior regions of the medial femoral condyle, and anterior region of the medial tibial plateau when contrasting the HA group with the healthy cohort (P < 0.05). Positive correlations were identified between T1 values in the central region of the lateral femoral condyle and medial femoral condyle and HJHS scores (r > 0, P < 0.05), while negative correlations were observed between cartilage volume in the central region of the lateral femoral condyle, central region of the medial femoral condyle, and anterior region of the medial tibial plateau and HJHS scores (r < 0, P < 0.05).Conclusion
In conclusion, MRI techniques such as T1 mapping and T2* mapping demonstrate potential in the quantitative evaluation of early-stage knee joint cartilage damage and degeneration in patients suffering from hemophilic arthropathy. Furthermore, there exists a discernible correlation between cartilage volume, T1 values, T2* values, and HJHS scores.Acknowledgements
We would like to express our sincere gratitude to Director Lai Hua for the financial support of this research. Special thanks go to Jia Xiaojia Wu for their valuable contributions to the data analysis and interpretation.References
[1]Guha A, Rai A, Nandy A,et al. Joint scores in hemophilic arthropathy in children: Developing country perspectives[J]. European Journal of Rheumatology, 2020, 7(1): 26-30.
[2] Foppenm W, Irene C. van der Schaaf, Frederik J. A. Beek,et al. MRI predicts 5-year joint bleeding and development of arthropathy on radiographs in hemophilia[J]. Blood Advances, 2020, 4(1): 113-121. [3]Plut D, Faganel Kotnik B, Preložnik Zupan I, et al. Detection and evaluation of haemophilic arthropathy: Which tools may be considered more reliable[J/OL]. Haemophilia, 2021, 27(1): 156-163.
[4]Von Drygalski A,Richard F. W. Barnes,Jang H,et al. Advanced magnetic resonance imaging of cartilage components in haemophilic joints reveals that cartilage hemosiderin correlates with joint deterioration[J]. Haemophilia, 2019, 25(5): 851-858.
[5]Stelzeneder D, Shetty A A, Kim S J, 等. Repair tissue quality after arthroscopic autologous collagen-induced chondrogenesis (ACIC) assessed via T2* mapping[J]. Skeletal Radiology, 2013, 42(12): 1657-1664.
[6]Mackay J W, Low S B L, Smith T O,et al. Systematic review and meta-analysis of the reliability and discriminative validity of cartilage compositional MRI in knee osteoarthritis[J]. Osteoarthritis and Cartilage, 2018, 26(9): 1140-1152.
Figures