5051
The application of 3D-ZTE technique in ex vivo ankle cortical bone MRI of adolescent pigs: A comparison with CT examination1West China Second University Hospital, Sichuan University, Chengdu, China, 2GE HealthCare MR Research, Beijing, China
Synopsis
Keywords: Bone, MSK, ZTE
Motivation: Exploring non-ionizing radiation alternatives to CT examination for diagnosing bone diseases in children is clinically desirable.
Goal(s): To compare the visualization of the bone cortex around ankle joints of adolescent pig between 3D-ZTE MRI and CT techniques.
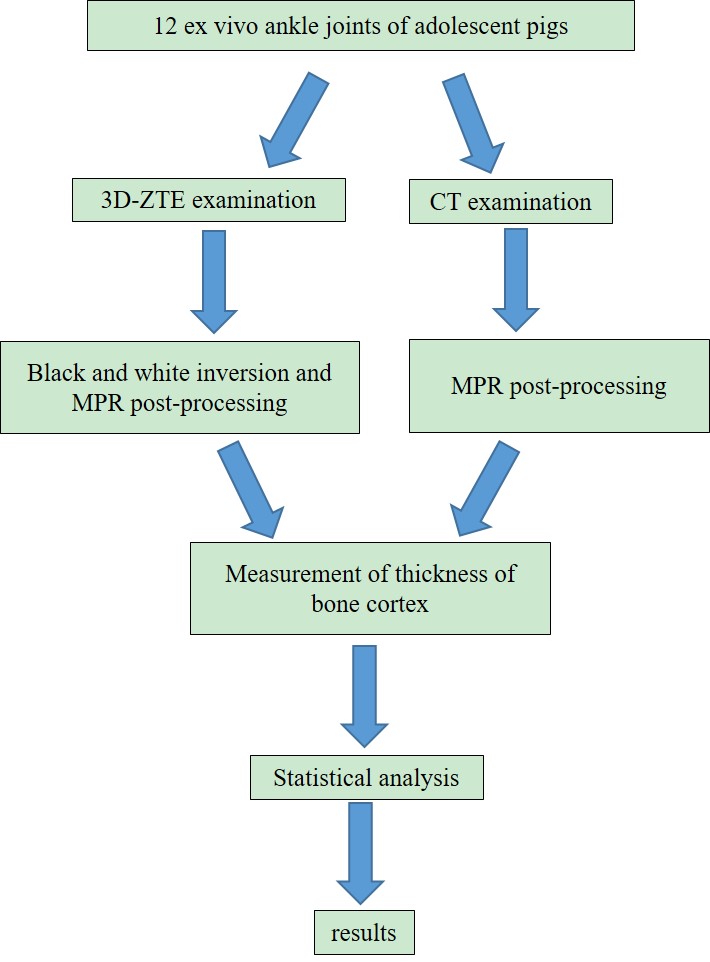
Approach: A total of 12 specimens were subjected to both 3D-ZTE MRI and CT examination. The thicknesses of bone cortex were measured and compared between MRI and CT images.
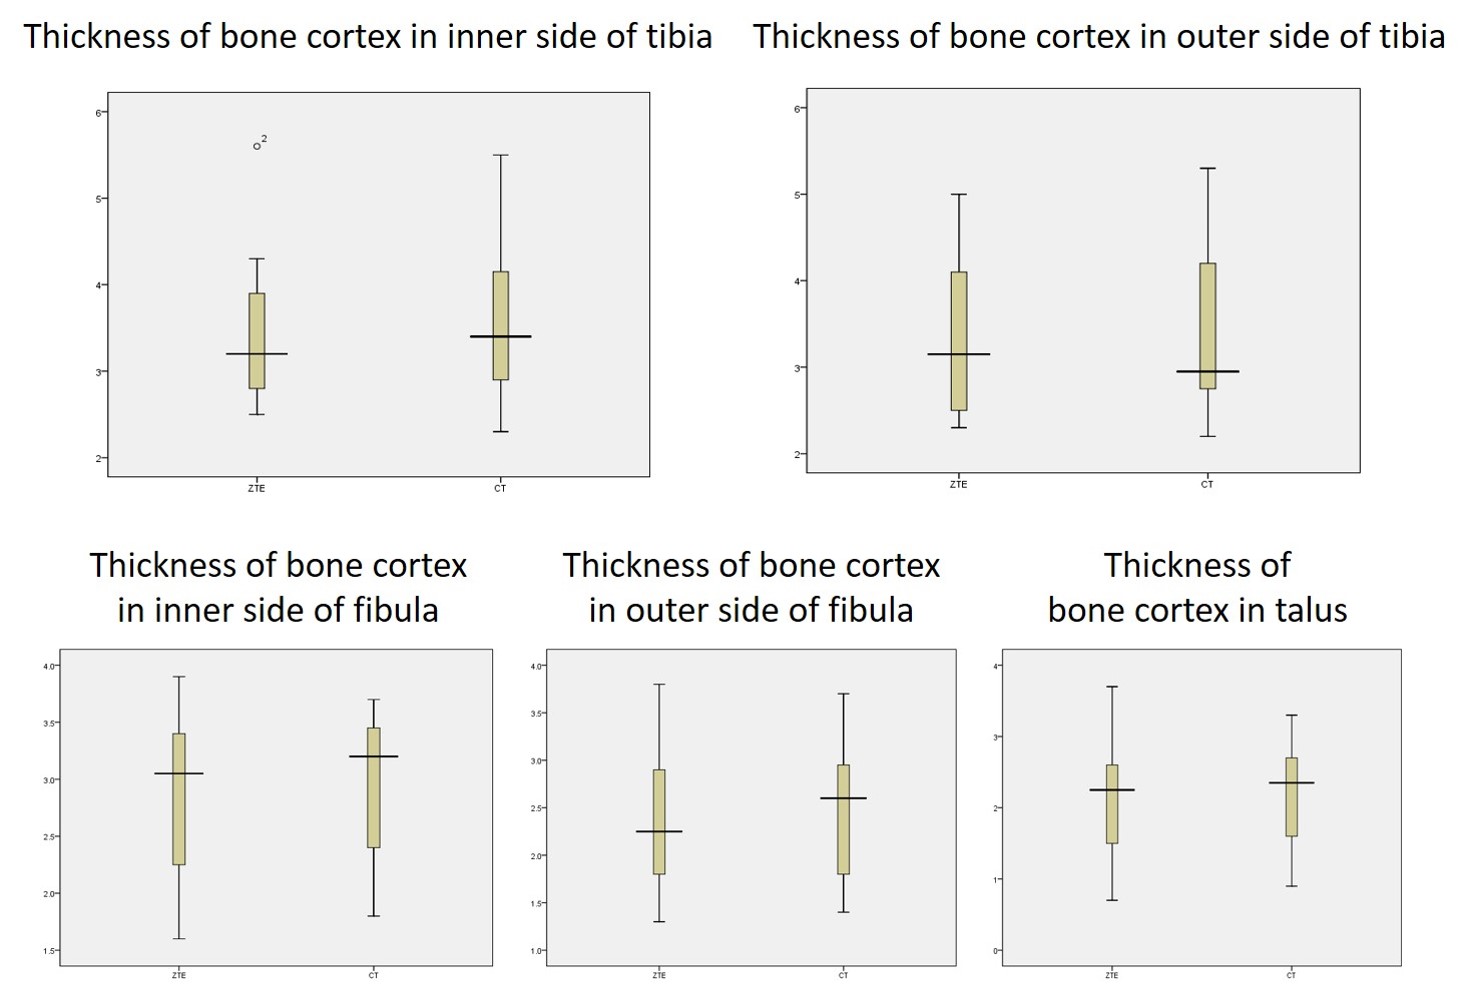
Results: There was no significant difference in the thicknesses of bone cortex in the inner and outer sides of tibia, fibula, and talus between 3D-ZTE and CT.
Impact: 3D-ZTE technique can obtain CT-like images that accurately measure the thickness of bone cortex without ionizing radiation. This technique holds the potential for clinical applications in children with bone diseases, providing a safe alternative to traditional CT imaging.
Introduction
Pediatric musculoskeletal diseases usually lead to changes to the bones, including conditions such as congenital dysplasia of the hip, trauma and juvenile idiopathic arthritis [1-3]. While digital radiography and computed tomography (CT) are commonly used for bone imaging in clinical practice, they involve ionizing radiation and can be harmful to patients, especially pediatric patients. Routine magnetic resonance imaging (MRI) can provide detailed visualization of muscles, cartilages, and ligaments, but it is not ideal for displaying bone structures with low proton density and rapid T2 signal decay. With a minimal delay between spin excitation and signal acquisition, zero echo time (3D-ZTE) MR sequence has been proved to be capable of capturing weak bone signals and show good agreement with CT images [4-6]. However, the application of 3D-ZTE technique in the pediatric musculoskeletal patients has not been fully evaluated [7]. Therefore, the objective of this pre-clinical study was to assess the consistency of 3D-ZTE and CT images in measuring the thickness of the bone cortex around ex vivo ankle joint of adolescent pigs, and to provide guidance for the application of 3D-ZTE MRI in pediatric bone diseases.
Methods
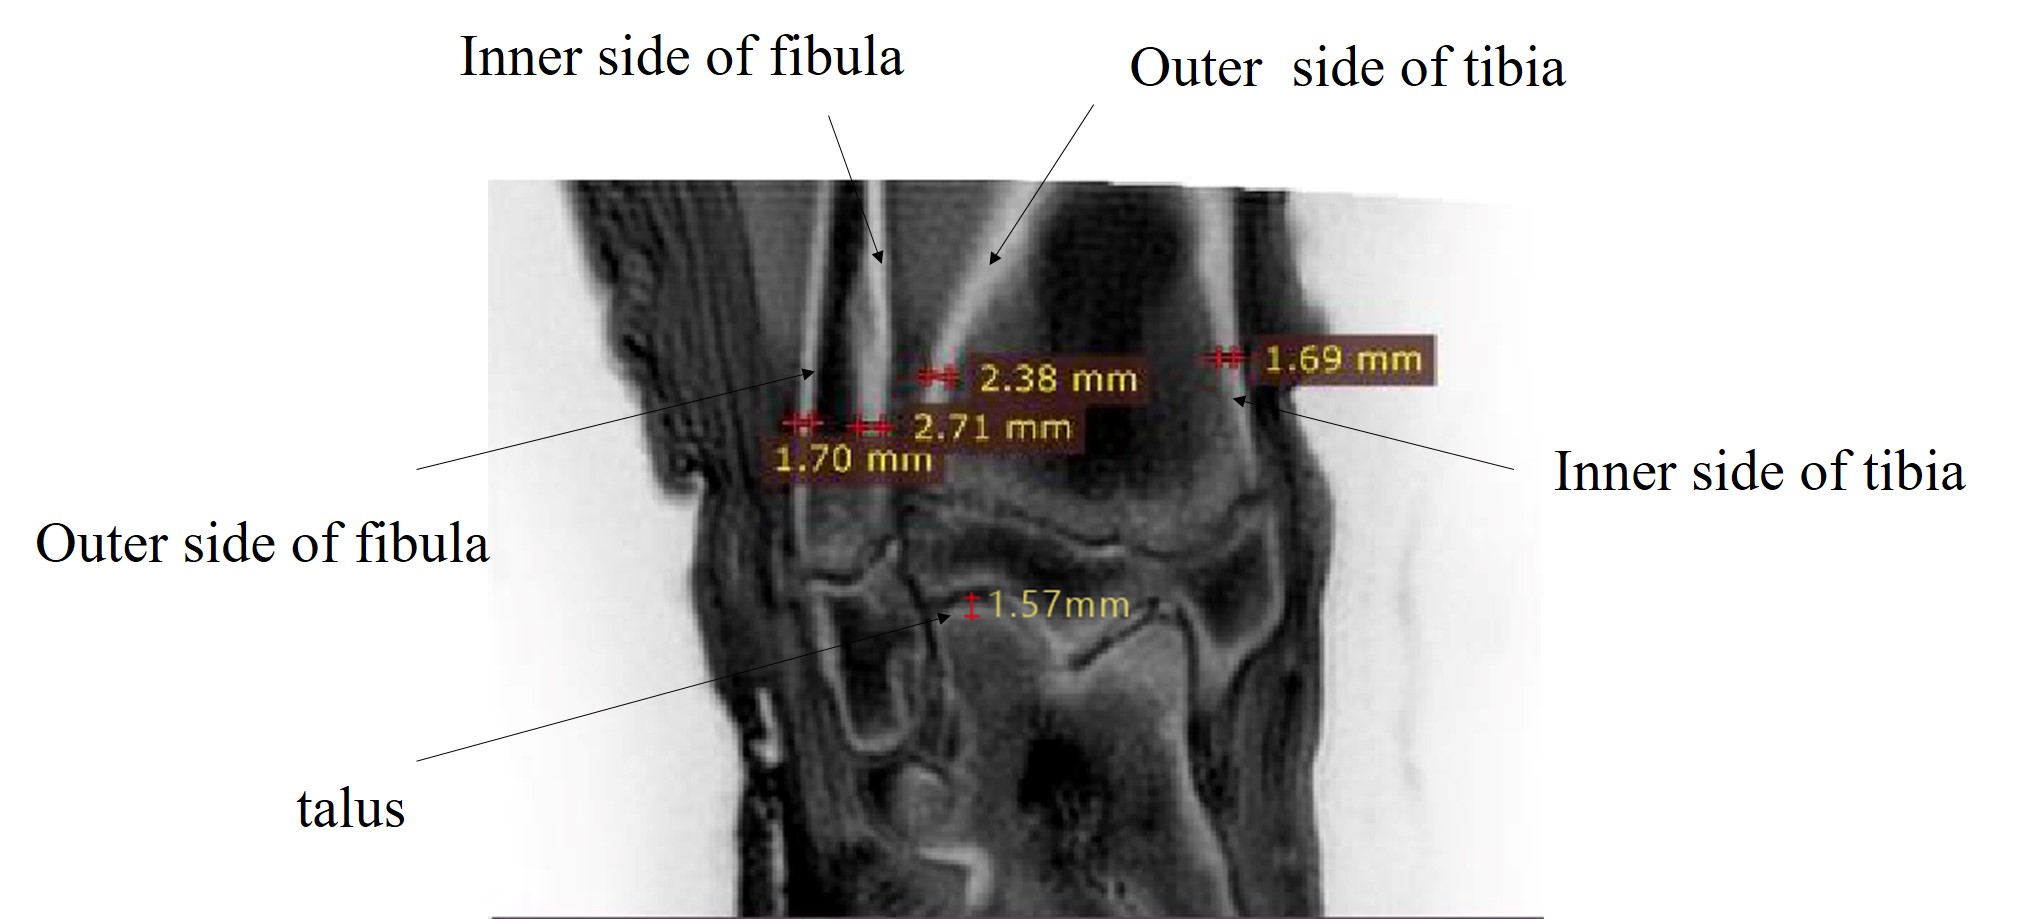
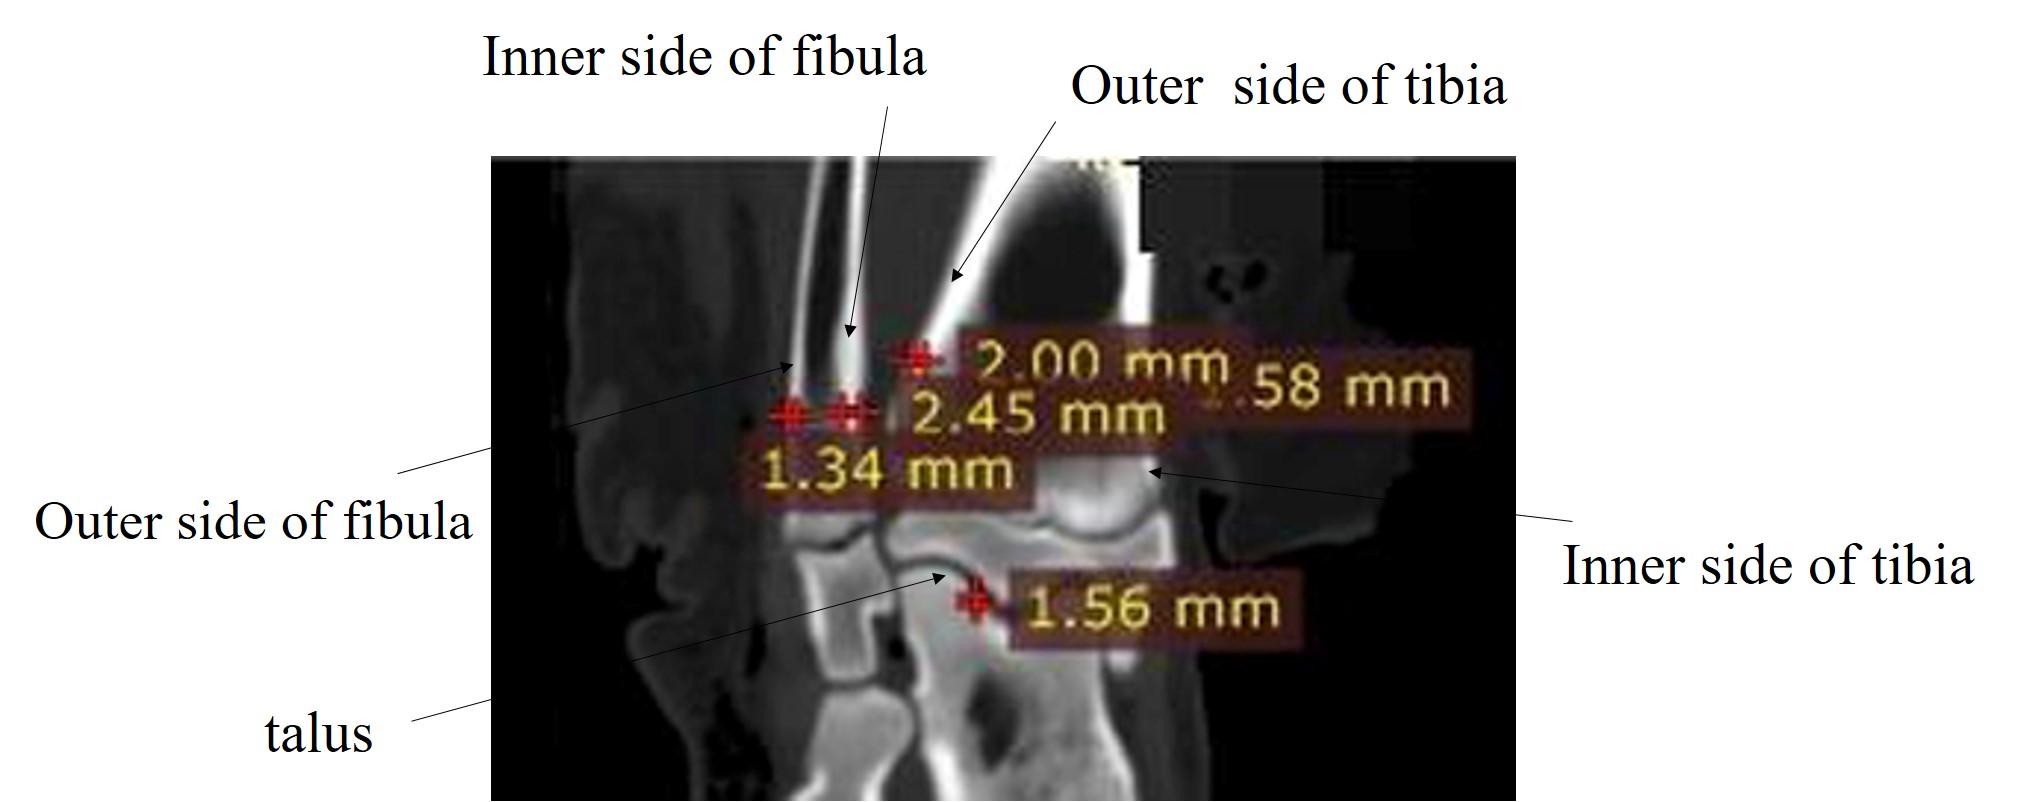
With institutional review board approval, 12 specimens of ankle joints of adolescent pigs were subjected to both 3D-ZTE MRI and CT examination. 3D-ZTE acquisition was performed on a 3.0T MR scanner (SIGNATM Premier, GE Healthcare Systems, Milwaukee, WI) equipped with a 16-channel flex coil. The main parameters were: FOV=160mm2, voxel size=0.7x0.7x0.7mm3, TR=385.5ms, TE=0, FA=3 and total scan time=3min37s. Black and white inversion post-processing was conducted in AW4.7 workstation. Then the thickness of bone cortex were measured in inner and outer sides of tibia, fibula, and in talus from the coronal plane (figure 1). CT acquisition was performed on a 256-row CT scanner (Revolution CT, GE Healthcare, Waukesha, WI) with main parameters: tube voltage using the fast switching mode between 80kVp and 140kVp, tube current=275mA to obtain a reset noise index (NI) of 10 and a pitch of 0.992:1, scanning thickness=5mm and reconstructed to 0.6mm, total scan time=5.8s. Coronal plane images of bone window were obtained also in AW4.7 workstation to measure the thicknesses of bone cortices in these aforementioned five locations (figure 2). The test of normality was used in the ten groups data. The paired t test, correlation and regression analysis were used to compare thickness values of the same positions between 3D-ZTE and CT images in SPSS 16.0 (IBM Corp., Chicago, IL) (figure 3).Results
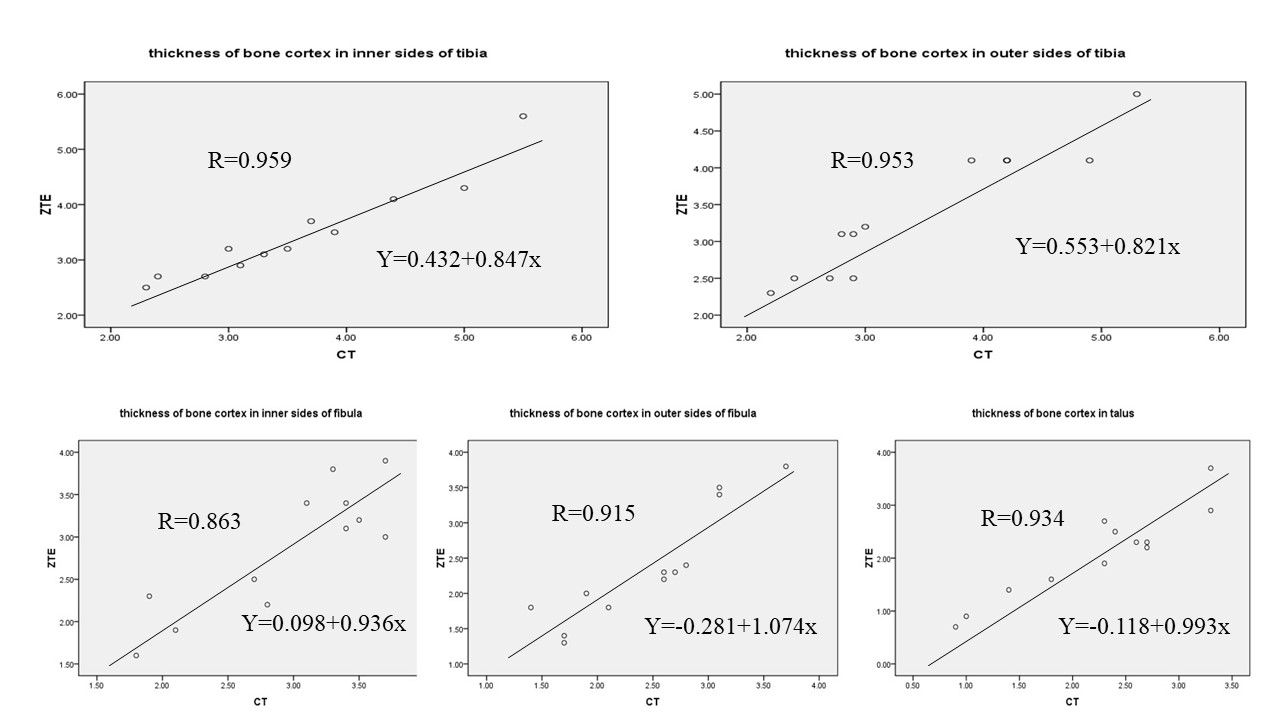
(1) The ex vivo ankle cortical bone could be clearly displayed in 3D-ZTE CT-like images. (2) All data obeyed normal distribution. The thickness of bone cortex in inner side of tibia were 3.46±0.87mm and 3.58±0.99mm in 3D-ZTE and CT images respectively (P=0.194). That in outer side of tibia were 3.38±0.87mm and 3.45±1.01mm respectively (P=0.486), in inner sides of fibula were 2.86±0.75mm and 2.95±0.69mm respectively (P=0.421), in outer sides of fibula were 2.35±0.81mm and 2.45±0.69mm respectively (P=0.321), in talus were 2.09±0.85mm and 2.22±0.81mm respectively (P=0.159). There were no statistical differences in all above (P>0.05) (figure 4). (3) Excellent correlations were observed between the thickness of the bone cortex measured using 3D-ZTE and CT images (P < 0.001). R=0.959 in inner side of tibia and the regression equation was y=0.432+0.847x. R=0.953 in outer side of tibia with a regression equation of y=0.553+0.821x. R=0.863 in inner side of fibula with a regression equation of y=0.098+0.936x. R=0.915 in outer side of fibula with a regression equation of y=-0.281+1.074x. R=0.934 in talus with a regression equation of y=-0.118+0.993x (figure 5).Discussion
The post-processed images obtained from 3D-ZTE acquisition were CT-like without ionizing radiation. We procured 12 specimens from a farmer’s market, which had unfused epiphysis and diaphysis similar to those found in adolescent children, thus making them suitable for mimicking the ankle joint of adolescent children. Since the specimens were ex vivo and lifeless, MRI and CT examinations could be conducted without violating ethical principles. The study findings revealed that the thicknesses of bone cortex around ex vivo ankle joint of adolescent pigs was consistent between the 3D-ZTE technique and CT examination. Therefore, 3D-ZTE technique has the potential to be a safer alternative to CT examination for diagnosing bone diseases in pediatric patients.Conclusions
3D-ZTE technique can obtain CT-like images that can accurately measure the thickness of bone cortex in ex vivo ankle joint of adolescent pigs and has the potential to be a safer choice for diagnosing children bone diseases.Acknowledgements
No acknowledgement found.References
1. Fujisaki A, Tsukamoto J, Narimatsu H, et al. Zero echo time magnetic resonance imaging: techniques and clinical utility in musculoskeletal system. JMRI, 2023, online.
2. Sneag DB, Albe F, Potter HG, et al. MRI advancements in musculoskeletal clinical and research practice. Radiology, 2023, 308(2): e230531.
3. Sandberg JK, Young VA, Yuan JM, et al. Zero echo time pediatric musculoskeletal magnetic resonance imaging: initial experience. Pediatric radiology, 2021, 51(13): 2549-2560.
4. Bharadwaj UU, Coy A, Motamedi D, et al. CT‑like MRI: a qualitative assessment of ZTE sequences for knee osseous abnormalities. Skeletal radiology, 2022, 51(8): 1585-1594.
5. de Mello RAF, Ma YJ, Ashir A, et al. 3D Zero Echo Time (ZTE) MRI versus 3D CT for Glenoid Bone Assessment. Arthroscopy, 2020, 36(9): 2391–2400.
6. Aydıngöz Ü, Yildiz AE, Ergen FB. Zero echo time musculoskeletal MRI: technique, optimization, applications, and pitfalls. Radiographics, 2022, 42(5): 1398-1414.
7. Sandberg JK, Young VA, Yuan JM, et al. Zero echo time pediatric musculoskeletal magnetic resonance imaging: initial experience. Pediatr Radiol, 2021, 51(3): 2549-2560.
Figures