5050
31P-MRS measured phosphocreatine recovery kinetics in human muscles during health and disease: a meta-analysis1Biomedical Imaging, Pennington Biomedical Research Center, Baton Rouge, LA, United States, 2University of Maryland Baltimore, Baltimore, MD, United States, 3Louisiana State University, Baton Rouge, LA, United States, 4Pennington Biomedical Research Center, Baton Rouge, LA, United States
Synopsis
Keywords: Muscle, Spectroscopy, Skeletal muscle metabolism
Motivation: 31P-MRS methodology is notoriously laboratory-specific, leading to uncertainty about the normal range of PCr recovery kinetics among healthy individuals, as well correlations with disease and demographic factors.
Goal(s): Our aim was to characterize the normal range of PCr recovery measurements from 31P-MRS in human skeletal muscles, as well as correlations with age and end-of-exercise pH.
Approach: Included studies focused on exercise-induced skeletal muscle PCr recovery kinetics in healthy or diseased individuals, using 31P-MRS.
Results: PCr recovery time is consistent across three skeletal muscle groups in healthy individuals from diverse MRI centers. Greater age and more acidic pH increase PCr recovery time.
Impact: These results will set the indexes for PCr recovery kinetic measures across different human skeletal muscles.
Purpose:
The non-invasive measurement of post-exercise phosphocreatine (PCr) recovery kinetics using 31-phosphorus magnetic resonance spectroscopy (31P-MRS) is a highly prevalent method for in vivo, non-invasive assessment of skeletal muscle energetics. However, 31P-MRS methodology is notoriously laboratory-specific, leading to uncertainty about the normal range of PCr recovery kinetics among healthy individuals, as well correlations with disease and demographic factors. Therefore, our aim was to systematically characterize the normal range of PCr recovery measurements from 31P-MRS in human skeletal muscles, as well as correlations with age and end-of-exercise pH, among healthy adults and those with muscle-related diseases.Methods:
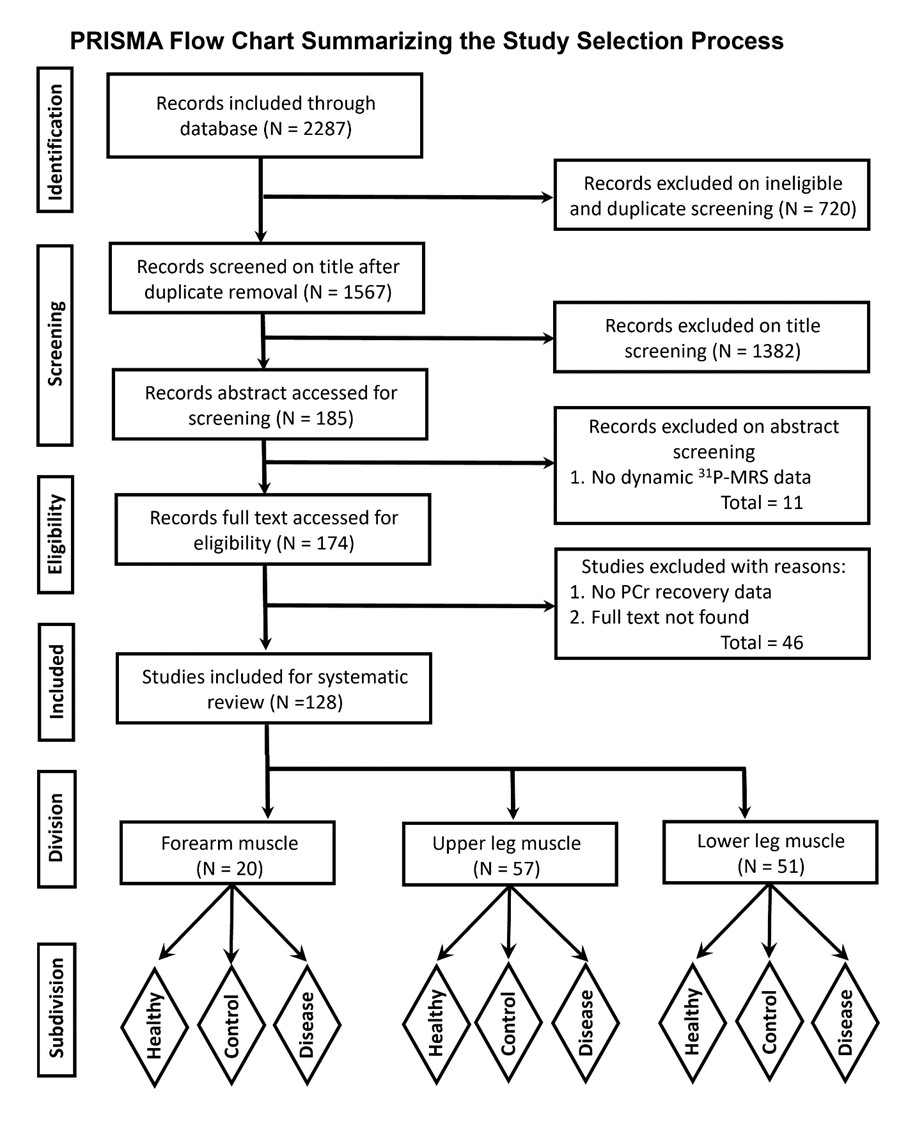
PubMed, Web of Science, Cochrane, and Google Scholar databases were searched for articles. Cross sectional, prospective, case report and experimental studies that used isometric, isotonic, and isokinetic muscle flexion to measure the forearm, upper leg, and lower leg muscles, and were published in English, were included. Inclusion required an exercise challenge paradigm targeting skeletal muscle phosphocreatine recovery kinetics among healthy or diseased individuals across the lifespan. Studies must have measured PCr recovery kinetics using 31P-MRS.The search was conducted in March 2023. In total, 2287 relevant studies were initially identified, and 1567 remained after screening for duplicates and off-topic titles. Abstract screening resulted in 185 potentially relevant studies, and screening the full text resulted in a final set of 128 studies that qualified for meta-analysis. These studies were categorized according to the three different muscle groups from which PCr kinetics were measured: forearm, upper leg, and lower leg.
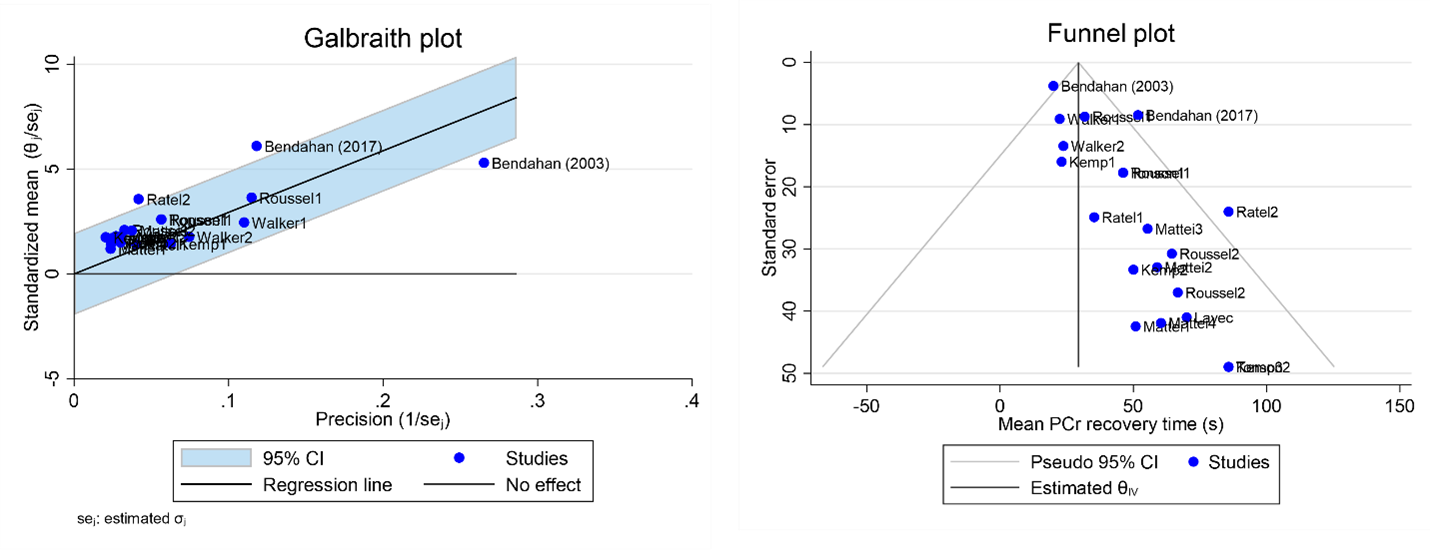
Statistical analysis of mean PCr recovery rates from each study was performed using Stata 17 software. Meta-analysis was conducted using forest plots to determine the pooled summary PCr recovery rate within each muscle group. Random effect analysis was used to weigh each study to control for potential heterogeneity [1]. The mean difference statistic was used for effect size calculations. Single group mean analysis was performed for studies exclusively involving healthy participants whereas two group mean analysis was used for comparative studies involving disease groups and control groups. Inter-study heterogeneity was assessed using the Cochran Q-statistic, and the extent of this heterogeneity was quantified using the I2 statistic [2]. In cases where the Q-statistic showed significance, a Galbraith plot was utilized to identify studies responsible for the most significant heterogeneity. Publication bias was examined using Egger’s test and funnel plots. Results of statistical tests were considered significant if P ≤ 0.05.
Results and Discussion:
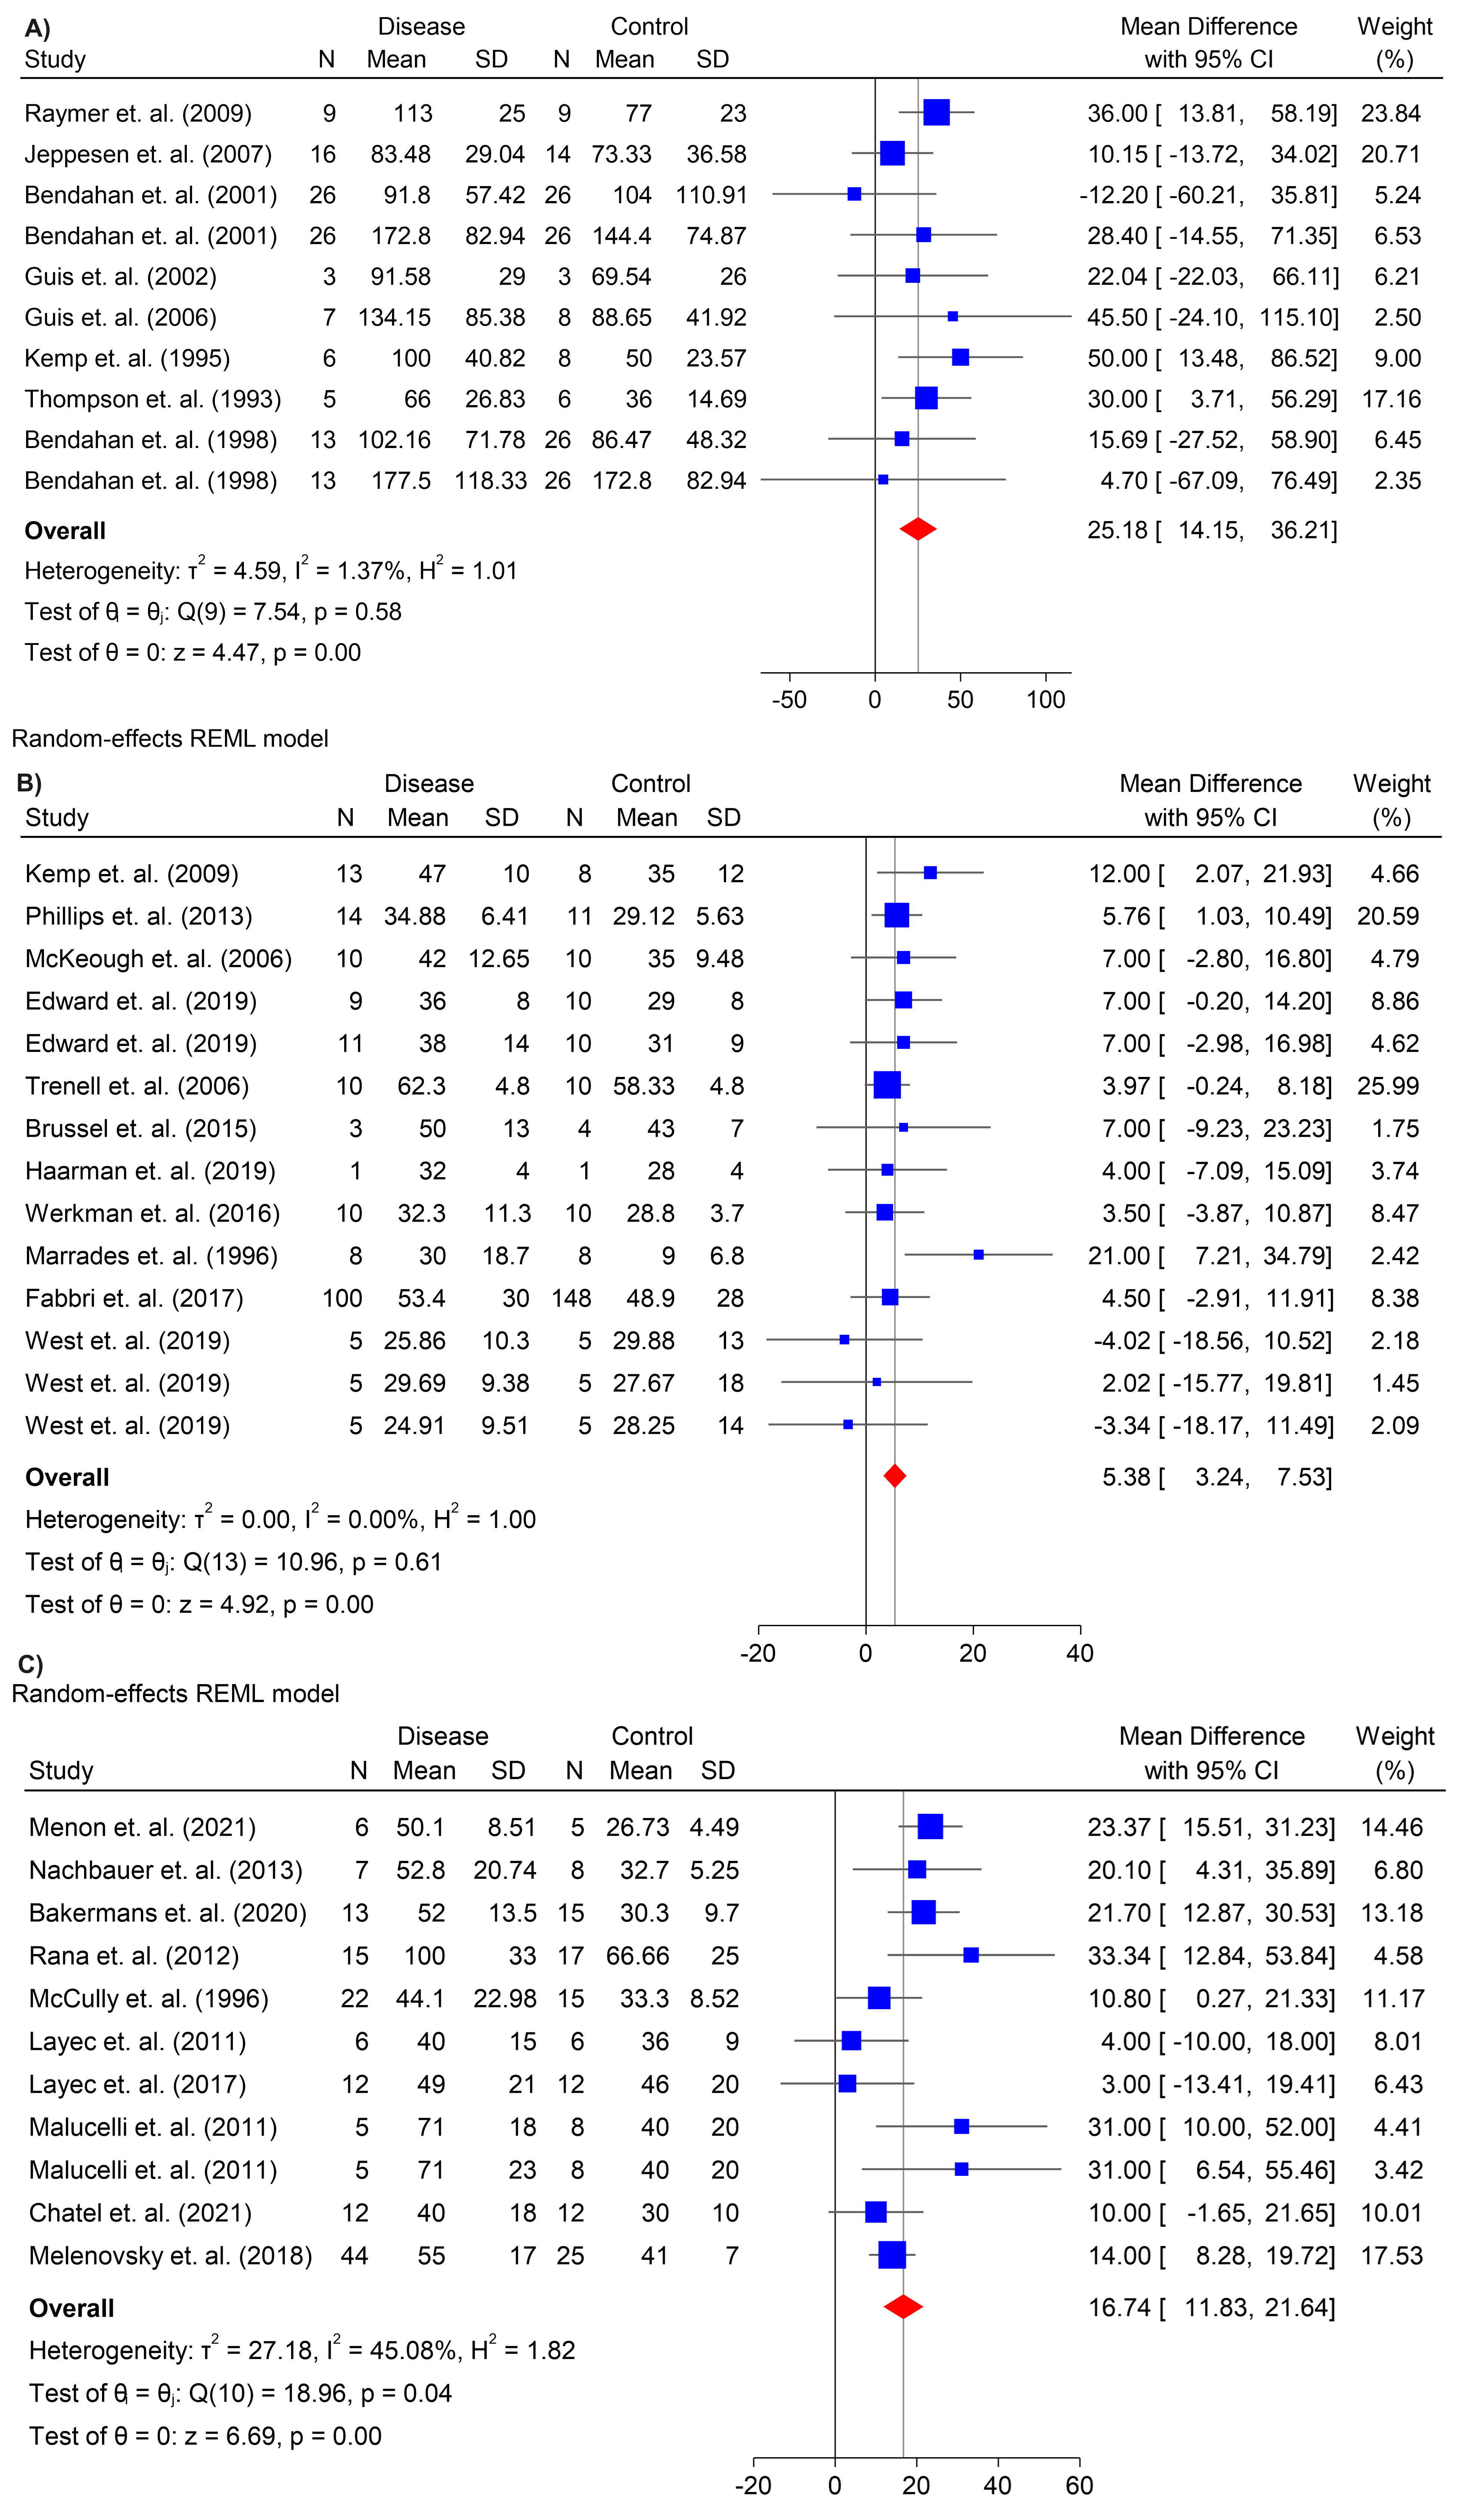
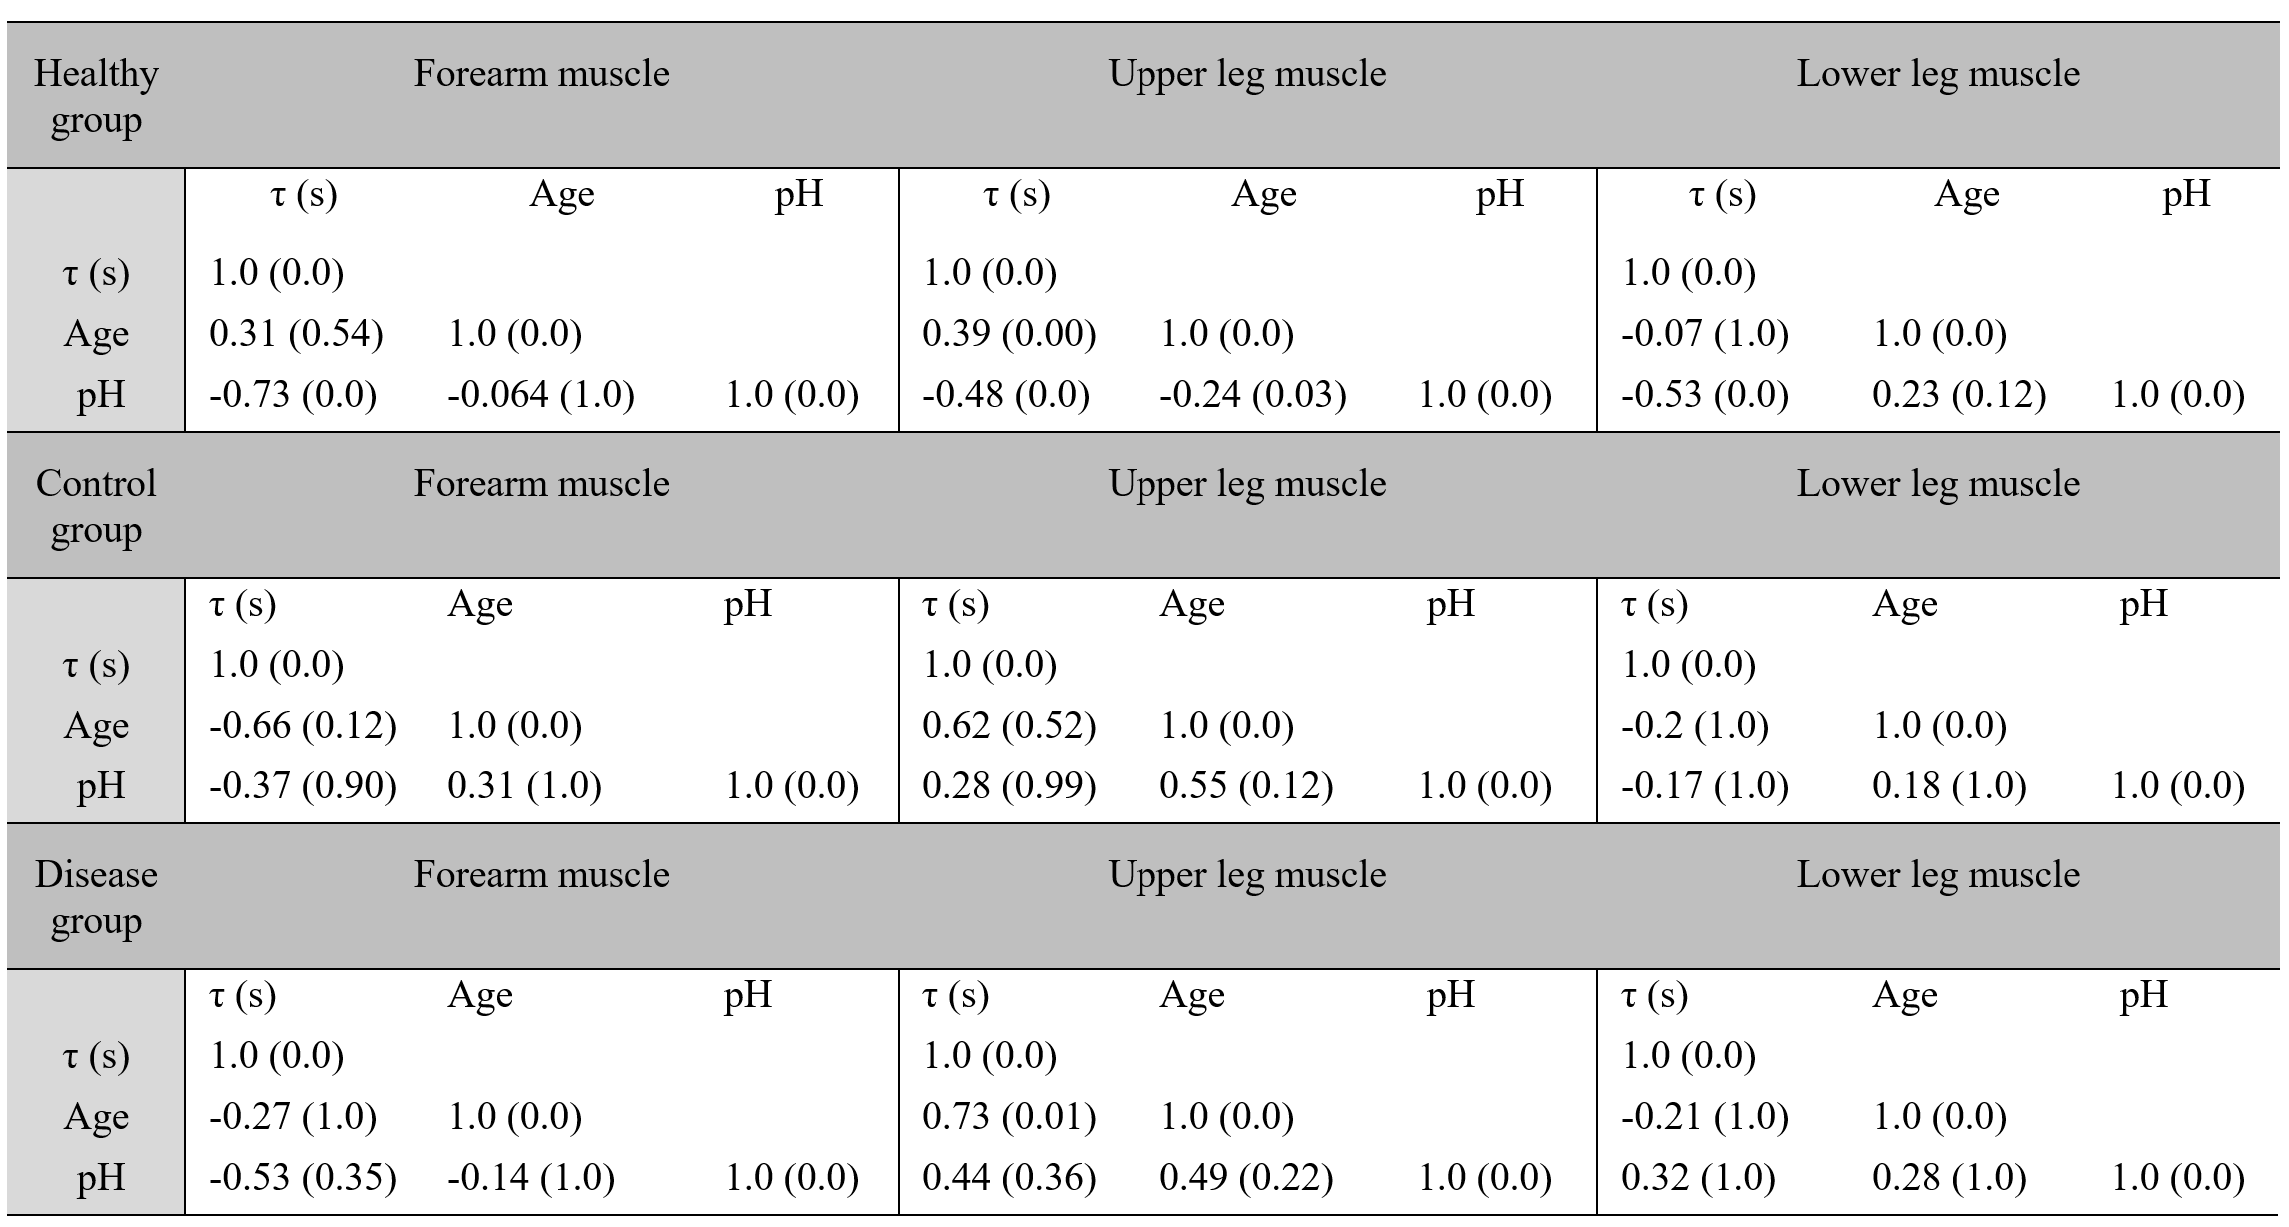
A PRISMA flowchart [3] of the study selection process is provided in Figure 1. Eighty-six studies included healthy individuals only, while forty-two included individuals with muscle-related diseases. Forest plots showed significant heterogeneity across mean PCr recovery time estimates initially, and outlier studies were identified using Galbraith and funnel plots (see, e.g., Figure 2 for forearm muscle studies among healthy individuals). After removing outlier studies, the pooled estimate of PCr recovery time among healthy adults was 34.41 ± 8.74 s, 35.66 ± 2.17 s, and 33.75 ± 2.82 s, in the forearm, upper leg, and lower leg muscles, and the studies were homogeneous (Q = 10 to 45, I2 = 0 to 2.6%, tau2 = 0 to 2.3 and P > 0.05). In comparative studies, the overall mean difference in PCr recovery time between disease and control groups was 25.18 ± 11 s, 5.38 ± 2.14 s, and 16.74 ± 4.91 s (Figure 3), in forearm, upper leg and lower leg muscles, and heterogeneity among studies was low to moderate (Q = 7.5 to 19, I2 = 0 to 45.08 % and tau2 = 0 to 27.18, 0.04 < P < 1.0) after outlier studies were removed. Greater age was associated with longer PCr recovery in upper leg muscles among both healthy (0.387, P < 0.05) and diseased (0.733, P < 0.05) individuals (Table 1). Additionally, longer PCr recovery time was significantly correlated with more acidic end-of-exercise pH in all three muscle groups among healthy individuals.Conclusions:
Mitochondrial oxidative capacity as indexed by 31P-MRS based PCr recovery time is similar across three different skeletal muscle groups among healthy people measured at a variety of different MRI centers. Common diseases significantly prolong PCr recovery times. Although these values are numerically higher among those with common muscle-related diseases, their effect sizes were not significant in the overall meta-analysis until outlier studies were removed from analysis. Greater age and more acidic pH increase PCr recovery time.Acknowledgements
No acknowledgement found.References
1. DerSimonian, R., & Laird, N. (1986). Meta-analysis in clinical trials. Controlled clinical trials, 7(3), 177-188.
2. Higgins JP, Thompson SG, Deeks JJ, Altman DG. Measuring inconsistency in meta-analyses. BMJ. 2003 Sep 4;327(7414):557-60.
3. Page MJ, McKenzie JE, Bossuyt PM, Boutron I, Hoffmann TC, Mulrow CD, Shamseer L, Tetzlaff JM, Akl EA, Brennan SE, Chou R. The PRISMA 2020 statement: an updated guideline for reporting systematic reviews. International journal of surgery. 2021 Apr 1;88:105906.
Figures