5042
A systematic automated post-processing approach for quantitative analysis of 3D T1ρ knee MRI1Department of Imaging and Interventional Radiology, The Chinese University of Hong Kong, Sha Tin, NT, Hong Kong, 2School of Informatics, University of Edinburgh, Edinburgh, United Kingdom, 3Department of Radiology, Shanghai Sixth People’s Hospital Affiliated to Shanghai Jiao Tong University School of Medicine, Shanghai, China, 4Department of Orthopaedics & Traumatology, The Chinese University of Hong Kong, Sha Tin, NT, Hong Kong, 5Philips Healthcare, Sha Tin, NT, Hong Kong
Synopsis
Keywords: Cartilage, Software Tools
Motivation: To address the global healthcare challenge of knee osteoarthritis.
Goal(s): Develop and validate an automated post-processing method for quantitative 3D T1ρ knee imaging analysis. The proposed post-processing pipeline accelerates the process while preserving a user-friendly and clinical-related output.
Approach: We proposed a post-processing pipeline that combines parcellation, ROIs selection, T1rho fitting, and regionally averaged outputs. We evaluated our approach on 30 OA patients and 10 healthy controls.
Results: The proposed post-processing approach achieved satisfactory performance on automatic ROI selection compared to the manually labelled ROIs and provided quantitative T1ρ analysis with clinical promise.
Impact: Our proposed pipeline enables automated post-processing for T1ρ imaging with deep learning, pushing this promising technique to the clinics to provide sensitive and quantitative knee OA diagnostics.
Introduction
Knee osteoarthritis (OA) is a major healthcare problem worldwide1. Standard clinical MRI exams rely on structural changes for assessment of knee OA, which often leads to diagnosis at advanced stages of OA where cartilage loss has already occurred. Quantitative spin-lattice relaxation time in a rotating frame (T1ρ) MRI can be used for compositional cartilage imaging. Studies have demonstrated that T1ρ values of cartilage correlate with its proteoglycan content2, indicating its capability of early detection of OA. One challenge to adopting T1ρ MRI in clinical routine is the lack of automated postprocessing technqiues3. In the abstract, we propose a computerised post-processing pipeline for 3D T1ρ knee imaging and demonstrate its potential clinical transferability.Materials and Methods
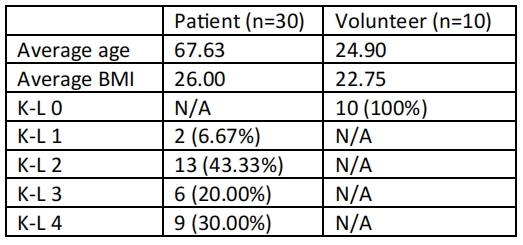
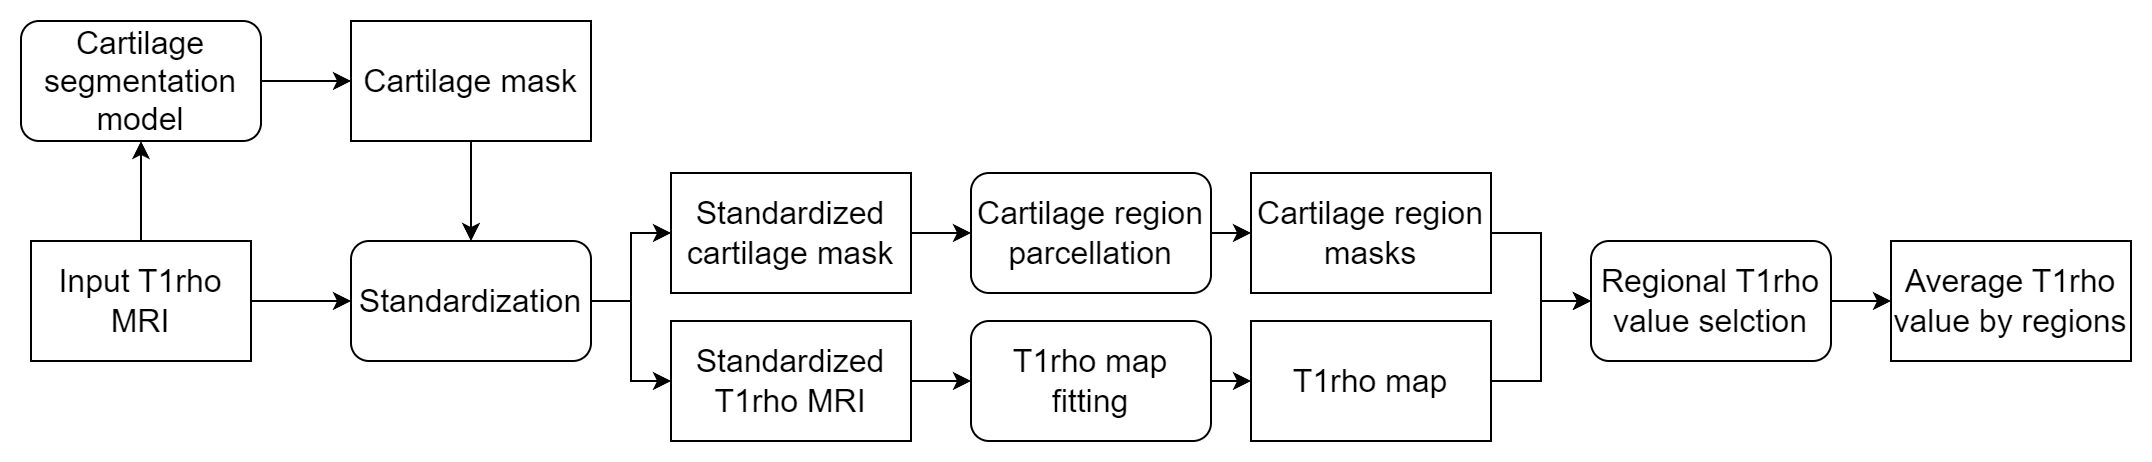
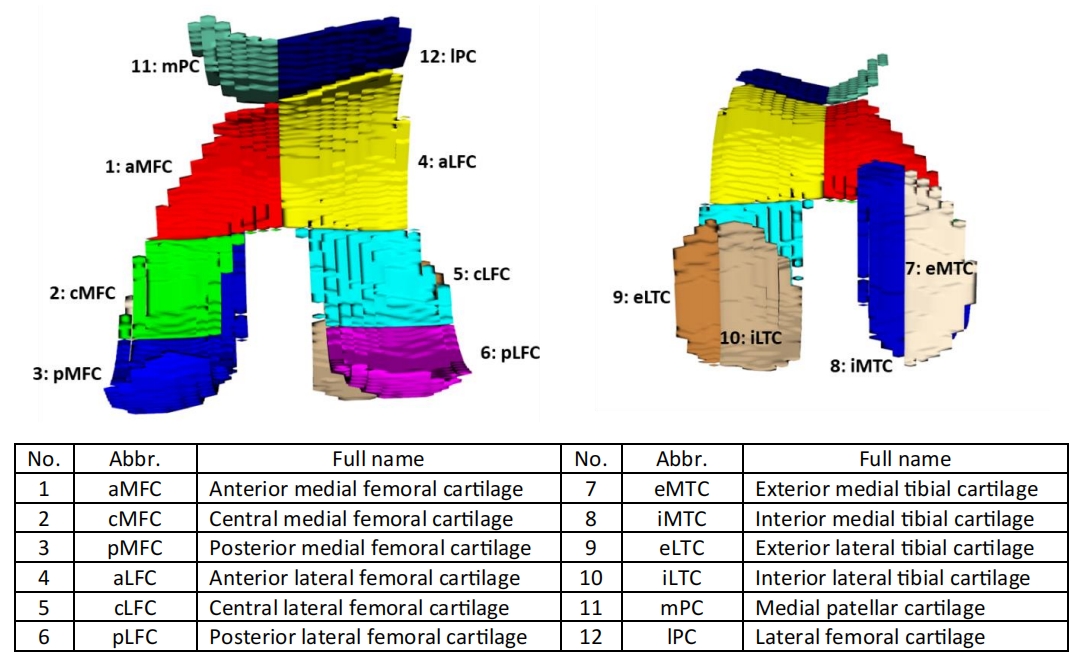
We collected and labelled the region of interest (ROI) for 30 OA patients and 10 healthy volunteers at our hospital to develop and demonstrate the proposed approach under the approval of the Institutional Review Board. The labels were prepared under the supervision of a radiologist with 8 years of experience in clinical radiology (F. X.). The demographics are shown in Figure 1. We acquired T1rho by a magnetisation-prepared spin-lock 3D turbo spin echo (TSE) sequence4 on our 3.0T Achieva scanner (Philips Healthcare, Best, Netherlands), as our previous work proved that T1rho is unaffected by flip angle, echo time, and echo train length5. Acquisition parameters include TE/TR=33/2000ms, field of view=160*160*132mm, resolution=0.8*1.0*3.0mm, echo train length=45, frequency of spin-lock=300Hz, and spin-lock time=0/10/30/50ms.Figure 2 shows the pipeline of the proposed post-processing for 3D T1ρ knee imaging. The proposed method is based on our previous work5,6 on cartilage morphometrics. We adopted a state-of-the-art medical segmentation method, nnU-Net7, for cartilage segmentation on T1ρ-weighted images. We standardise image orientation by registering images to the RAS+ convention (the positive directions of the data array axes are right, anterior, and superior, respectively). A rule-based parcellation algorithm is developed to form 12 ROIs on the cartilage automatically. T1ρ-weighted images are fit to the standard mono-exponential model to obtain T1ρ values and the average T1ρ values within each ROI are provided as the output.
To validate the proposed post-processing method, we evaluated the performance of ROI selection by measuring the Dice Similarity Coefficient (DSC) 8 between model prediction and manual labels. We additionally compared the regional average T1rho values from the proposed method to those in ROIs manually drawn by Intra Class Correlations (ICC). We consider an excellent reliability with an ICC > 0.75.
We analysed the correlation of T1rho values and the OA severity. Our subjects were grouped by five Kellgren-Lawrence (K-L) grades. A one-way ANOVA test with a Bonferroni post hoc analysis was used to analyse the changes in T1rho values. The studies were performed using SPSS Version 27.0 (IBM Corp, Armonk, NY) with a significant level of p < 0.05.
Results
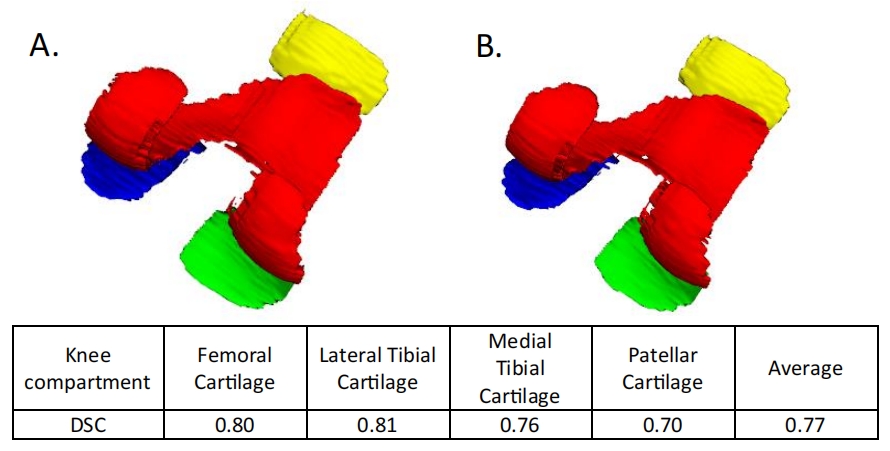
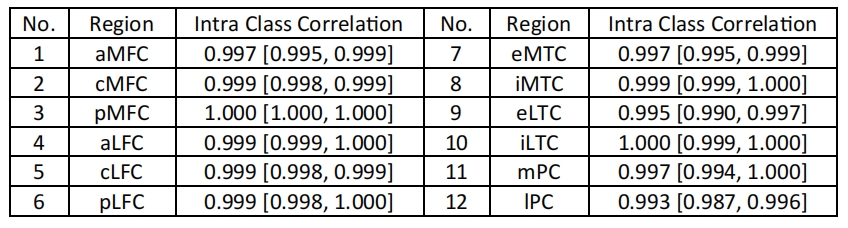
We labelled the ROIs on femoral cartilage, medial tibial cartilage, lateral tibial cartilage, and patellar cartilage. The nnU-Net was trained with a five-fold cross-validation on 3D T1ρ-weighted image volumes from 40 subjects. Figure 3 shows an example of automated ROI selection and the DSC scores from the nnU-Net experiment, and Figure 4 shows an example parcellation and the list of resulting ROIs. The ICC scores of the mean T1ρ in these 12 ROIs calculated from the proposed method and those from the manual approach ranged from 0.993 to 1.000 (detailed scores are shown in Figure 5), showing an excellent reliability of our automated ROI selection algorithm.With the ANOVA test, we observed significant differences in T1ρ values at pMFC (p<0.01) and eLTC (p=0.025) between healthy controls and OA patients. At pMFC, Bonferroni post-hoc analysis further showed significant T1rho value change between K-L 0 and 2 (p=0.004), 0 and 3 (p=0.010), and 0 and 4 (p = 0.002). Meanwhile, at eLTC, Bonferroni's post-hoc analysis showed a significant T1ρ value change between K-L 1 and 3 (p=0.046). No substantial change in T1ρ values for other K-L grade pairs in the remaining regions were observed.
Discussion and Conclusion
We reported a deep-learning based automatic post-processing method for 3D T1rho knee imaging. We demonstrated that the proposed method achieved a reliable and clinical-related automatic ROIs selection for quantitative T1ρ analysis of cartilage. However, we noticed that our result does not fully align with those reported by Wang et al.9 Such discrepancy can be confounded by the difference of software and hardware used at different sites. The reproducibility of 3D T1ρ imaging has not been fully validated cross imaging sites, MRI systems, and vendors. Further studies are needed to evaluate T1ρ imaging on larger cohorts with standardized acquisition and post-processing.Acknowledgements
We would like to acknowledge Cherry Cheuk Nam Cheng and Ben Chi Yin Choi for assistance in patient recruitment and MRI exams. This study was supported by a grant from the Innovation and Technology Commission of the Hong Kong SAR (Project MRP/001/18X).
References
1. Cui A, Li H, Wang D, Zhong J, Chen Y, Lu H. Global, regional prevalence, incidence and risk factors of knee osteoarthritis in population-based studies. EClinicalMedicine. 2020;29-30:100587. doi:10.1016/j.eclinm.2020.1005872. Emanuel KS, Kellner LJ, Peters MJM, Haartmans MJJ, Hooijmans MT, Emans PJ. The relation between the biochemical composition of knee articular cartilage and quantitative MRI: a systematic review and meta-analysis. Osteoarthritis Cartilage. 2022;30(5):650-662. doi:10.1016/j.joca.2021.10.016
3. Chalian M, Li X, Guermazi A, et al. The QIBA Profile for MRI-based Compositional Imaging of Knee Cartilage. Radiology. 2021;301(2):423-432. doi:10.1148/radiol.2021204587
4. Jordan CD, Monu UD, McWalter EJ, et al. Variability of CubeQuant T1rho, Quantitative DESS T2, and Cones Sodium MRI in Knee Cartilage. Osteoarthr Cartil OARS Osteoarthr Res Soc. 2014;22(10):1559-1567. doi:10.1016/j.joca.2014.06.001
5. Yao Y, Chen W. Deep-Learning-Based Knee Articular Cartilage Morphometrics. In: Proceeding of the International Society for Magnetic Resonance in Medicine. ; 2023.
6. Yao Y, Zhong J, Zhang L, Khan S, Chen W. CartiMorph: a framework for automated knee articular cartilage morphometrics. Published online August 30, 2023. doi:10.48550/arXiv.2308.01981
7. Isensee F, Jaeger PF, Kohl SAA, Petersen J, Maier-Hein KH. nnU-Net: a self-configuring method for deep learning-based biomedical image segmentation. Nat Methods. 2021;18(2):203-211. doi:10.1038/s41592-020-01008-z
8. Dice LR. Measures of the Amount of Ecologic Association Between Species. Ecology. 1945;26(3):297-302. doi:https://doi.org/10.2307/1932409
9. Kellgren JH, Lawrence JS. Radiological Assessment of Osteo-Arthrosis. Ann Rheum Dis. 1957;16(4):494-502. doi:10.1136/ard.16.4.494
10. Wang L, Chang G, Xu J, et al. T1rho MRI of menisci and cartilage in patients with osteoarthritis at 3T. Eur J Radiol. 2012;81(9):2329-2336. doi:10.1016/j.ejrad.2011.07.017
Figures