5041
Evaluation of the change in magnetic susceptibility values of knee joint cartilage in patients with osteoarthritis using UTE-QSM1Department of Radiology, Southwest Hospital, Army Medical University (Third Military Medical University), Chongqing, China, Chongqing, China, 2MR Collaboration, United Imaging Research Institute of Intelligent Imaging, Beijing, China, Beijing, China, 37T Magnetic Resonance Imaging Translational Medical Center, Southwest Hospital, Army Medical University (Third Military Medical University), Chongqing, China, Chongqing, China, 4School of Biomedical Engineering, Shanghai Jiao Tong University, Shanghai, China, Shanghai, China, 5The National Engineering Research Center of Advanced Magnetic Resonance Technologies for Diagnosis and Therapy (NERC-AMRT), Shanghai Jiao Tong University, Shanghai, China., Shanghai, China
Synopsis
Keywords: Cartilage, Joints, UTE-QSM
Motivation: Quantitative susceptibility mapping (QSM) may be a useful tool for studying the characteristics of collagen fibers in knee cartilage.The susceptibility quantification using GRE with fat saturation and relatively long TE may be further improved using UTE-QSM.
Goal(s): To measure the change in susceptibility values of knee cartilage in patients with different grades of OA using UTE-QSM.
Approach: A total of 13 knees from 10 patients who underwent both X-ray and MRI-UTE were enrolled.
Results: Our results show that in the posterior regions of the medial femoral condyle and lateral femoral condyle, the magnetic susceptibility value significantly decreases with the increase of OA grade.
Impact: UTE-QSM can promote osteoarthrologists and radiologists to better understand knee OA from different dimensions, and can provide more imaging evidence for monitoring the progress of OA, formulating treatment plans, and evaluating treatment effects.
INTRODUCTION
Degenerative osteoarthritis (OA) is a comprehensive and multi-level chronic progressive inflammation in the articular cartilage as the core [1]. Monitoring cartilage changes has important clinical significance for preventing the progression of osteoarthritis [2-3]. Quantitative susceptibility mapping (QSM) is a technique to estimate the spatial distribution of susceptibility voxel directions [4-6]. Thus, QSM may be a useful tool for monitoring early cartilage degeneration. Previous studies typically used a conventional gradient echo sequence (GRE) with fat saturation to suppress the chemical shift effect due to the presence of fat and with a relatively long echo time (TE) in the knee joint for QSM reconstruction [5]. However, the quantification of QSM may be affected by imperfect fat suppression and rapid signal decay of the collected GRE data. Combined QSM with ultrashort echo time (UTE-QSM) could be beneficial to avoid such issues [7]. Therefore, this study aims to measure the change in susceptibility values of knee cartilage in patients with different grades of OA to monitor the progress of OA by using UTE-QSM.METHODS
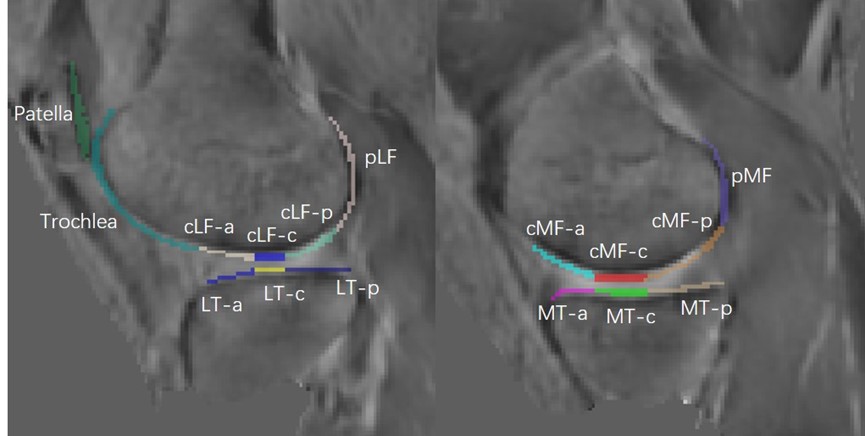
A total of 13 knees (6 left,7 right) from 10 patients using a 3-T scanner (uMR770, United Image Healthcare, Shanghai, China) with an 8-channel knee coil and X-ray. To get 6 TEs in total UTE sessions, two continuous UTE were taken for imaging each limb of the participants without repositioning. TEs of the first UTE scan, 0.07, 2.24, 3.95 msec; TEs of the second UTE scan, 0.1, 2.8, 4.6 msec. Other parameters for UTE were TR: 10msec, flip angle: 8, slice thickness: 0.9 mm, FOV: 180 × 160 mm2, matrix: 208 ×208. Using the X-ray K-L grading scale as the gold standard, the patients were divided into normal control group (K-L: grade 0, n=4), mild-to-moderate OA group (K-L: grade 1-2, n=5), and severe OA group (K-L: grade 3-4, n=4). The knee cartilage was manually segmented into 8 regions and 16 subregions based on the sagittal view of the GRE magnitude image, as shown in Figure 1. The water-fat separation method was applied to eliminate the chemical shift effect and produce the total field map [8]. The V-SHARP algorithm was used to recover the local field map from the total field map [9]. UTE-QSM was reconstructed using STAR-QSM [10]. The Wilcoxon signed-rank test was used to compare the mean susceptibility of different grades OA of each subregion. Spearman’s correlation was used to investigate the relationship between the mean susceptibility value and K-L grade.RESULTS
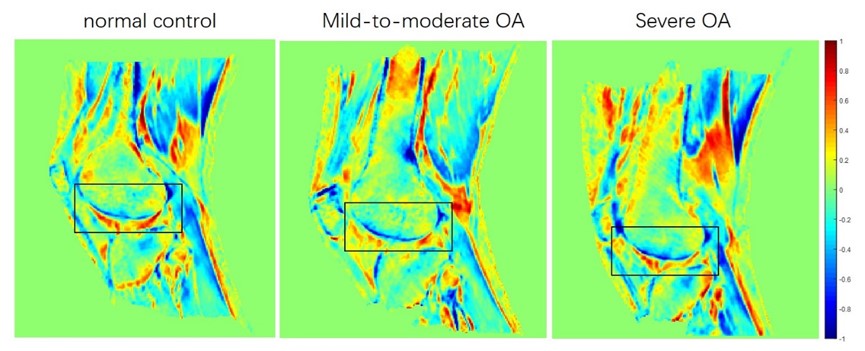
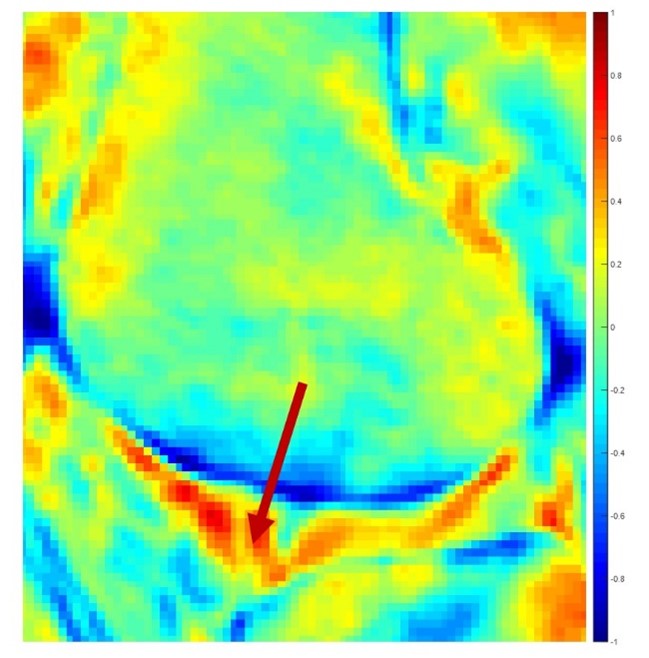
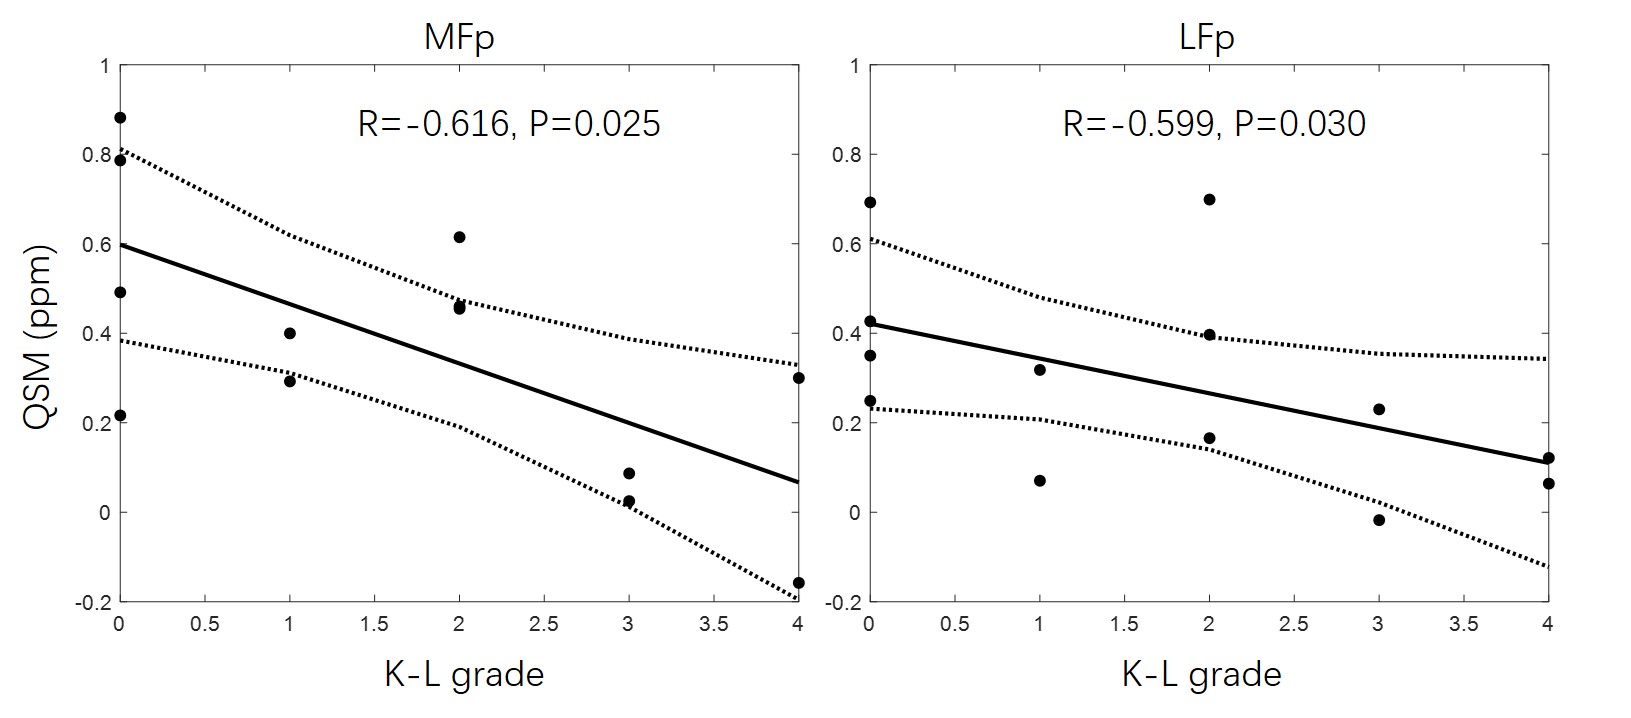
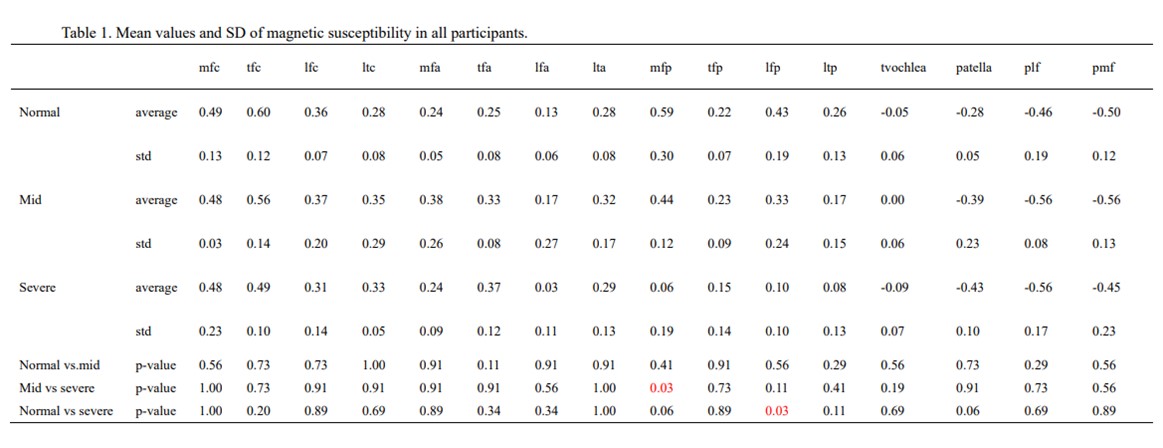
In this study, we observed a regional difference in magnetic susceptibility in cartilage with different grades of OA (Table 1), which manifested as a gradual decrease in magnetic susceptibility from the deep to the superficial layers of cartilage (Figure 2). In severe OA group, the magnetic susceptibility of the superior layer exhibits strong diamagnetism, while the diamagnetism of the intermediate layer is relatively weak (Figure 3). The magnetic susceptibility values of each subregion between different grades of OA are shown in Table 1. Compared with the normal group (0.429±0.190 ppm), the susceptibility value in the posterior region of the lateral femoral condyle (LF-p) was significantly lower (P=0.029) in the mild to moderate OA group (0.099±0.104 ppm). Also, we observed a significant (P=0.032) decrease trend in the posterior region of the medial femoral condyle between mild (0.444±0.117 ppm) and severe grades group (0.063±0.183 ppm). The Spearman correlation between the magnetic susceptibility values and the K-L grades was also studied for segmented compartments. Significant correlations were observed with R=-0.616 and P=0.025, R=-0.599 and P=0.030 for MF-p and LF-p, respectively (Figure 4).CONCLUSION
Using UTE-QSM, it is possible to achieve quantitative measurements of the magnetic susceptibility of each subregion of knee cartilage in OA patients [4,6,11]. Our results show that in the posterior regions of the medial femoral condyle and lateral femoral condyle, the magnetic susceptibility value significantly decreases with the increase of OA grade. This may be due to the changes in the orientation and anisotropy of collagen fibers in this region as cartilage degeneration progresses. Future studies should also focus on improving the in-plane resolution of UTE-QSM for better assessing the layer structure of knee cartilage. However, the current results show the possibility of QSM technology to quantitatively assess the changes in collagen fiber arrangement during the process of cartilage degeneration. Furthermore, combining UTE-QSM with other quantitative techniques such as T2-mapping and T1ρ-mapping [12-14] can comprehensively monitor and evaluate the whole process of joint cartilage degeneration and treatment, which can guide early prevention and clinical intervention.Acknowledgements
No acknowledgement found.References
[1] Ehmig, J.; Engel, G.; Lotz, J.; Lehmann, W.; Taheri, S.; Schilling, A.F.; Seif Amir Hosseini, A.; Panahi, B. MR-Imaging in Osteoarthritis: Current Standard of Practice and Future Outlook. Diagnostics 2023, 13, 2586. https://doi.org/10.3390/diagnostics13152586.
[2] Zhigang B , Bo K , Xichun S ,et al. Application of MRI T2-star-mapping imaging for cartilage quantitative analysis on the diagnosis of knee osteoarthritis[J].Ningxia Medical Journal, 2017.
[3] Qiao S , Fei F , Li-Ping Z ,et al.The Clinical Value of 3.0T MRI T2*Mapping Quantitative Analysis for Diagnosis of Knee Osteoarthritis[J].Chinese Journal of Ct & Mri, 2015.
[4] Dimov Alexey V,Li Jiahao,Nguyen Thanh D et al. QSM Throughout the Body.[J] .J Magn Reson Imaging, 2023, 57: 1621-1640.
[5] Change in Susceptibility Values in Knee Cartilage After Marathon Running Measured Using Quantitative Susceptibility Mapping[J].Journal of Magnetic Resonance Imaging, 2021.DOI:10.1002/jmri.27745.
[6] Zhang Qi,Geng Jiaolun,Zhang Ming et al. Cartilage morphometry and magnetic susceptibility measurement for knee osteoarthritis with automatic cartilage segmentation.[J] .Quant Imaging Med Surg, 2023, 13: 3508-3521.
[7] Zhang, M., Li, Z., Wang, H., Chen, T., Lu, Y., Yan, F., Zhang, Y., & Wei, H. (2022). Simultaneous Quantitative Susceptibility Mapping of Articular Cartilage and Cortical Bone of Human Knee Joint Using Ultrashort Echo Time Sequences. Frontiers in endocrinology, 13, 844351. https://doi.org/10.3389/fendo.2022.844351
[8] Hernando D, Kellman P, Haldar JP, Liang Z-P. Robust Water/Fat Separation in the Presence ofLarge Field Inhomogeneities Using a Graph Cut Algorithm. Magn Reson Med (2010) 63(1):79–90. doi: 10.1002/mrm.22177
[9] Wu B, Li W, Guidon A, Liu C. Whole Brain Susceptibility Mapping Using Compressed Sensing. Magn Reson Med (2012) 67(1):137–47. doi: 10.1002/ mrm.23000
[10] Wei H, Dibb R, Zhou Y, Sun Y, Xu J,Wang N, et al. Streaking Artifact Reduction for Quantitative Susceptibility Mapping of Sources With Large Dynamic Range. NMR BioMed (2015) 28(10):1294–303. doi: 10.1002/nbm.3383
[11] Wei Hongjiang,Lin Huimin,Qin Le et al. Quantitative susceptibility mapping of articular cartilage in patients with osteoarthritis at 3T.[J] .J Magn Reson Imaging, 2019, 49: 1665-1675.
[12] Chu Constance R,Williams Ashley A,West Robin V et al. Quantitative Magnetic Resonance
[13] Imamura Rui,Teramoto Atsushi,Murahashi Yasutaka et al. Ultra-Short Echo Time-MRI T2* Mapping of Articular Cartilage Layers Is Associated with Histological Early Degeneration.[J] .Cartilage, 2023, undefined: 19476035231205685.
[14] Ehmig Jonathan,Engel Günther,Lotz Joachim et al. MR-Imaging in Osteoarthritis: Current Standard of Practice and Future Outlook.[J] .Diagnostics (Basel), 2023, 13: undefined.
Figures