5037
Water T2 mapping from low to high fat fraction values in lower limb skeletal muscles of different neuromuscular disorders1NMR Laboratory, Neuromuscular Investigation Center, Institute of Myology, Paris, France
Synopsis
Keywords: Muscle, Modelling, biomarkers, neuromuscular, water T2, fat fraction
Motivation: Muscle water T2 is an interesting quantitative MRI biomarker in neuromuscular disorders but its interpretation is influenced by the presence of fat.
Goal(s): We investigated how this water T2-fat relationship differed between nine different neuromuscular disorders.
Approach: We looked at linear and 2nd degree polynomial fits, all obtained with the same 3-T system, sequence and post-processing pipeline.
Results: Polynomial fitting describes the data better and the water T2-fat relationship needs to be interpreted in a disease-specific context, especially when there is a known inflammatory component and/or if water T2 is increased before the occurrence of any muscle fat replacement.
Impact: The relationship between MRI biomarkers water T2, reflecting active muscle damage, and fat fraction, reflecting disease progression, should be interpreted in the context of the disease, whether or not there is inflammation or extensive active muscle damage.
Background
Quantitative MRI is extensively being used nowadays in the evaluation of disease progression in neuromuscular diseases (NMDs). In many such studies quantitative fat-water MRI such as the Dixon method is used to assess muscle fat fraction (FF)1,2. A close second in use is T2 as quantitative MRI biomarker, by using T2 mapping methods1,2. The value of T2 is a sensitive yet unspecific biomarker, as an increase can reflect inflammation, edema, necrosis, …. In diseases where muscle fat replacement occurs, it is important to discriminate between T2 of fat and T2 of water, the latter reflecting the actual muscle tissue. Besides fat suppression performed at the acquisition level, most often this T2 deconvolution is done by various post-processing strategies3,4,5. It has been shown in muscle diseases, such as in Duchenne muscular dystrophy (DMD) and spinal muscular atrophy (SMA), that high FF values have a decreasing impact on the value of water T25. Here, we look into the relation between FF, from 0 to 90%, and water T2 in nine different NMDs (including DMD and SMA), ranging from inflammatory myopathies to muscle diseases with a secondary inflammatory component and non-inflammatory myopathies.Methods
Database | For this study, we investigated leg and thigh MRI data sets (left and right sides), obtained in nine different NMDs (Table 1). Healthy control data stem from 43 adults (>18 years) and 47 minors (<18 years).Data acquisition | All data were obtained on the same 3-T Siemens system. Quantitative water-fat imaging was performed using a 3D gradient-echo sequence (Dixon) with the following parameters: TEs of 2.75, 3.95 and 5.15 ms, a TR of 10 ms, a flip angle of 3°, a spatial resolution of 1.0x1.0x5.0 mm3, 64 slices. For T2 mapping, a 2D multi-spin-echo (MSE) was used with the following parameters: 17 equidistant TEs (9.5-161.5 ms), TR of 3000 ms, in-plane resolution of 1.4x1.4 mm2, 7 slices, slice thickness of 10 mm, a slice gap of 30 mm. A B1+ map sequence was run covering the same slices as the MSE sequence.
Data processing | MRI sequences were always centered at one-third of the femur (thigh) and at the widest part of the calf (leg). Using the MSE images, quantitative water T2 maps were reconstructed based on a tri-exponential fitting procedure3. Only pixels where B1+ values were between 80% and 120% of the prescribed flip angle were accepted for analysis. Manually segmented regions of interest (Figure 1) that included <10 pixels were excluded for analysis. FF values were computed using the Dixon images (co-registered to the five MSE image slices), as the ratio of the fat signal and the sum of the fat and water signal.
Data analysis | Data were fitted using both a linear and a 2nd order polynomial. The adjusted R2 was computed. An F-test was used to compare the different regression analyses. Significance level was P<0.05. Normal water T2 values were determined from a database of healthy volunteers with 38.6 ms and 36.7 ms as the 90th percentile value in adults and minors, respectively.
Results
In all nine diseases, polynomial fitting described the data better than linear regression (Table 2, Figure 2). In the inflammatory myopathy IBM, water T2 initially increases with higher FF (see 1st degree coefficient in Table 3: highest b for all NMDs!), remained high at high levels of FF (40-60%) and compensates partially the negative correlation with fat at high FF values. In IMNM, also an inflammatory myopathy but with less severe inflammation, this impact was more evident. This was also observed in GNEM, late-onset Pompe disease and LGMDR9, which are all non-inflammatory myopathies. In DYS and FSHD, both dystrophic diseases with an inflammatory component, this relationship was less evident: for DYS, elevated water T2 was persistent across the FF range; for FSHD, the patients in the current cohort showed very minor inflammation but still the impact of high FF could be seen. Finally, the impact of high FF on water T2 was quite evident in SMA and DMD. In DMD, we observe the highest water T2 at FF=0% of all NMDs (see Table 3), corroborating earlier reports that water T2 is abnormal prior to any macroscopic changes in DMD6.Conclusion
Quantitative MRI-based water T2 values need to be carefully interpreted across the FF range, as was also earlier described using 1H MRS, the ‘gold standard’ for measuring muscle water T27,8. This relationship also needs to be interpreted in a disease-specific context, as we observe here in IBM, IMNM and DYS, for instance.Acknowledgements
No acknowledgement found.References
1Carlier PG, Marty B, Scheidegger O, et al. Skeletal muscle quantitative nuclear magnetic resonance imaging and spectroscopy as an outcome measure for clinical trials. J Neuromuscul Dis. 2016;3(1):1-28.
2Strijkers G, Caldas de Almeida Araujo E, Azzabou N, et al. Exploration of New Contrasts, Targets, and MR Imaging and Spectroscopy Techniques for Neuromuscular Disease - A Workshop Report of Working Group 3 of the Biomedicine and Molecular Biosciences COST Action BM1304 MYO-MRI. J Neuromuscul Dis. 2019;6(1):1-30.
3Azzabou N, Loureiro de Sousa P, Caldas de Almeida Araujo E, Carlier PG. Validation of a generic approach to muscle water T2 determination at 3T in fat-infiltrated skeletal muscle. J Magn Reson Imaging. 2015;41(3):645-653.
4Marty B, Baudin PY, Reyngoudt H, et al. Simultaneous muscle water T2 and fat fraction mapping using transverse relaxometry with stimulated echo compensation. NMR Biomed 2016;29:431-443.
5Keene KR, Beenakker JWM, Hooijmans MT, et al. T2 relaxation-time mapping in healthy and diseased skeletal muscle using extended phase graph algorithms. Magn Reson Med 2020;84:2656-2670.
6Hooijmans MT, Niks EH, Burakiewicz J, et al. Elevated phosphodiester and T2 levels can be measured in the absence of fat infiltration in Duchenne muscular dystrophy patients. NMR Biomed 2017;30:3367.
7Schlaeger S, Weidlich D, Klupp E, et al. Decreased water T2 in fatty infiltrated skeletal muscles of patients with neuromuscular diseases. NMR Biomed 2019;32:e4111.
8Reyngoudt H, Baudin PY, Carlier PG, et al. New insights into the spread of MRS-based water T2 values observed in highly fatty replaced muscles. J Magn Reson Imaging. 2023;58(5):1557-1568.
Figures
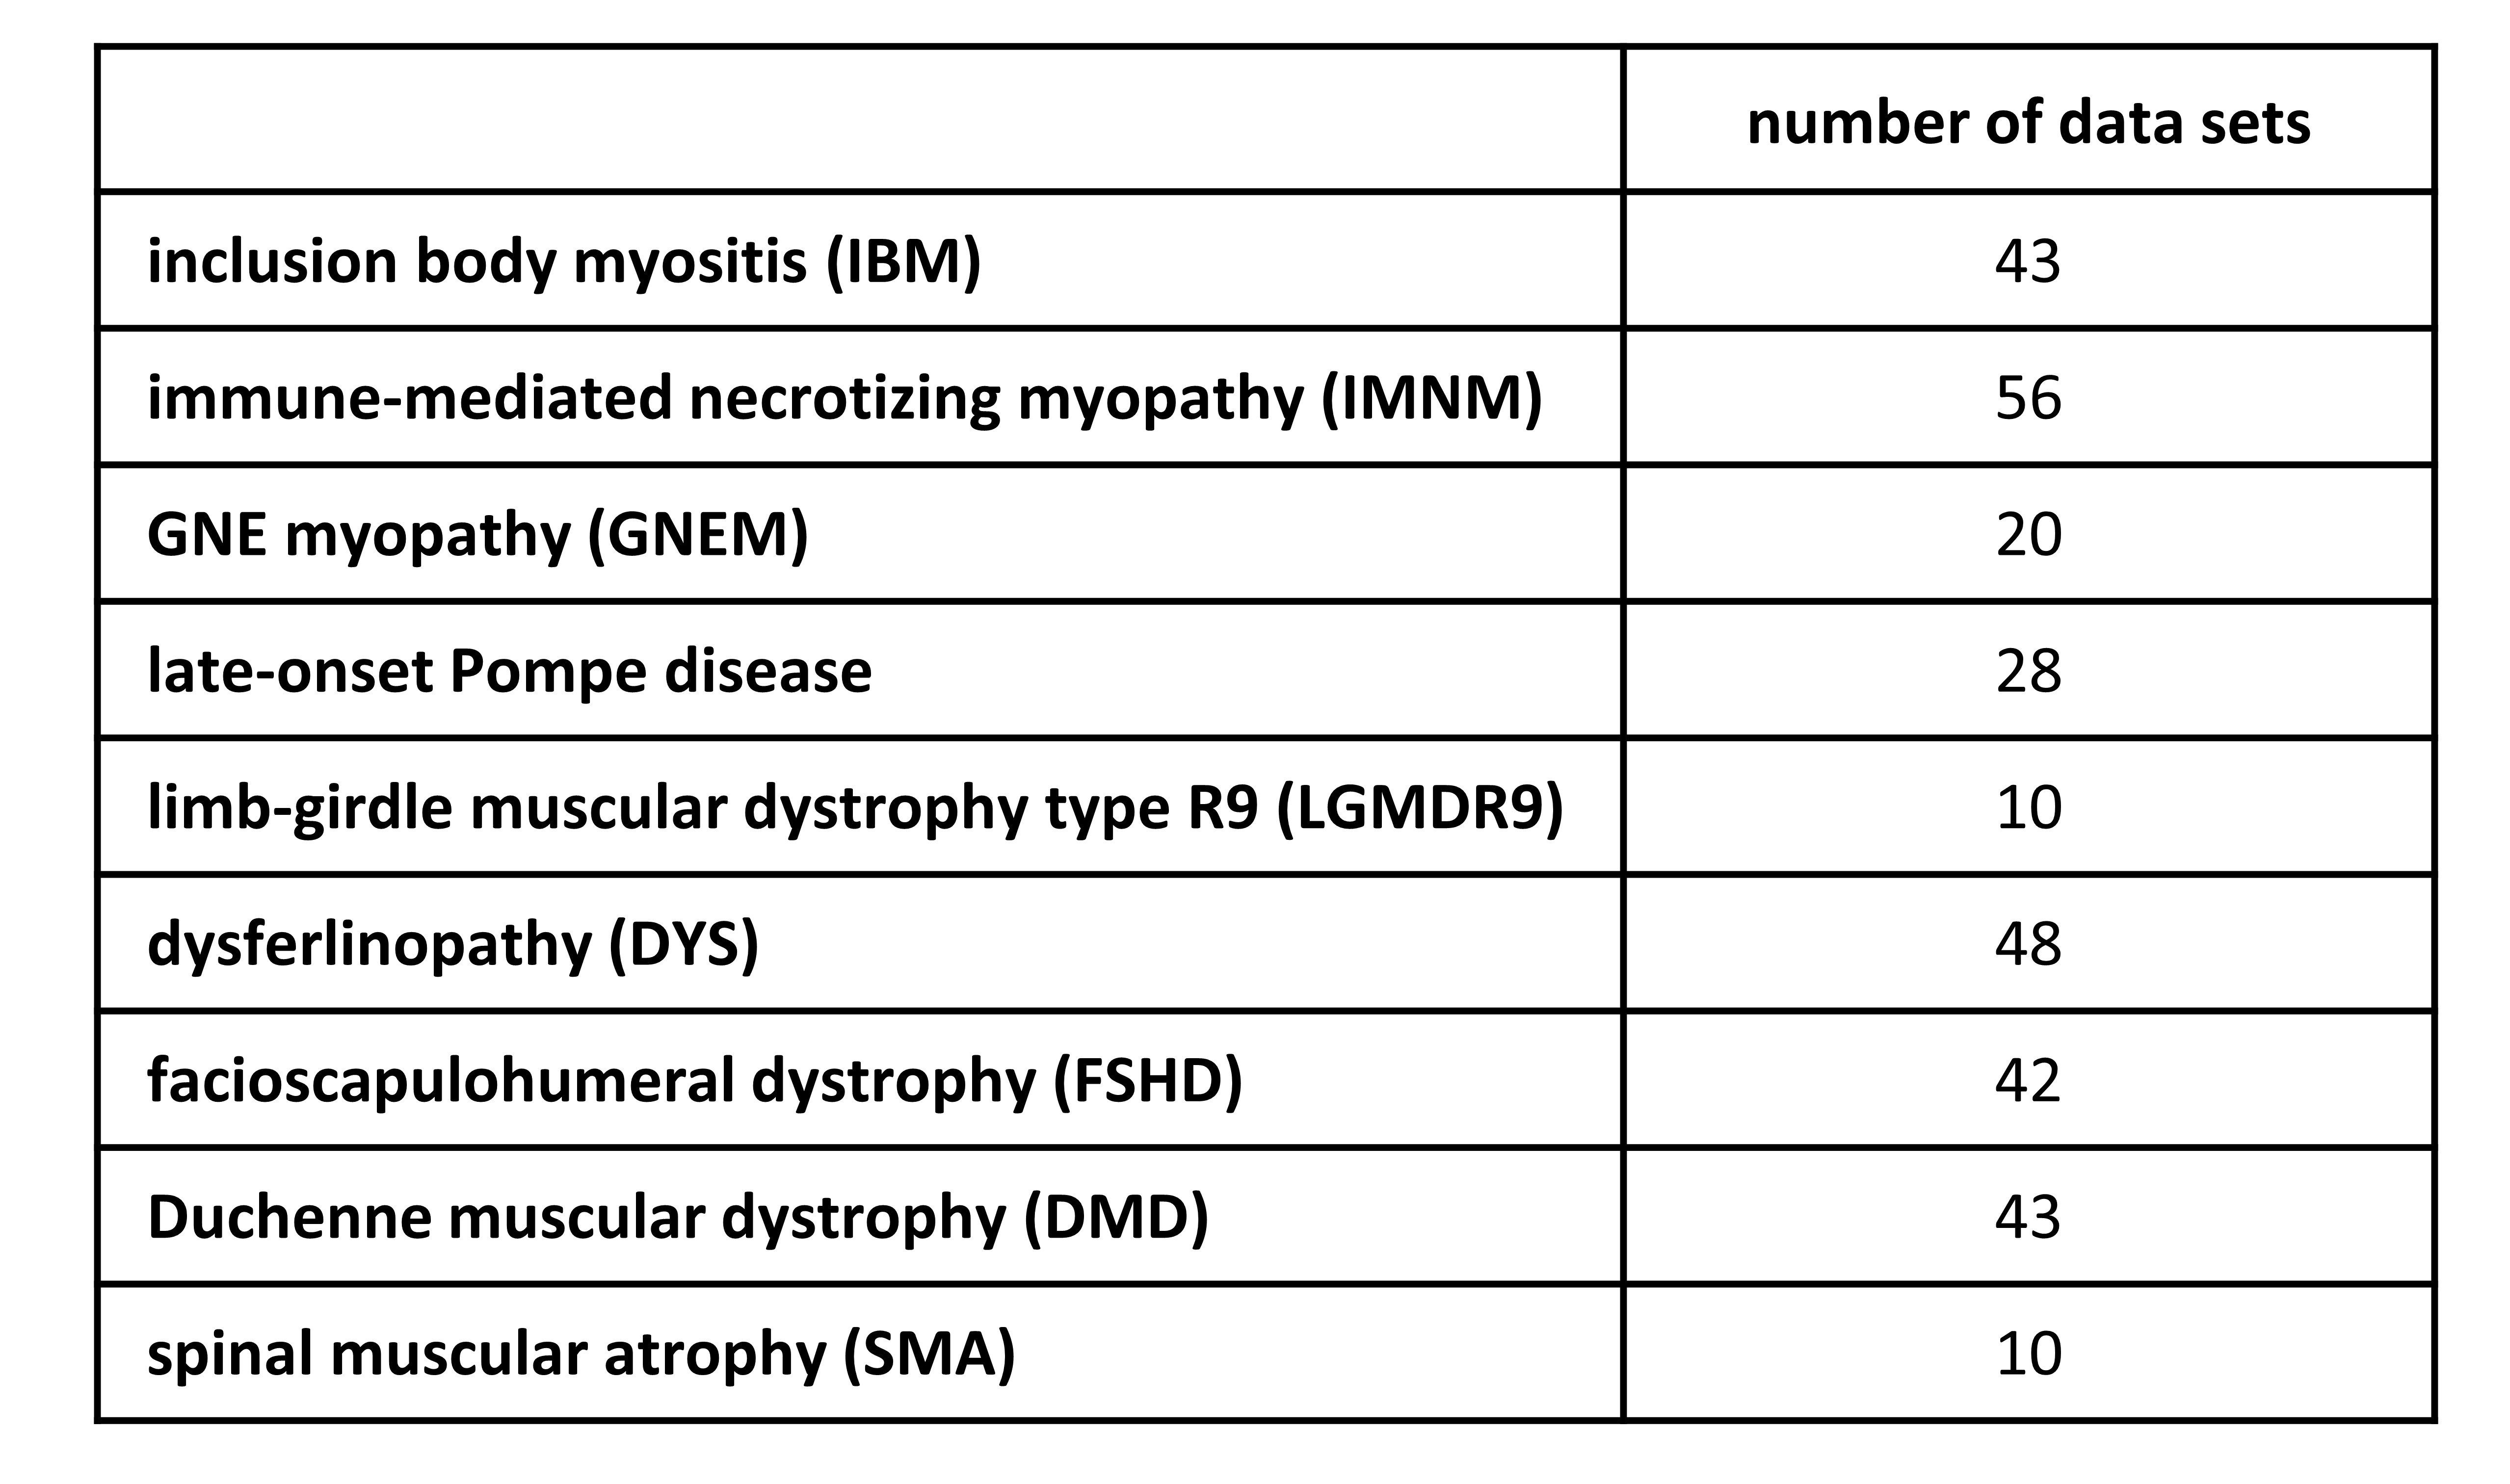
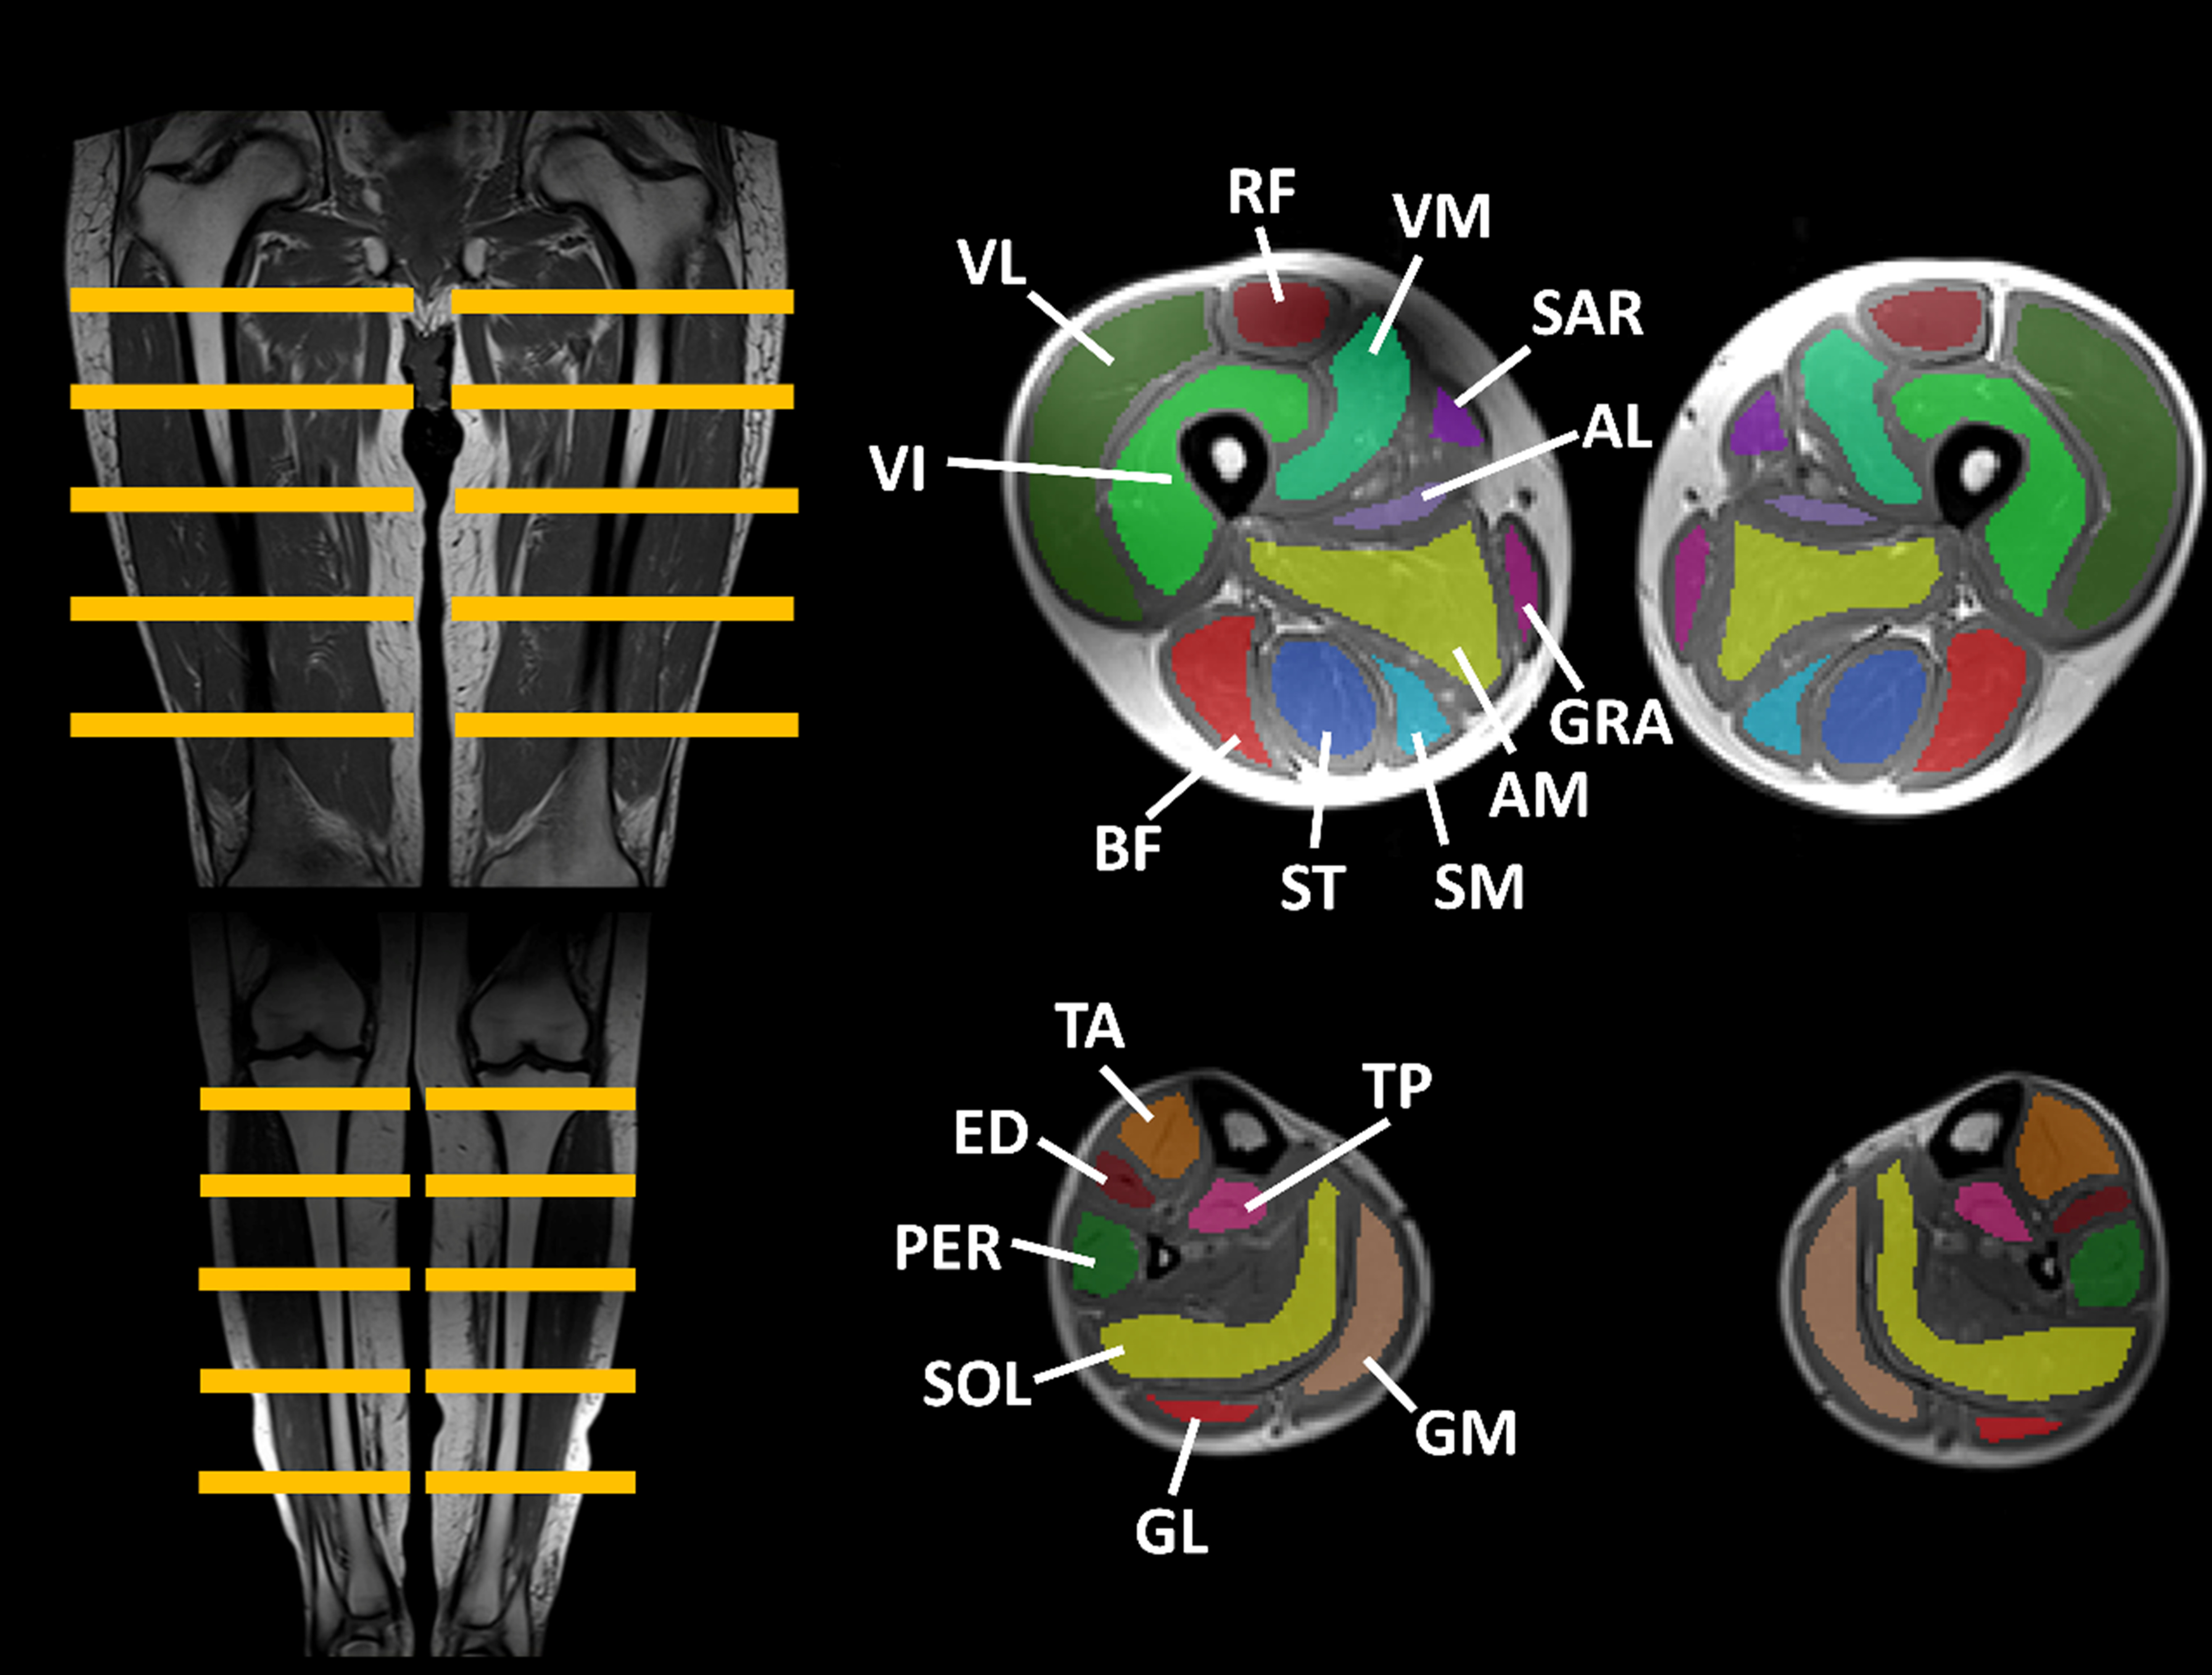
Figure 1. Lower limb regions of interest (ROIs).
Illustration of the individually drawn muscle ROIs across 5 slices in the thigh and the leg.
AL, adductor longus, AM, adductor magnus, BF, biceps femoris, ED, extensor digitorum, GL, gastrocnemius lateralis, GM, gastrocnemius medialis, GRA, gracilis, PER, peroneus, RF, rectus femoris, SAR, sartorius, SM, semimembranosus, SOL, soleus, ST, semitendinosus, TA, tibialis anterior, TP, tibialis posterior, VI, vastus intermedius, VL, vastus lateralis, VM, vastus medialis.
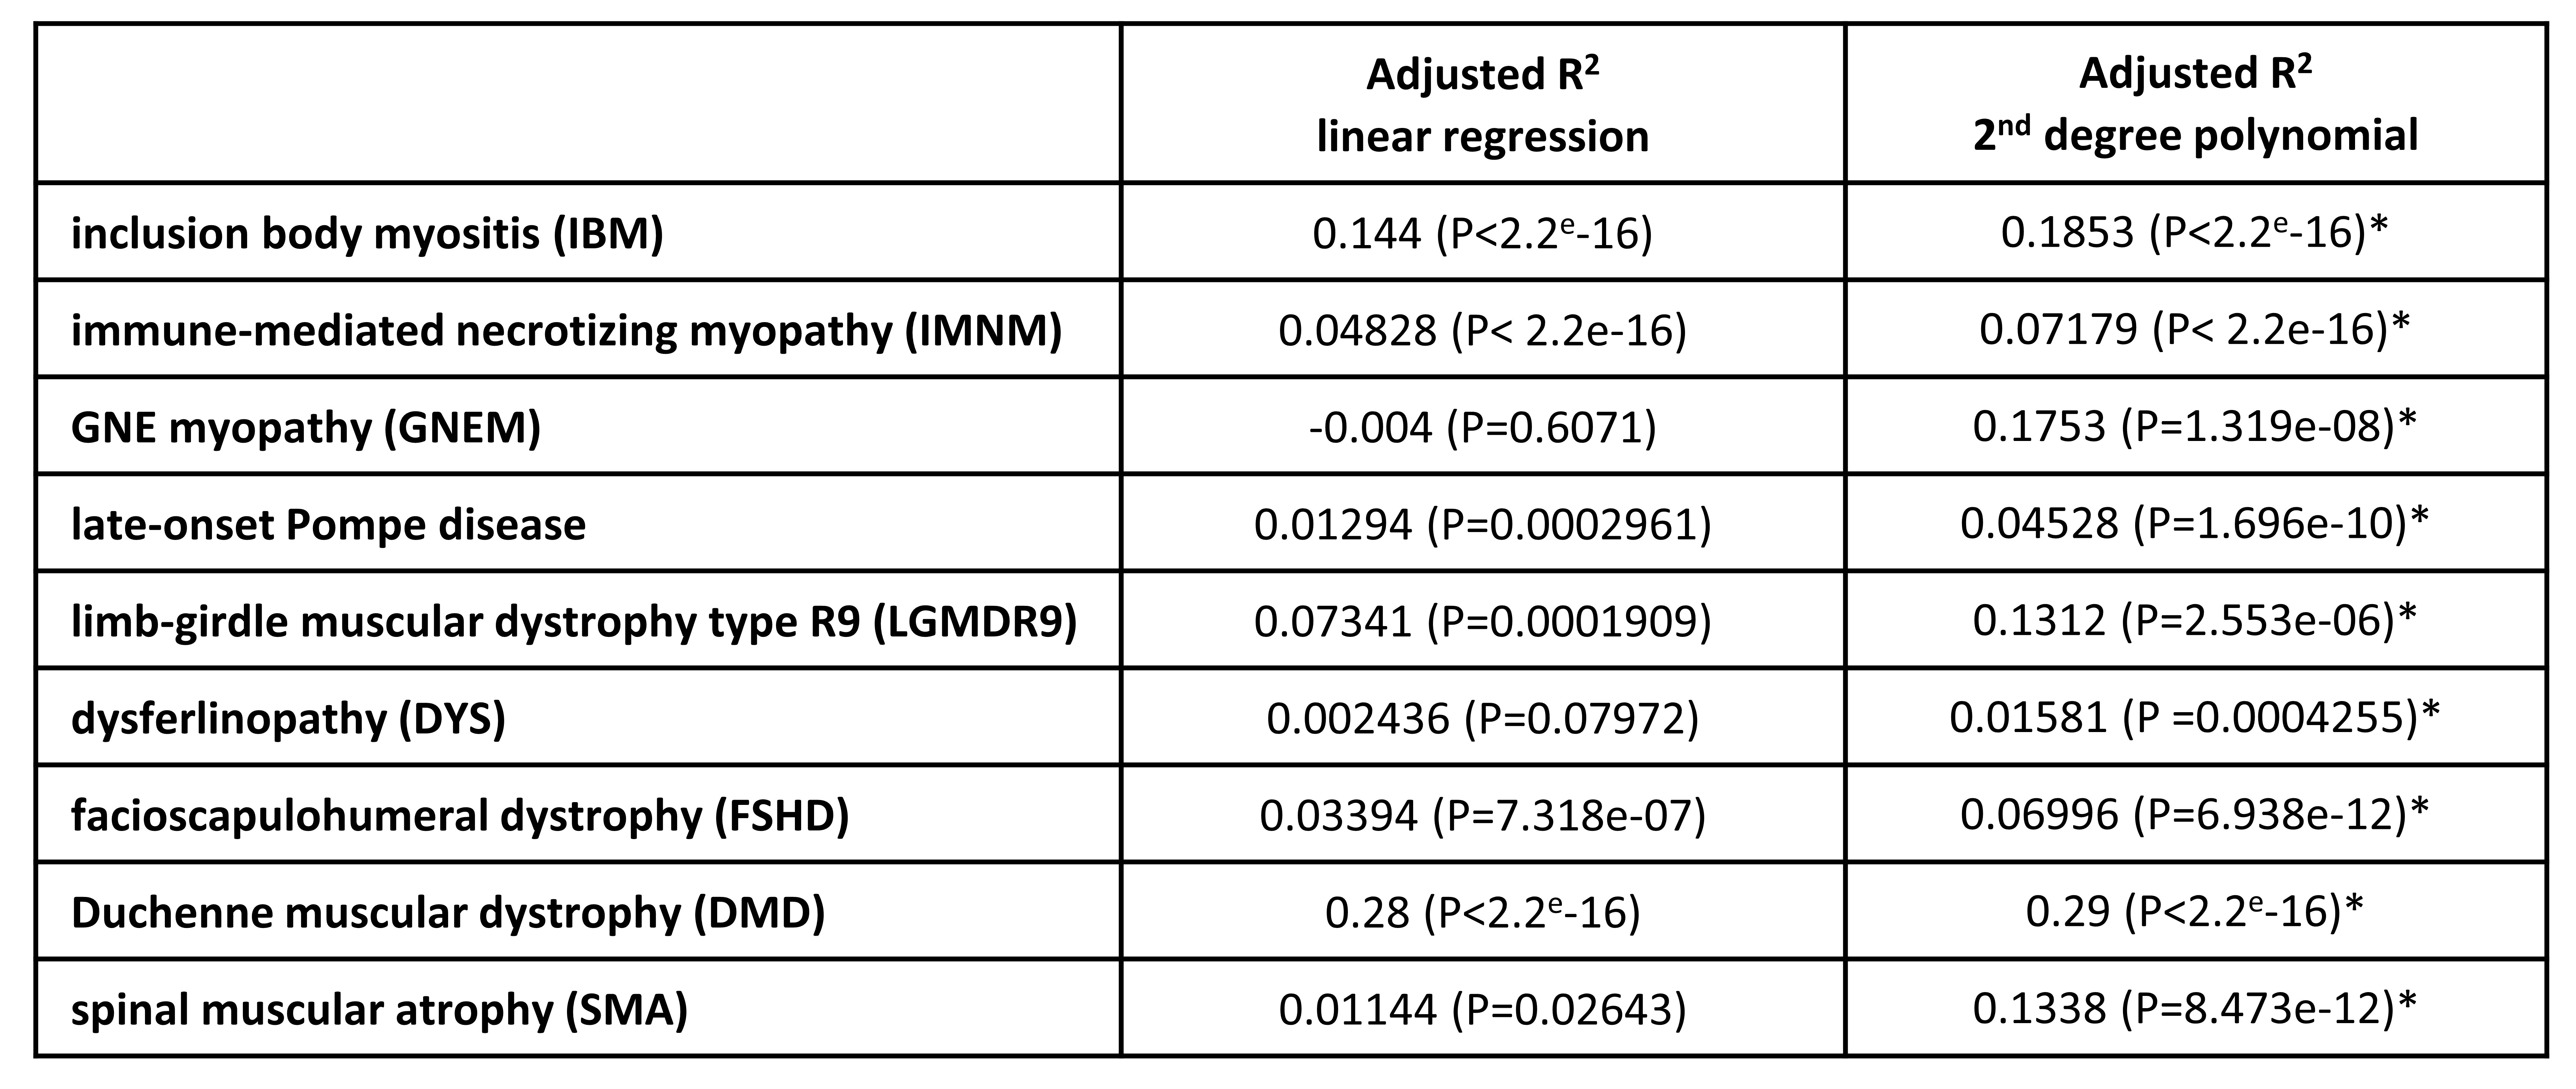
Table 2. Adjusted R2 values for linear and polynomial regression of FF-water T2 relationship in different neuromuscular disorders.
* F-test to compare which fit describes the data better (P<0.05).
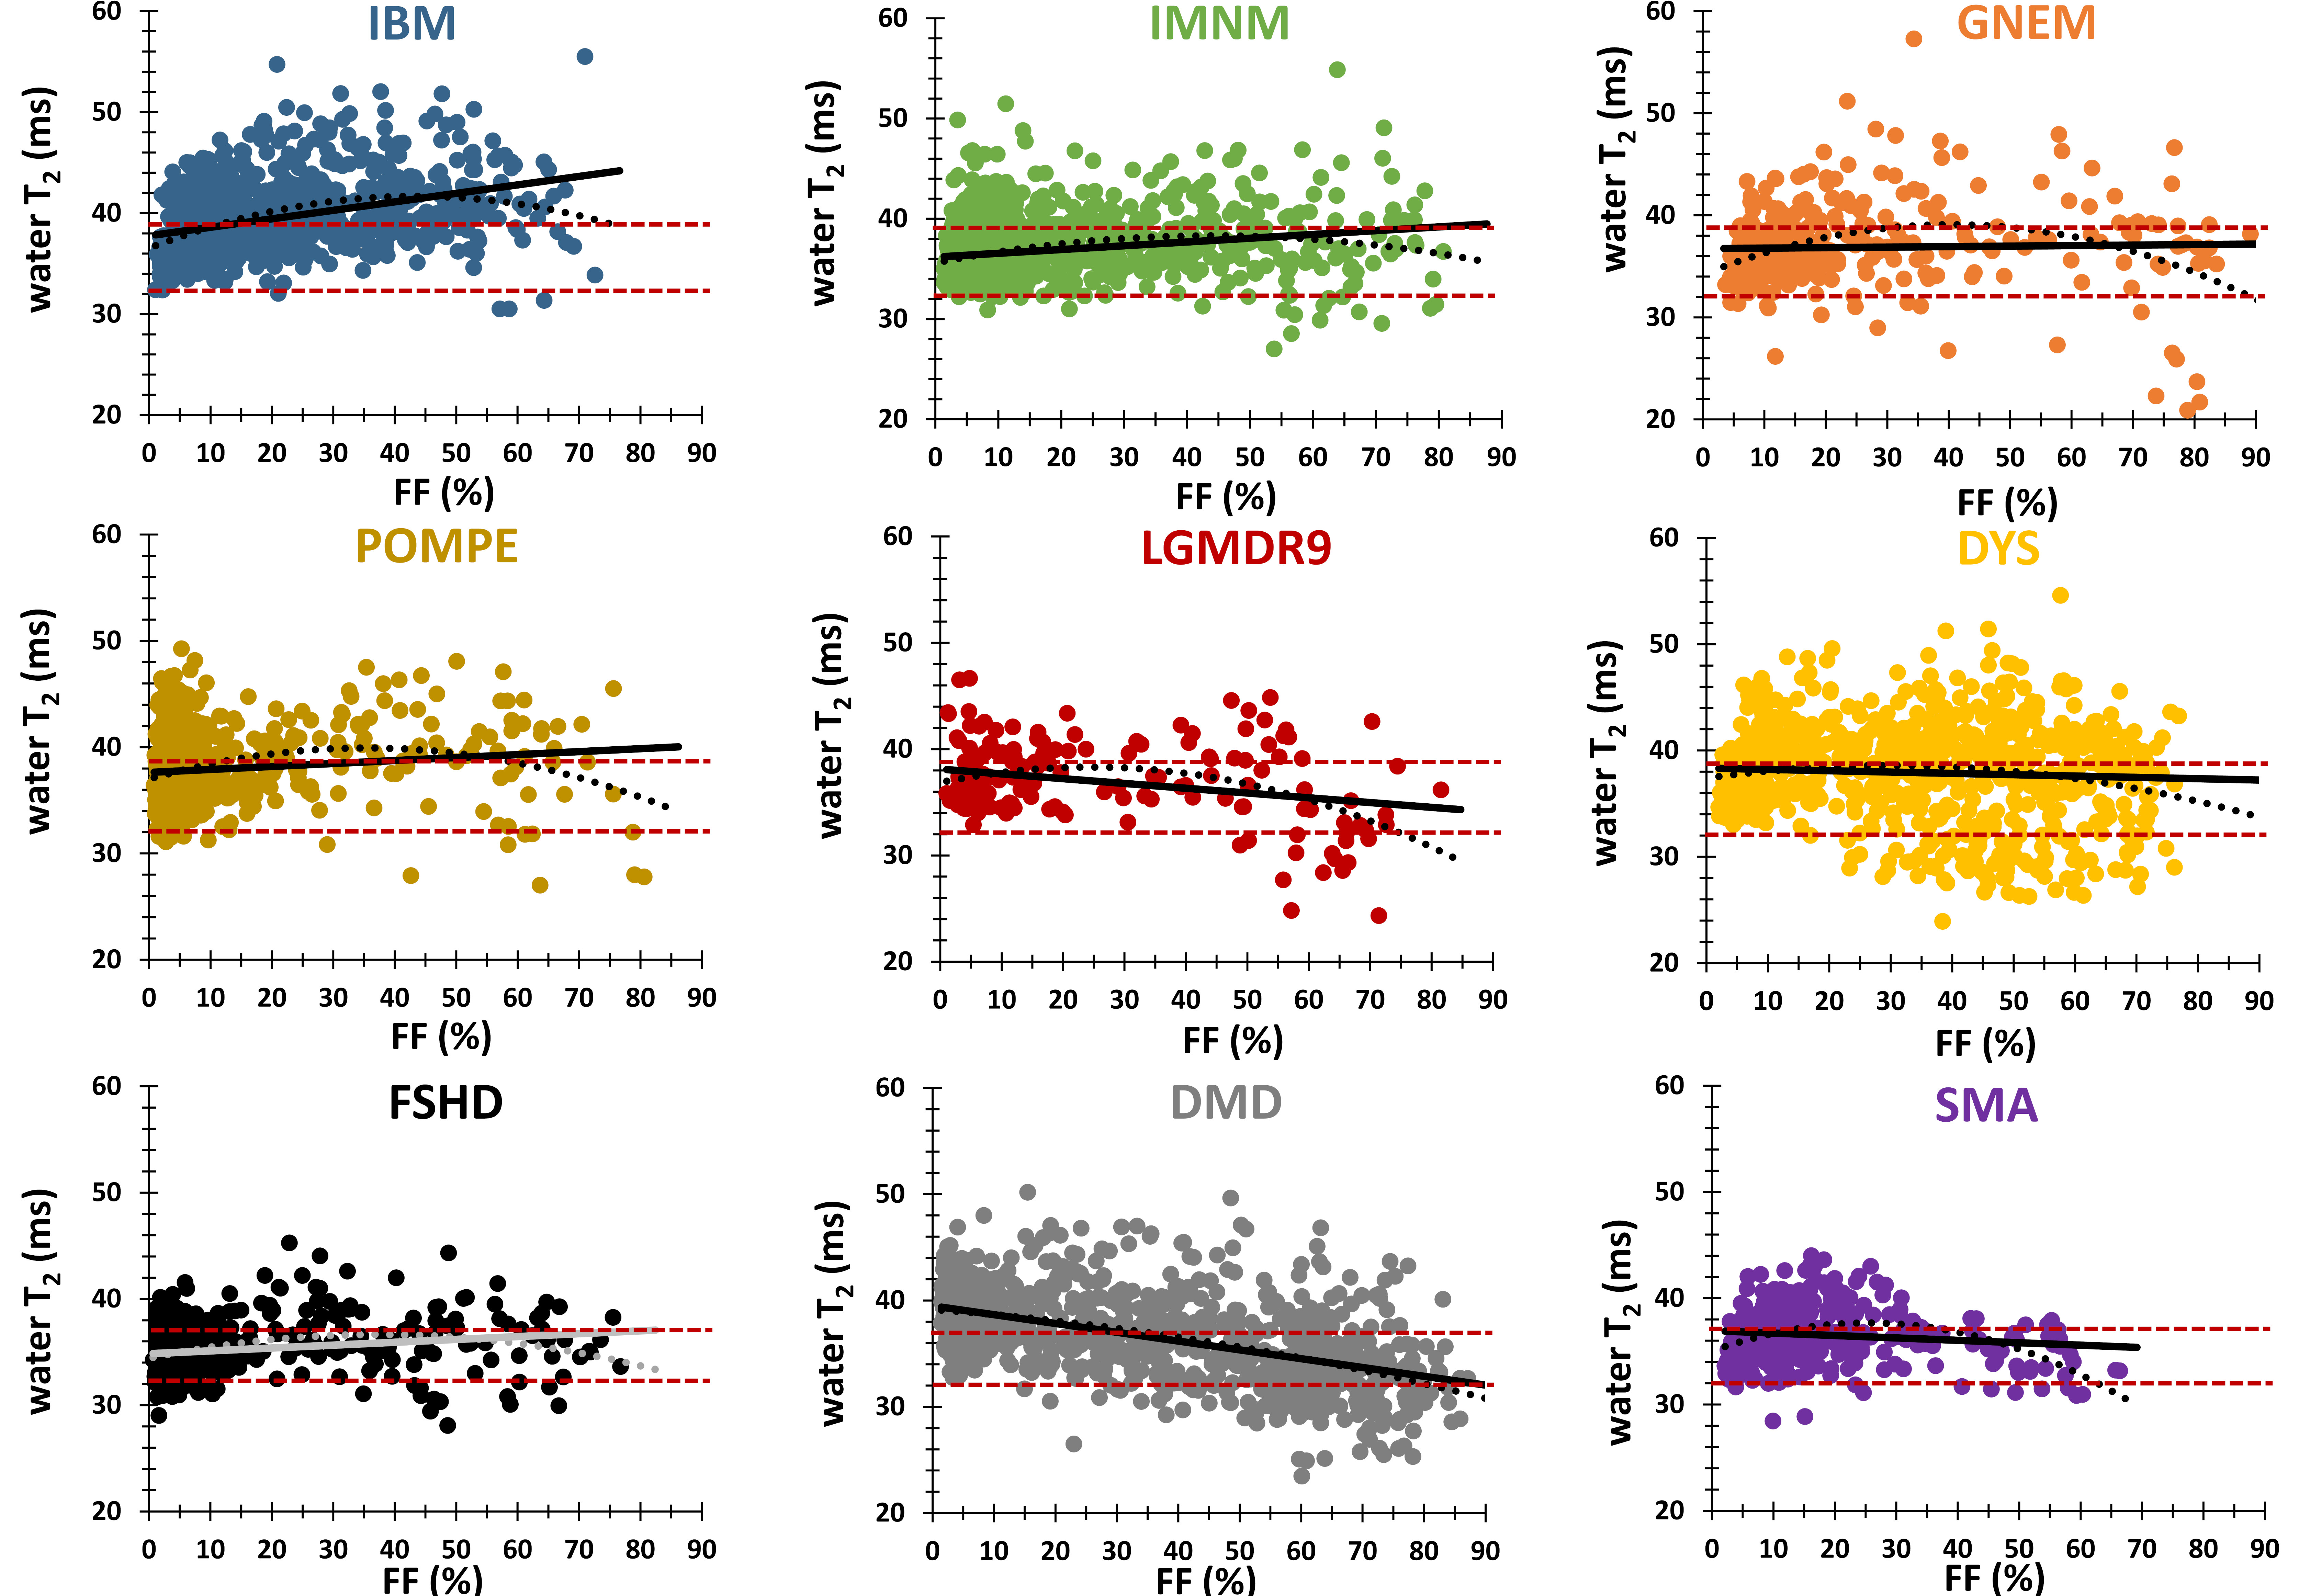
Figure 2. Relationship FF - water T2 in different neuromuscular disorders.
For all neuromuscular disorders, both linear (solid line) and polynomial (dotted line) fits are depicted. The red upper dashed lines depicts the 90th and 10th percentile values in healthy control volunteers (adults: 38.7 and 32.1 ms, minors: 36.7 and 32.2 ms, respectively).
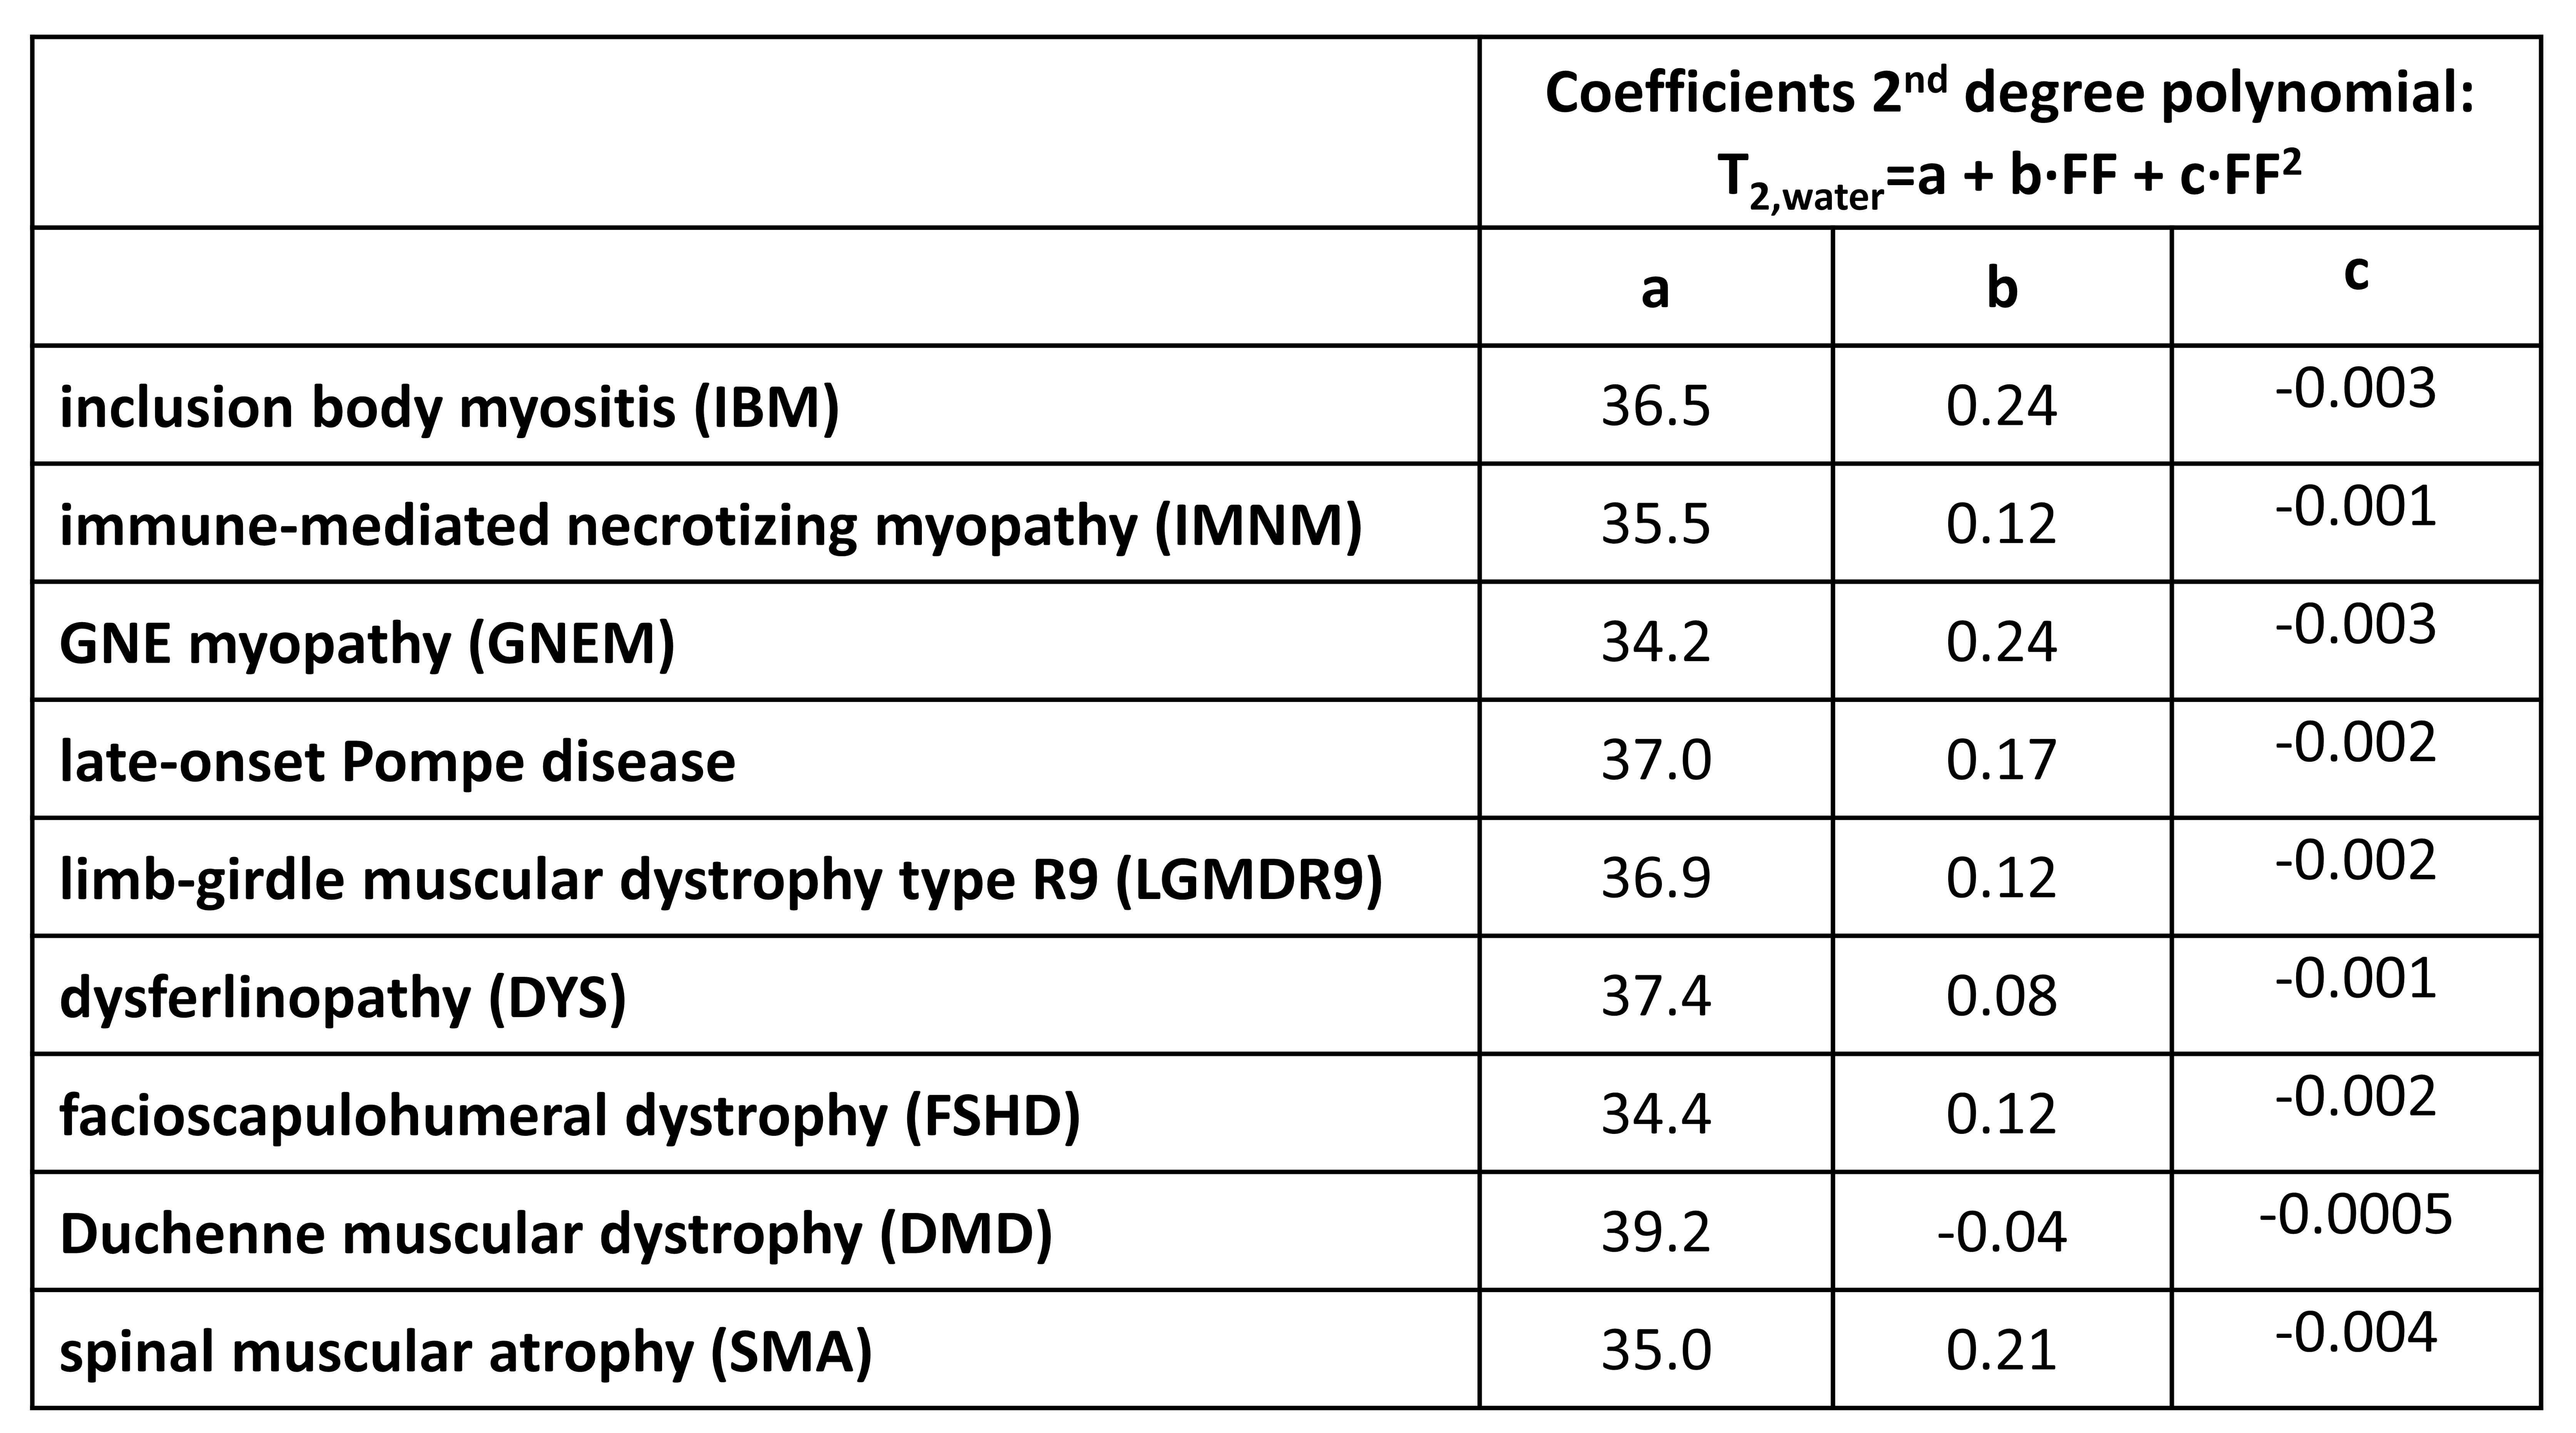
Table 3. Coefficients of 2nd degree polynomial in different neuromuscular disorders.
a reflects water T2 at FF=0% (before any muscle fat replacement).
b reflects linear correlation between FF and water T2 at low to moderate FF value.
c reflects the extent of the negative effect of FF on water T2 at high FF values.