5036
The MOTION study – First quantitative muscle MRI results in a large cross-sectional cohort of healthy subjects1Radiology, UMC Utrecht, Utrecht, Netherlands, 2Child Development and Exercise Center, UMC Utrecht, Utrecht, Netherlands, 3Department of Neurology, BG-University Hospital Bergmannsheil gGmbH, Bochum, Germany
Synopsis
Keywords: Muscle, Muscle, Quantitative Imaging
Motivation: The overall aim of our ongoing study MOTION is to connect whole leg quantitative MRI (qMRI) and muscle structure to function and lifestyle in 162 healthy volunteers.
Goal(s): Preliminary analysis of 31 subjects to identify potential covariates that may impact qMRI measurements.
Approach: Muscle fat fraction (FF), mean diffusivity (MD), fractional anisotropy (FA) and T2water were determined in 20 muscles from tendon to tendon bilaterally, and related to age, gender, and body composition.
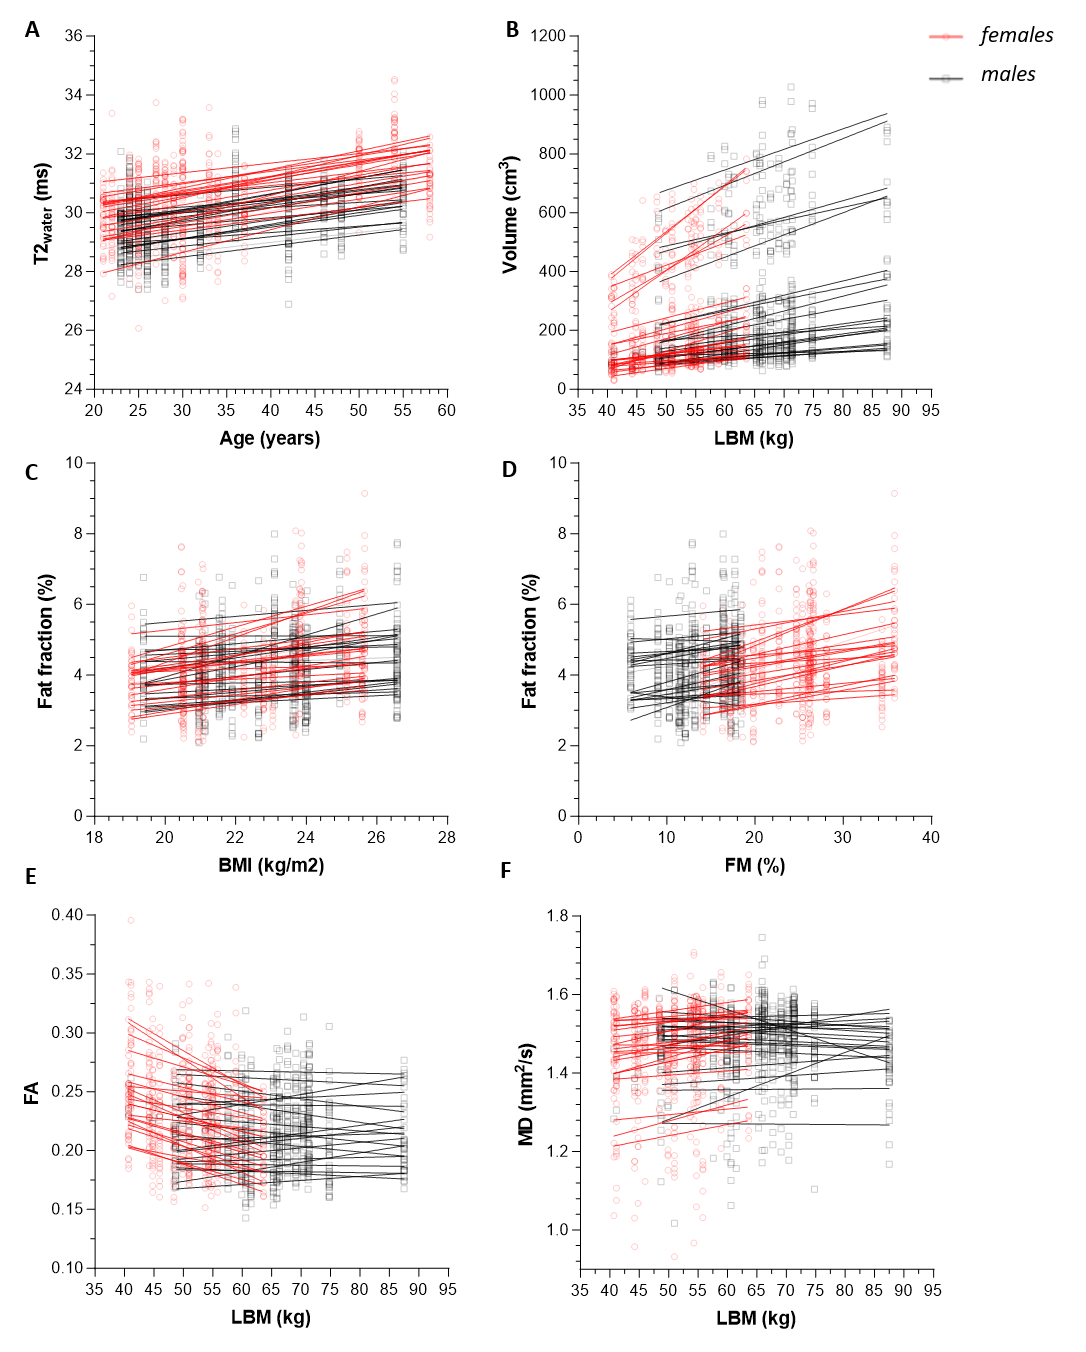
Results: Muscle FF is higher in heavier subjects with more body fat. FA is lower and MD and volume are higher in larger subjects. T2water depends on age and gender.
Impact: Accounting for covariates describing body composition (BMI, lean body mass and body fat mass) on top of gender and age is crucial for proper interpretation of quantitative muscle MRI in clinical studies on neuromuscular disease patients and healthy controls.
Introduction
Quantitative MRI (qMRI) is widely used in the evaluation of neuromuscular disorders.1,2 It is sensitive for pathology, but often lacks specificity and does not link to muscle function. Our ongoing cross-sectional study (MOTION) aims to connect whole-leg qMRI and muscle structure to function and lifestyle in 162 healthy aging volunteers. In this preliminary analysis, our objective is to identify critical covariates for qMRI, including gender, age and body composition. Identifying these covariates is crucial for proper qMRI interpretation in studies involving neuromuscular disease and healthy controls.Methods
At the moment, 31 subjects underwent bilateral lower extremity scans from hip to ankle with a 3T Philips MR scanner. Subjects were positioned supine, ankles in 20° plantar flexion, and knee and heel supported to avoid calf muscle compression. The 45-minute MRI protocol comprised a 10-echo Dixon-based sequence for fat quantification, diffusion tensor imaging with 30 weightings to asses diffusion properties and a 13-echo multi-echo spin-echo sequence for measuring muscle water T2 (T2water). Body composition was evaluated by measuring length, weigth and BMI, and estimating lean body mass (LBM;kg) and fat mass (FM;%) using bio-electrical impedance analysis (BIA).Images were processed using QMRITools.3 All thigh and leg muscles were automatically segmented from tendon to tendon. The analysis specifically included individual muscles in the leg anterior and posterior compartments, and quadriceps, hamstrings and adductor muscles of the thigh. For each muscle, fat fraction (FF), fractional anisotropy (FA), mean diffusivity (MD), T2water and muscle volume were quantified.4
Statistical analysis
First, the effect of gender, muscle type and side (right/left) was examined, as literature already suggest these may confound qMR.4–6 We used a two-level linear mixed model (LMM; level1-muscle, level2-subject),with qMRI measures being dependent variables and gender, muscle type and side independent fixed factors. Additionally, SNR was included for diffusion measures. Variables that significantly influenced qMRI were incorporated into a second LMM, evaluating the relationship between age and body composition measures (BMI/length/weight/LBM/FM) with qMRI.
Results
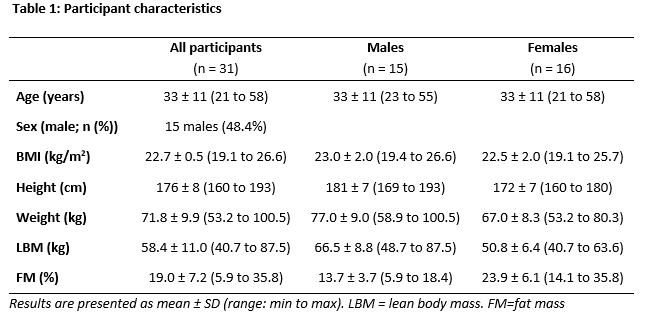
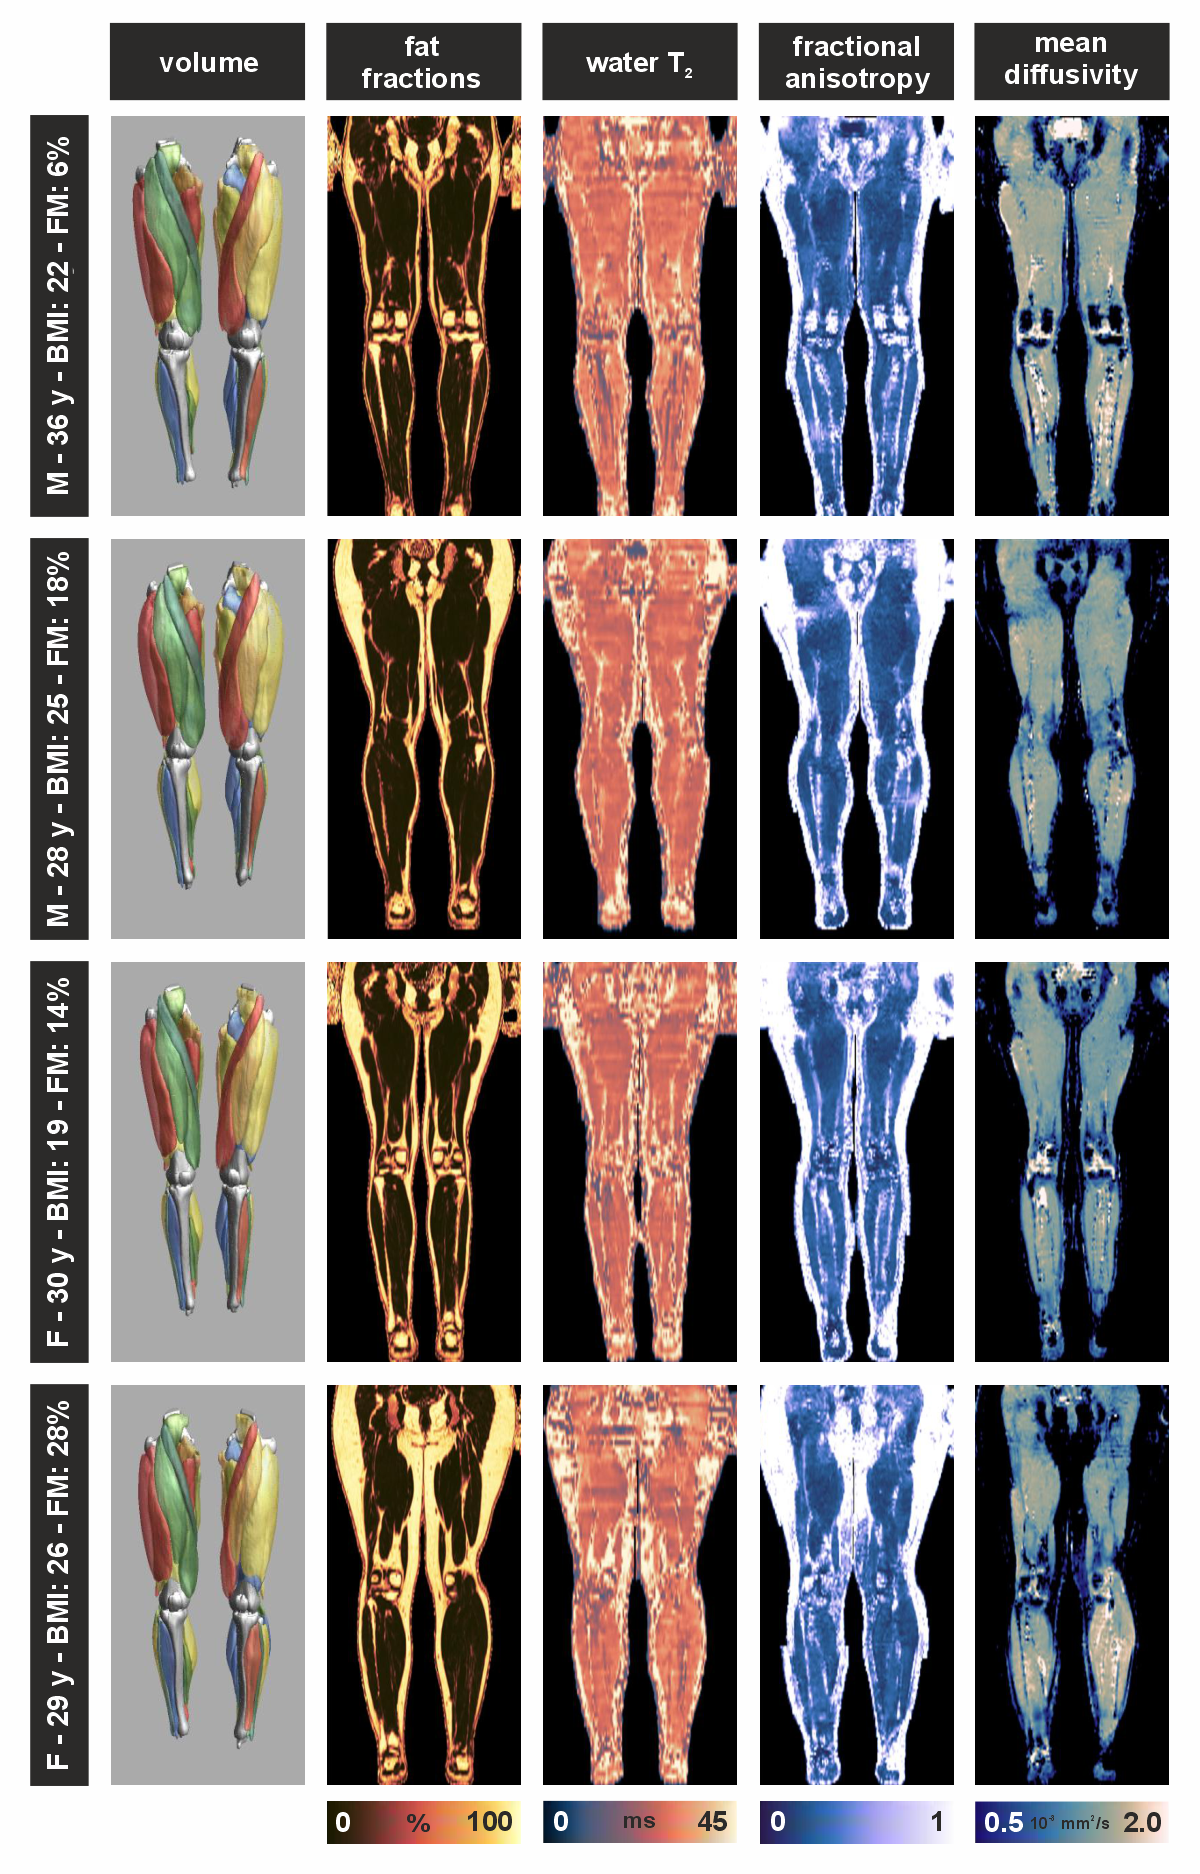
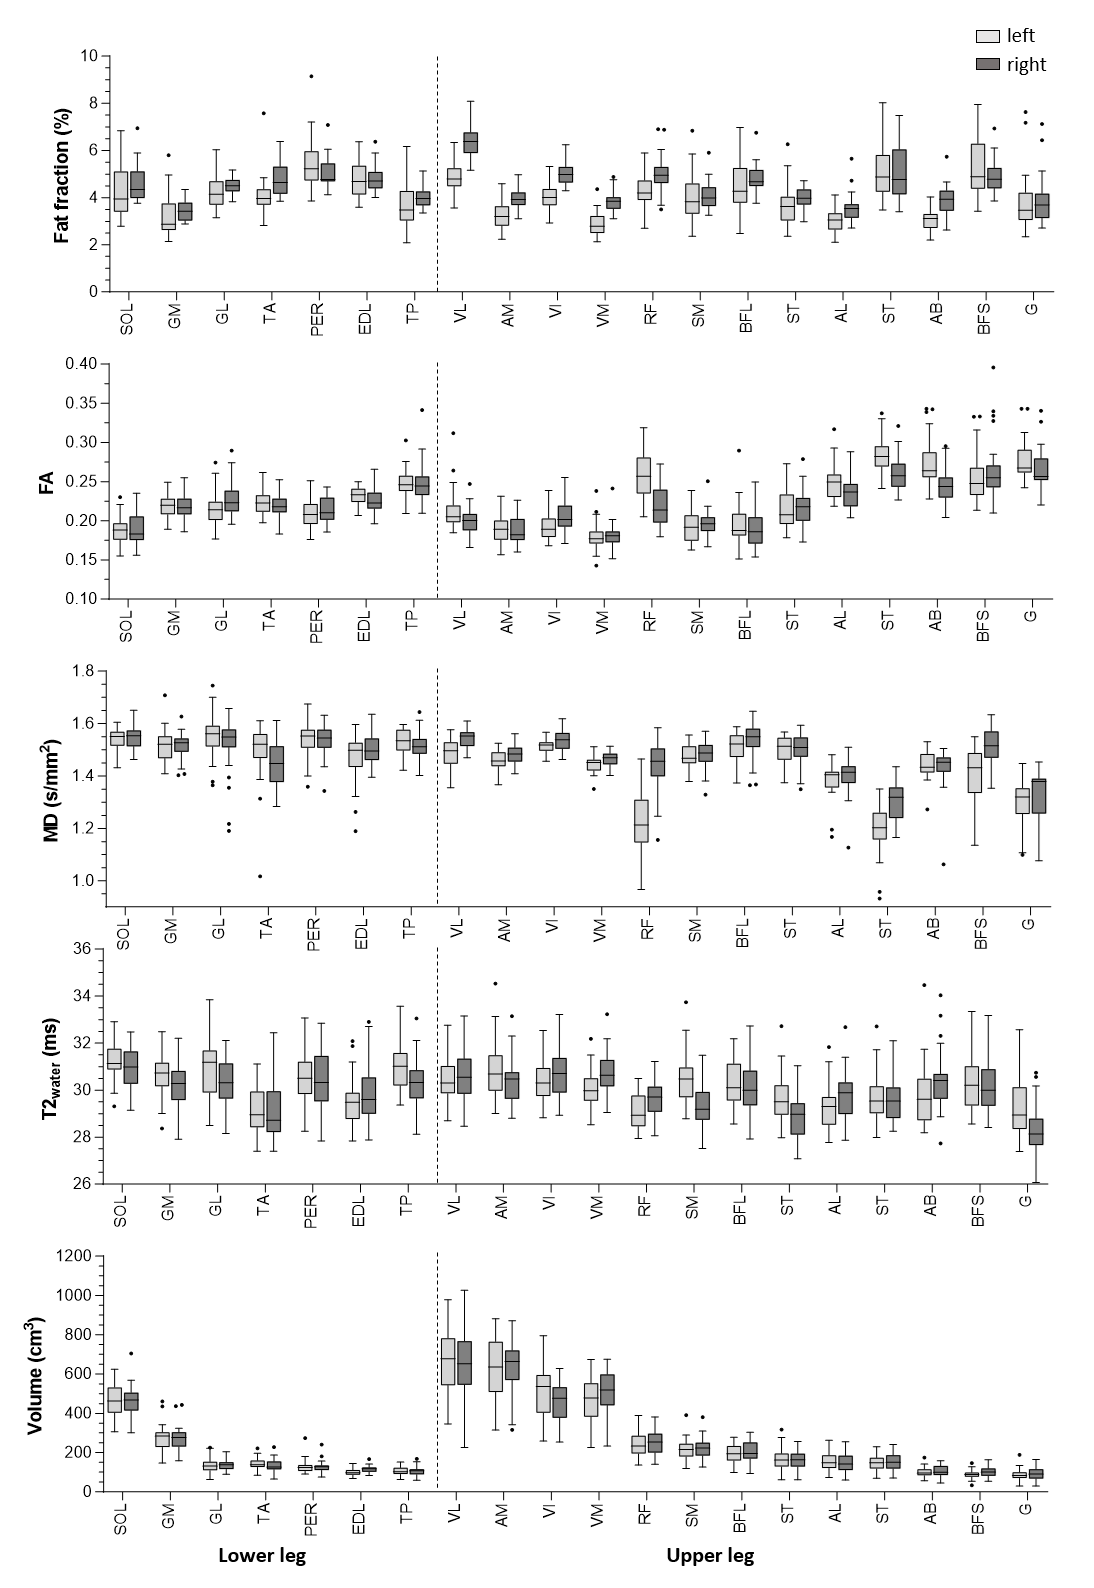
For the first 31 subjects (15 male), average age was 33±11 years and BMI was 22.7±0.5kg/m2 (Table1). Example qMRI maps of 4 subjects are displayed in Fig.1. Average values for each muscle and side are presented in Fig.2.Effect of gender, muscle type and muscle side
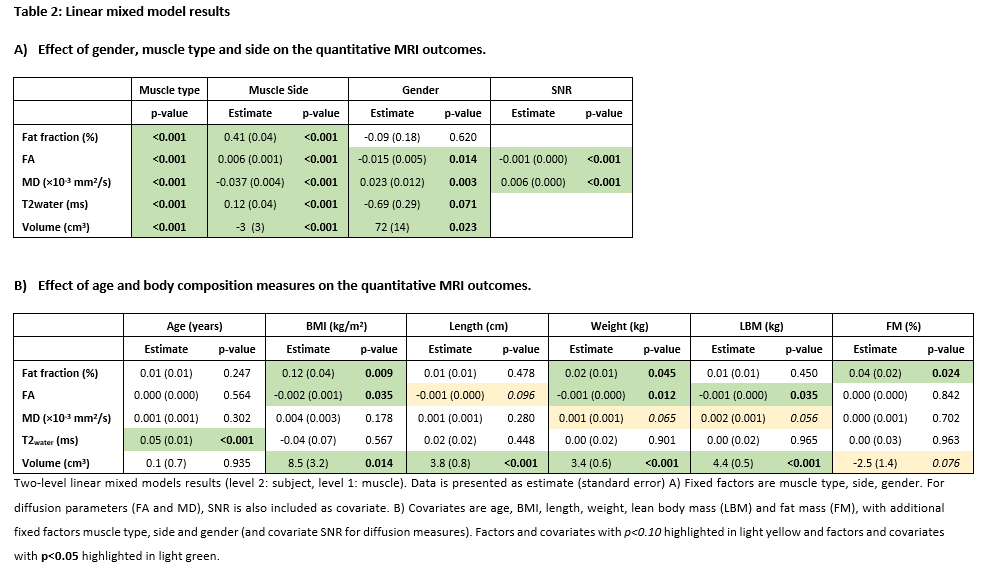
All qMRI measures exhibit differences between muscles and right and left leg (p<0.001;Table2). Furthermore, gender influences all qMRI measures except for FF; males exhibit lower FA and higher MD (-0.015[0.005] and +0.023[0.012] mm2/s, respectively), higher muscle volumes (72[14] cm3) and lower T2water (-0.69[0.29] ms). Therefore, gender, muscle type and muscle side are necessary to include in the full statistical model.
Effect of age and body composition
Fig.3 presents visual representations of relations between qMRI measures and gender, age and body composition, each individual muscle is linearly fitted, and Table2 lists LMM outcomes. Only age shows a linear relation with T2water, increasing by 0.05(0.01) ms/year (p<0.001). In contrast, body composition displays multiple relationships with qMRI mostly affecting FF, FA and muscle volume and moderately affecting MD. FF increases with BMI (0.12[0.04] %, p=0.009), weight (0.02%[0.01] %, p=0.045) and FM (0.04[0.02] %, p=0.024). For diffusion measures, body composition primarily affects parameters in females. FA decreases with higher BMI (-0.002[0.001], p=0.035), length (-0.001[0.000], p=0.096), weight (-0.001[0.000], p=0.012) and LBM (-0.001[0.000], p=0.035), but remains independent of FM. MD slightly increases with weight (0.002[0.001] mm2/s, p=0.065) and LBM (0.002[0.001] mm2/s, p=0.056). Muscle volume strongly increases with BMI (8.5[3.2] cm3, p=0.014), length (3.8[0.8] cm3, p<0.001), weight (3.4[0.6] cm3, p<0.001) and LBM (4.4[0.5] cm3, p<0.001), and slightly decreases with BIA (-2.5[1.4] cm3, p=0.076).
Discussion and Conclusion
So far, we scanned 20% of the intended subjects with our bilateral whole leg data-acquisition protocol. MOTION study’s initial findings indicate our data can identify critical covariates for qMRI; relations between gender, muscle type and side previously described for small parts of the leg or thigh, were confirmed in our study.4–6 Key observations include that, except for T2water, gender outweights age in importance, and adding BIA to traditional body composition measures (BMI/length/weight) differentiates BMI effects due to muscle mass or subcutaneous fat. Supported by earlier work4, T2water strongly depends on age and gender, where effect size aligns with expected pathological changes (2-3 ms7). Unlike recent studies4, diffusion parameters showed no age correlation, likely due to limited sample size and a maximum age of 60.6 Body composition measures (BMI/length/weight) correlate with FF and diffusion.4 Heavier subjects with higher body fat exhibit increased intramuscular FF. Larger subjects display lower FA and higher MD values, suggesting larger muscle fibres, particularly in females. This size effect holds for muscle volume, irrespective of body fat percentage.Acknowledgements
We like to thank all participants for their participation.
This work was supported by VIDI research programme (project number: 18929) of the Dutch Research Council (NWO).
References
1.Strijkers GJ, Araujo ECA, Azzabou N, et al. Exploration of new contrasts, targets, and MR imaging and spectroscopy techniques for neuromuscular disease-A workshop report of working group 3 of the biomedicine and molecular biosciences COST action BM1304 MYO-MRI. J Neuromuscul Dis 2019;6(1):1–30.
2.Carlier PG, Marty B, Scheidegger O, et al. Skeletal Muscle Quantitative Nuclear Magnetic Resonance Imaging and Spectroscopy as an Outcome Measure for Clinical Trials. J Neuromuscul Dis 2016;3(1):1–28.
3. Froeling M. QMRTools: a Mathematica toolbox for quantitative MRI analysis. J Open Source Softw 2019;4(38):1204.
4. Schlaffke L, Rehmann R, Rohm M, et al. Multi‐center evaluation of stability and reproducibility of quantitative MRI measures in healthy calf muscles. NMR Biomed 2019;32(9)
5. Schlaffke L, Rehmann R, Froeling M, et al. Diffusion tensor imaging of the human calf: Variation of inter‐ and intramuscle‐specific diffusion parameters. Journal of Magnetic Resonance Imaging 2017;46(4):1137–1148.
6. Cameron D, Reiter DA, Adelnia F, et al. Age‐related changes in human skeletal muscle microstructure and architecture assessed by diffusion‐tensor magnetic resonance imaging and their association with muscle strength. Aging Cell 2023;22(7)
7. Wokke BH, Van Den Bergen JC, Hooijmans MT, et al. T2 relaxation times are increased in Skeletal muscle of DMD but not BMD patients. Muscle Nerve 2016;53(1):38–43.
Figures