5035
Per-voxel classification of Modic changes in conventional MRI1Department of Medical Radiation Sciences, University of Gothenburg, Gothenburg, Sweden, 2Department of Medical Physics and Biomedical Engineering, Sahlgrenska University Hospital, Gothenburg, Sweden, 3Department of Radiology, University of Gothenburg, Gothenburg, Sweden, 4Department of Orthopaedics, University of Gothenburg, Gothenburg, Sweden
Synopsis
Keywords: Bone, Data Analysis, Spine
Motivation: Modic Changes (MCs) are often heterogeneous and difficult to classify objectively. Hence, new diagnostic tools are required to improve MC classification.
Goal(s): This study aims to develop a data-driven model for the classification of MC lesions on a per-lesion and per-voxel level from conventional MR images.
Approach: Conventional MR images from 12 patients were used to create an MC classification model by fitting three multivariate normal distribution functions to the MRI MC data which was subsequently used for MC classification.
Results: The model reached high accuracy (74-100%), enabling a detailed classification on a per-voxel level and longitudinal tracking of MC transitions.
Impact: This study introduces a data-driven model for classifying Modic changes in vertebral bone marrow using MR images. The model achieves high accuracy, enabling detailed classification and tracking of Modic change transitions, potentially improving patient diagnosis and care.
Introduction
Pathological lesions in the subchondral vertebral bone marrow, so-called Modic changes (MC), are composed of hypervascular tissue, fat, and sclerosis and are known to be associated with pain [1]. MC lesions are often mixed and contain several types of MCs, making the subjective classification process of these heterogeneous lesions challenging and prone to large variations in intra- and interobserver performance. This may explain why there is a lack of clinical evidence supporting the effect of MC on clinical outcomes in patients with pain. Hence, new diagnostic tools are required to improve MC classification and to clarify the pathogenesis of MC. Consequently, recent research has focused on data-driven methods to automatically classify the MC lesions. However, classification methods that can handle heterogeneous lesions are lacking. This study aimed to develop a data-driven model for the classification of MC lesions on a per-lesion and per-voxel level from conventional MR images.Methods
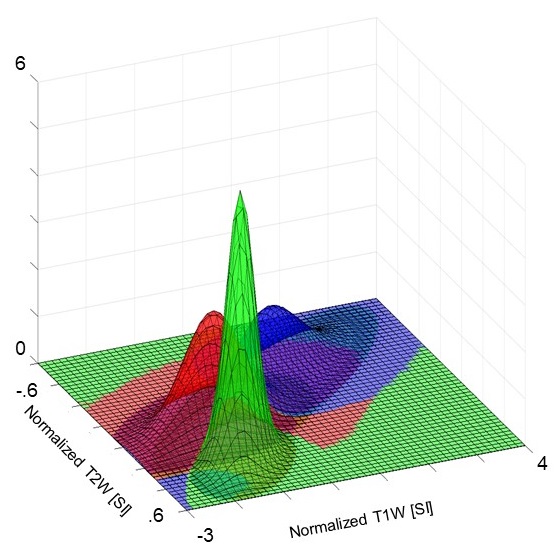
19 MCs in 12 patients (47±10 years, 6 men (50%)), that were considered to be composed of one type of MC (“pure MC”), were included. Using the T1-weighted (T1W) and T2-weighted (T2W) images, one radiologist classified the MC-lesions according to the Modic classification system. The MCs were outlined by a medical student supervised by an experienced radiologist, creating a region of interest (ROI) for each lesion. The lesion voxel intensities were normalized to healthy vertebrae (normal tissue) and cerebrospinal fluid (CSF) to compensate for possible differences in magnetic resonance signal amplification and differences in water and fat concentrations between subjects.The MC type of each voxel in the MC lesion was predicted by fitting three multivariate normal distribution functions to the normalized T1W and T2W values of the MC lesions. This generated three partially overlapping probability density functions (PDFs), one for each MC type. With normalized T1W and T2W voxel values as input, the PDF generating the highest probability determined the type of MC for that voxel (Figure 1).
To classify an entire MC lesion, first, all individual pixels in the lesion were classified in the manner described. The PDF that generated the highest relative likelihood for the majority of pixels in the specific lesion determined the MC type for that lesion. The classification model was validated using 10-fold cross-validation and evaluated in terms of sensitivity, specificity, and accuracy. Further, a receiver operating characteristic curve (ROC) and the area under curve (AUC) were calculated.
The classification model was validated using 10-fold cross-validation and evaluated in terms of sensitivity, specificity, and accuracy. Further, a receiver operating characteristic curve (ROC) and the area under curve (AUC) were calculated.
Results
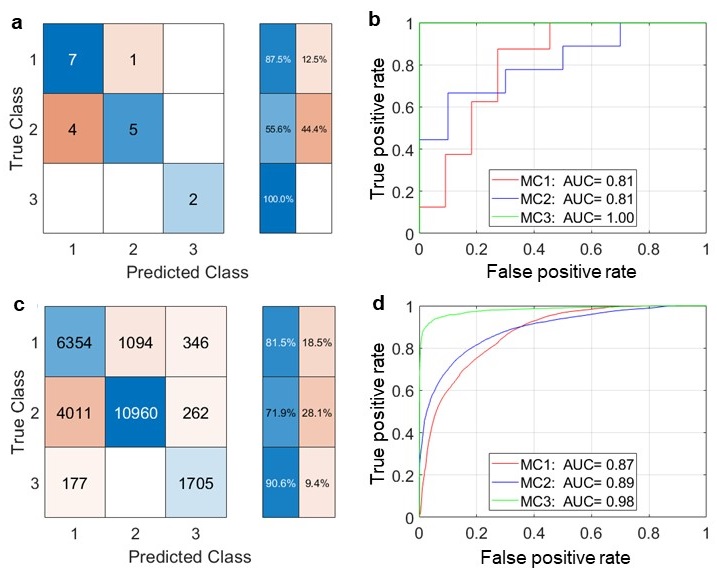
Out of 19 MC lesions, eight were MC1, nine were MC2, and two were MC3. The classification model was found to display a good discriminating ability for all three MC types:On a per-lesion level, the model reached a sensitivity of 88%, 56%, and 100%, a specificity of 64%, 90%, and 100%, an accuracy of 74%, 74%, and 100% and an AUC of 0.81, 0.81, and 1.00 for MC1, MC2 and MC3 respectively.
On a per-voxel level, the model reached a sensitivity of 81%, 71%, and 90%, a specificity of 75%, 88%, and 97%, an accuracy of 77%, 78%, and 96%, and an AUC of 0.87, 0.89, and 0.98 for MC1, MC2, and MC3 respectively (Figure 2).
Discussion
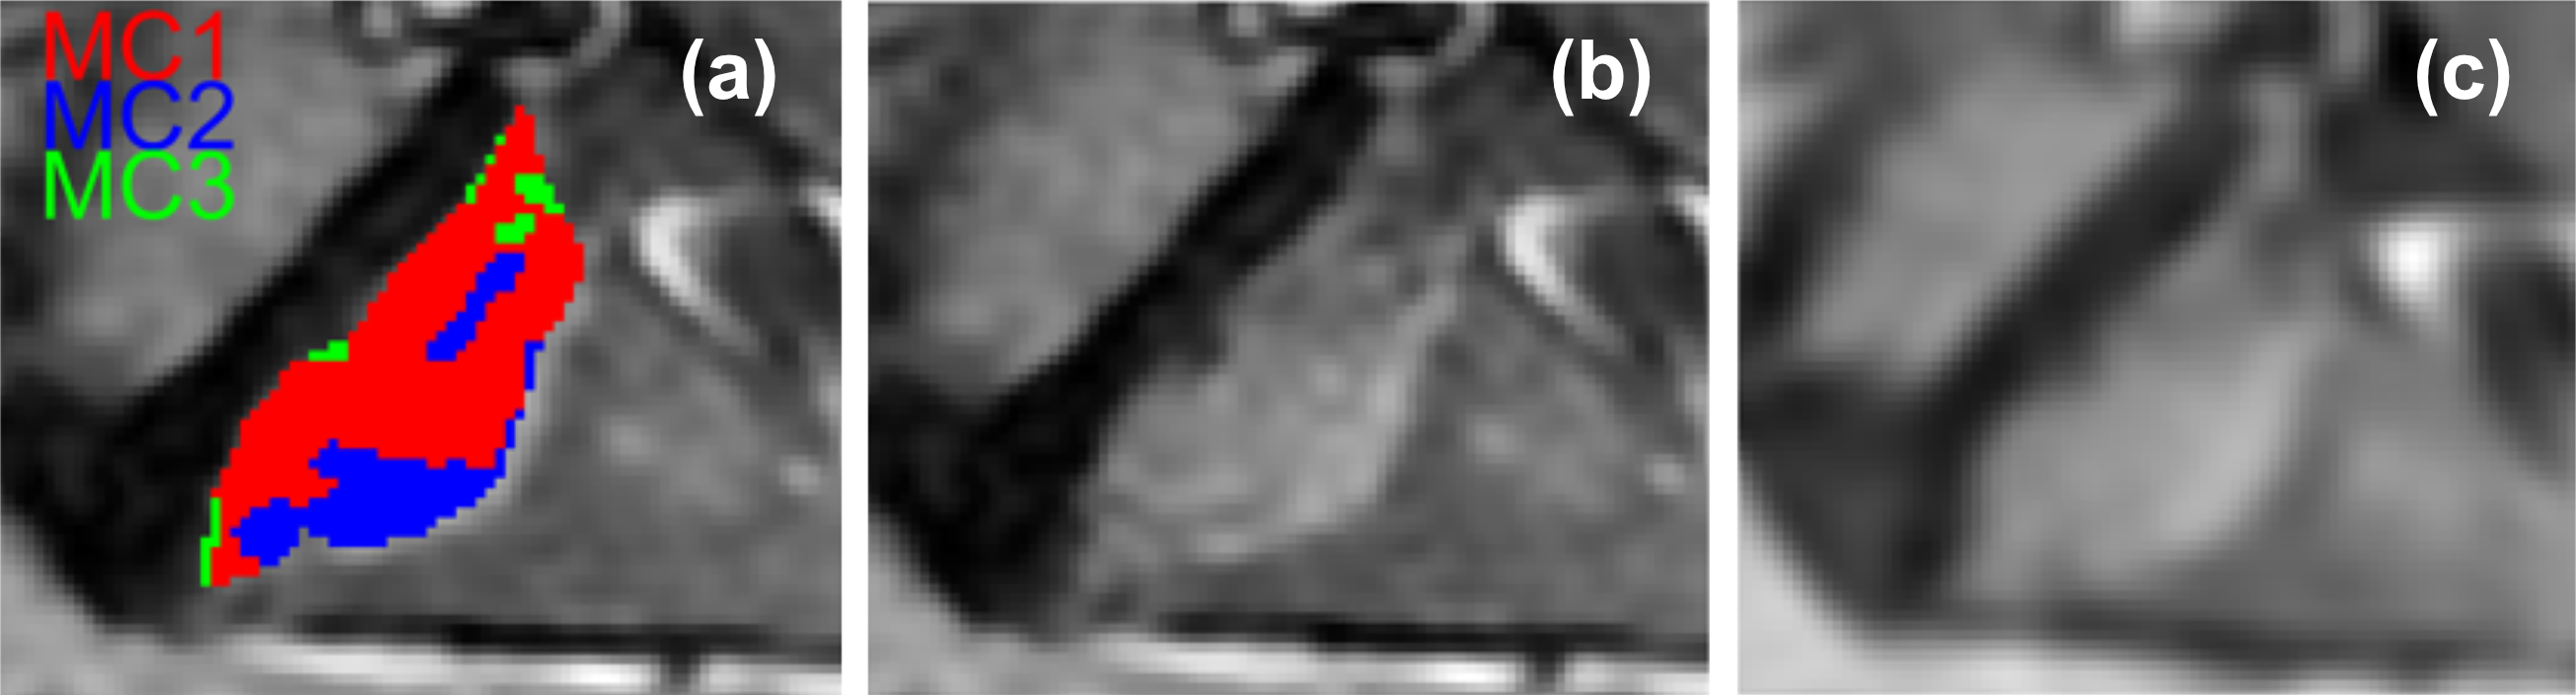
The study addressed challenges in classifying Modic changes (MC) using a data-driven model, achieving high accuracy (74-100%), enabling a detailed classification and longitudinal tracking of MC transitions. Several previous contributions have improved MC identification and classification [2, 3]. However, none compensate for the variability in water and fat concentration between individuals, which may impact the models' generalizability to a diverse population. This study explores MC lesion heterogeneity, allowing for the identification of regions with different MC subtypes. Notably, there are potential patches of multiple MC subtypes within individual lesions used as ground truth (Figure 3), which could explain the overlap in the PDFs for MC1 and MC2, warranting further investigation.Conclusions
The method confidently classified the MCs on a per-lesion and per-voxel level, enabling precise and objective classification of MCs and supporting longitudinal tracking of regional Modic transitions.Acknowledgements
No acknowledgement found.References
1. Mok, F.P.S., et al., Modic changes of the lumbar spine: prevalence, risk factors, and association with disc degeneration and low back pain in a large-scale population-based cohort. The Spine Journal, 2016. 16(1): p. 32-41.
2. Jamaludin, A., T. Kadir, and A. Zisserman, SpineNet: Automated classification and evidence visualization in spinal MRIs. Med Image Anal, 2017. 41: p. 63-73.
3. Athertya, J.S., G. Saravana Kumar, and J. Govindaraj, Detection of Modic changes in MR images of spine using local binary patterns. Biocybernetics and Biomedical Engineering, 2019. 39(1): p. 17-29.
Figures